
Related Manuals for Holzworth Instrumentation HA7701A


Summary of Contents for Holzworth Instrumentation HA7701A
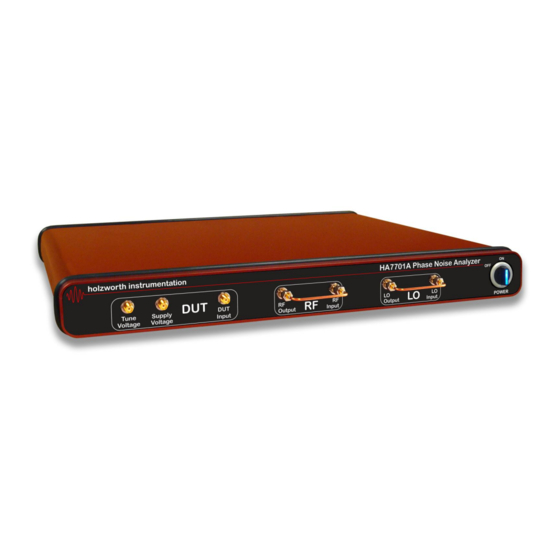
- Page 1 HA7701A PHASE NOISE ANALYZER User Manual 1.04 Holzworth Instrumentation Inc. 2540 Frontier Ave., Suite 200 Boulder, CO 80301 USA www.holzworth.com...
- Page 2 This page intentionally left blank. Page 1 of...
-
Page 3: Table Of Contents
Table of Contents 1.0 HA7701A CONFIGURATION SUMMARY ................. 4 2.0 PERFORMANCE SUMMARY ....................5 2.1 DUT INPUT (RF SIGNAL INPUT FOR ADDITIVE MODE) ............ 5 2.2 SUPPLY & TUNE VOLTAGE ....................5 2.3 PHASE NOISE MEASUREMENTS ..................5 2.4 INPUT DAMAGE THRESHOLD ..................... 5 2.5 INSERTION LOSS DATA ...................... - Page 4 4.9.2 SPUR DISPLAY ......................29 4.9.3 RIGHT CLICK FUNCTIONS ..................30 4.10 MARKERS ......................... 31 4.11 LIMITS (Pass/Fail Limit Lines) ................... 32 4.11.1 LIMIT CONTROLS & CONFIGURATION ..............32 4.12 DISPLAY ..........................33 4.12.1 PLOT DISPLAY RANGES ................... 33 4.12.2 PLOT DISPLAY OPTIONS ..................33 4.12.3 PLOT DISPLAY LABELS ....................
-
Page 5: Ha7701A Configuration Summary
1.0 HA7701A CONFIGURATION SUMMARY A simplified block diagram of the HA7701A internal configuration is shown below. The HA7701A was designed to accommodate two measurement modes, Absolute and Additive. The signal path is internally switched to route the signal path for the selected measurement mode. -
Page 6: Performance Summary
Spurious Analysis Provides spurious performance data based on a user settable Spur Threshold 2.4 INPUT DAMAGE THRESHOLD The HA7701A internal mixer (phase detector) will be the point of failure due to excessive RF power. DESCRIPTION SPECIFICATION Phase Detector Damage Level... -
Page 7: Insertion Loss Data
2.5 INSERTION LOSS DATA Data in this section outlines the insertion loss through the signal pathways internal to the instrument. Driving the internal mixer (phase detector) with appropriate power levels is essential to both Absolute and Additive phase noise measurement modes. 2.5.1 LO Insertion Loss (DUT/Signal Input to Internal Mixer LO port) ... -
Page 8: Rf Insertion Loss - Absolute Mode (Dut Input To Internal Mixer Rf Port)
2.5.2 RF Insertion Loss - Absolute Mode (DUT Input to Internal Mixer RF port) The data below represents the insertion loss in Absolute (Delay Line) measurement mode with the HA7701A internal delay line. 2000 5000 8000 11000 14000 17000 20000 Frequency (MHz) 2.5.3 RF Insertion Loss - Additive Mode (Signal Input to RF Mixer) -
Page 9: Rf Insertion Loss - Additive Mode (Signal Input To Rf Output)
2.5.4 RF Insertion Loss - Additive Mode (Signal Input to RF Output) -3.5 -4.5 -5.5 2000 5000 8000 11000 14000 17000 20000 Frequency (MHz) NOTE: Account for the loss in this path to ensure an appropriate input power level is set for the DUT. -
Page 10: Absolute Measurement Sensitivity
2.6 ABSOLUTE MEASUREMENT SENSITIVITY Absolute measurement sensitivity is inherently affected by delay line length. Sensitivity can be optimized for different DUT's by using an external delay line. This section will demonstrate the effect of the delay line on the measurement sensitivity and useful offset frequency. Consider the measurement offset frequency range of concern for the DUT when determining whether an external delay line is necessary. - Page 11 14GHz EXT Delay Line - HA7701A (orange trace): With an external delay line now in use (T = ~120ns), it can be seen that the measurement sensitivity improved by approximately 10-20dB depending on offset frequency, however the first measurement null can now be seen at ~10MHz offset.
-
Page 12: Additive Measurement Sensitivity
2.7 ADDITIVE MEASUREMENT SENSITIVITY Additive measurement sensitivity (noise floor) is affected by the power levels achieved at HA7701A internal mixer. Careful approach is required to ensure suitable measurement sensitivity for the DUT. This can be demonstrated with the hardware configuration below. -
Page 13: Additive Measurement Sensitivity (+16Dbm Lo Power)
2.7.1 Additive Measurement Sensitivity (+16dBm LO Power) Measurement details: Measurement Statistics ZCOMM VCO Frequency 2.78GHz DUT Pwr +21dBm LO Pwr +16dBm +13dBm (no attenuation) RF Pwr -7dBm (20dB attenuation) Measurement results: Page 12 of... -
Page 14: Additive Measurement Sensitivity (+13Dbm Lo Power)
2.7.2 Additive Measurement Sensitivity (+13dBm LO Power) Measurement details: Measurement Statistics ZCOMM VCO Frequency 2.78GHz DUT Pwr +18dBm LO Pwr +13dBm +10dBm (no attenuation) RF Pwr -10dBm (20dB attenuation) Measurement results: Page 13 of... -
Page 15: Additive Measurement Sensitivity (+10Dbm Lo Power)
2.7.3 Additive Measurement Sensitivity (+10dBm LO Power) Measurement details: Measurement Statistics ZCOMM VCO Frequency 2.78GHz DUT Pwr +15dBm LO Pwr +10dBm +7dBm (no attenuation) RF Pwr -13dBm (20dB attenuation) Measurement results: Page 14 of... -
Page 16: Phase Noise Analyzer Installation
The HolzworthPNA software application is included on the thumb drive that ships with the HA7701A. If the thumb drive is missing another can be mailed or the software can be downloaded after contacting Holzworth support via email at: support@holzworth.com or by phone at +1.303.325.3473 (option 2). -
Page 17: Holzworth Pna Software Application
4.0 HOLZWORTH PNA SOFTWARE APPLICATION NOTE: The HA7701A application GUI does not require any driver installation. Simply run the Holzworth7701 executable file to launch the software. Analyzer GUI Application Folder Page 16 of... -
Page 18: Usb, Rs-232, And Gpib Communication
'Devices' will turn blue to indicate a USB connection, and it will display the instrument serial number: 4.1.1 GPIB COMMUNICATION Appendix C contains ASCII commands that can be used to configure the HA7701A GPIB settings. Page 17 of... -
Page 19: Determining Instrument Virtual Com Port
4.1.2 DETERMINING INSTRUMENT VIRTUAL COM PORT The COM port associated with the USB connection to the HA7701A can be manually located using the Windows Device Manager. Steps to do this are as follows. STEP ONE Open the Windows Control panel from the start menu. -
Page 20: Ethernet Communication
Users can also enter the instruments IP address manually to connect. Enter the IP address into the 'Device IP Address' field and then press the Connect button. 4.2.2 DIRECT PC CONNECTION (DHCP) When the HA7701A is connected directly to a PC and it is set to DHCP, the instrument's default IP address is: 169.254.117.11... -
Page 21: Assigning A Static Ip Address
5. Begin by querying with the :IP:STATUS? command. Change status and/or re-configure the static network settings as necessary. 6. Power cycle the HA7701A if prompted. Any status change from DHCP to Static or vice versa will require a power cycle. - Page 22 The Holzworth Ethernet Finder Tool can be used to assign a static IP address to the instrument. Instructions to do so are as follows. Email Holzworth support (support@holzworth.com) for a link to download the Holzworth Ethernet Finder GUI. To assign a static IP address, launch the EthernetFinder.jar file. Click Locate Device and select your instrument by its serial number, then select the 'Static IP' radio button, enter the static IP settings, and press Save.
-
Page 23: Gui Overview
4.3 GUI OVERVIEW The reference numbers on the dashboard image correspond with the descriptions contained on the following page. Page 22 of... - Page 24 'Acquire' will overlay new measurements to the measured data already captured in the plot area. 3. Devices: 'Devices' allows the user to view any HA7701A analyzer directly connected to the PC (USB or Ethernet) or over a LAN connection. Select the device by part number & serial number to establish a connection.
-
Page 25: Firmware Updates
4.4 FIRMWARE UPDATES NOTE: Internet connection required to check for firmware updates. It is also recommended to use a desktop computer for firmware updates. If a laptop is used it is recommended that power be plugged in to the laptop. First establish a USB connection as shown in section 4.1. -
Page 26: Measurement
4.5 MEASUREMENT The Measurement menu provides access to measurement settings including frequency offset range, number of correlations, as well as the option to enable infinite correlations/averages (Persist) or a 'n' number of correlation/average measurement repeated indefinitely (Continuous). 4.5.1 MEASUREMENT SETUP ... -
Page 27: Frequency Span (Offset Adjustment)
4.5.2 FREQUENCY SPAN (OFFSET ADJUSTMENT) Measurement: Adjust the frequency offset start/stop of the measurement. Minimum start frequency is 0.1Hz, Maximum stop frequency is 40MHz. Integration: Adjust the integration range for calculating RMS Noise and RMS Jitter. Calculation results are displayed with other measurement stats below the plot area. 4.5.3 TRIGGER/AVERAGING/BANDWIDTH ... -
Page 28: Inputs
Delay Line and enter the delay value of the external delay line. 4.7 OUTPUTS The Outputs button provides the user access to user adjustable Supply Voltage and Tune Voltage outputs at the HA7701A front panel. Supply Voltage: Adjustable from 0Vdc to 12Vdc ... -
Page 29: Acquiring Data
4.8 ACQUIRING DATA Once the test hardware is setup, and all necessary Measurement, Inputs, and Outputs menu parameters have been verified, users can initialize a measurement by clicking the Acquire button. Acquire/+: When the '+' button is depressed, selecting 'Acquire' will overlay new measurements to the measured data already captured in the plot area. -
Page 30: Smoothing
4.9.1 SMOOTHING Smoothing: A Smoothing function can be applied to the data that applies a number of points (N) as a sliding-average algorithm to compute the smoothing curve. The user enters an odd value for the number of Points. If an even number is entered, the application will round up to the next odd number to apply the curve. -
Page 31: Right Click Functions
4.9.3 RIGHT CLICK FUNCTIONS Select and right click a trace to perform the following functions: Reset Axes to the Measurement Range or to the range set in section 4.12 Display. Quick access to the Smoothing and Spur Display functions. ... -
Page 32: Markers
4.10 MARKERS Markers provide the user with amplitude data at specific offset frequencies. There are two sets of Markers available, Decade Markers and User Markers. NOTE: If Smoothing is applied to a trace, the Markers will appear on the value calculated by the smoothing function. -
Page 33: Limits (Pass/Fail Limit Lines)
4.11 LIMITS (Pass/Fail Limit Lines) 4.11.1 LIMIT CONTROLS & CONFIGURATION Limit Points are added by clicking the Add Limit Point button, and are added one by one to form a Limit Line. Use the 'X' button to remove a given limit point. ... -
Page 34: Display
4.12 DISPLAY Display settings allow the user to manipulate the plot area, and have no effect on a measurement or any acquired data. 4.12.1 PLOT DISPLAY RANGES X-Axis Start/Stop: Manually adjust the x-axis (frequency), or check the 'Use Meas Range' box to have the display automatically use the measurement range set in the 'Measurement' menu. -
Page 35: Plot Display Labels
4.12.3 PLOT DISPLAY LABELS Plot Title, X-Axis Label, Y-Axis Label and Trace Names are completely customizable by the user by editing the text in the fields shown above. Also choose whether or not to show each label, and choose how to name traces in the legend. Traces can be names by the text in the Trace Name field, by frequency of the DUT signal, or by power level of the DUT signal. -
Page 36: File Menu
4.13 FILE MENU 4.13.1 SAVE/LOAD DATA (HOLZWORTH TRACE FILE, .HTF) Users can Save and Load data in the 'Holzworth Trace File' (.htf) file format via the File Menu. A 'Holzworth Trace File' can only be saved and opened by the HolzworthPNA software. -
Page 37: System Menu
4.14 SYSTEM MENU Save Instrument Settings saves the current instrument configuration to internal memory. When power cycled the instrument will power on in this saved state. Preset Instrument Settings returns the instrument to a factory default state. Once the factory default state is recalled users must save this state in order for the instrument to power on in this configuration. -
Page 38: Measurement Examples & Guidelines
Measurement null occurs at offset frequency f = 1/T. For internal delay line measurements the null occurs at approximately 51MHz, outside of the measurement range of the HA7701A. f = 1/T calculation can be used when using an external delay line to determine where first measurement null will occur and if it will be within the measurement offset range. - Page 39 NOTE: For Absolute measurement with the HA7701A internal delay line, omit changing the internal/external delay line setting in step 1 below. 1. Once connected to the HA7701A via the Holzworth GUI, click the Inputs button in order to enter DUT frequency, set delay line to External, and enter the delay value.
-
Page 40: Additive Measurement
5.2 ADDITIVE MEASUREMENT General Guidelines A baseline noise floor measurement should be taken prior to measuring a DUT. The baseline measurement should be made with the same power levels at the internal mixer in order to accurately reflect the noise floor of the system when the DUT is being measured. ... - Page 41 Software Configuration 1. Once connected to the HA7701A via the Holzworth GUI, click the Inputs button in order to enter DUT frequency, select for external delay line, and enter the delay value. 2. If necessary to power or tune the DUT via the HA7701A front panel, navigate to the Outputs menu to enable DUT supply and tune voltage outputs.
- Page 42 4. Verify the noise floor of the system by taking a measurement without the DUT in place but with the same power levels at the internal mixer. 5. Connect the DUT into the system. 6. Click Acquire to initialize the measurement and view the results displayed in the plot area. Page 41 of...
-
Page 43: Contact Information
6.0 CONTACT INFORMATION Contact Holzworth directly for product support. A list of US Sales Representatives and non-US Distribution partners are listed on the Holzworth website. Holzworth Instrumentation Sales Support Phone: +1.303.325.3473 (option 1) Email: sales@holzworth.com Holzworth Instrumentation Technical Support Phone: +1.303.325.3473 (option 2) Email: support@holzworth.com... -
Page 44: Appendix A: Ascii Programming Commands
APPENDIX A: ASCII PROGRAMMING COMMANDS The Holzworth Instrumentation HA7000C phase noise analyzers allow users to communication with the instrument over a wide range of communication methods using their own application software. The programming commands are ASCII commands sent over USB, Ethernet, RS-232 or GPIB. - Page 45 Instrument Configuration (stored in memory until power cycle, can be entered in any order) Set Measurement Type :SENS:PN:MEAS:TYPE:<value> Sets the measurement type to be performed Example :SENS:PN:MEAS:TYPE:ADDITIVE Measurement type set <value> = Absolute or Additive :SENS:PN:MEAS:TYPE? Reads back measurement type Example :SENS:PN:MEAS:TYPE? Additive...
- Page 46 Set # of Correlations :SENS:PN:CORR:COUN:<value> Sets # of correlations Example :SENS:PN:MEAS:TYPE:10 Number of correlations set :SENS:PN:CORR:COUN? Reads back # of correlations Example :SENS:PN:CORR:COUN? Page 45 of...
- Page 47 Set Frequency Offset Start/Stop :SENS:PN:FREQ:STAR:<value> Sets frequency offset start (how close to the carrier to measure) Example :SENS:PN:FREQ:STAR:100Hz Frequency start set :SENS:PN:FREQ:STAR? Query measurement start frequency Example :SENS:PN:FREQ:STAR? :SENS:PN:FREQ:STOP:<value> Sets frequency offset stop (how far from the carrier to measure) Example :SENS:PN:FREQ:STAR:10MHz Frequency stop set...
- Page 48 Set Jitter Analysis Range :CALC:PN:TRAC:BDM:X:STAR:<value> Sets the jitter integration start frequency Example :CALC:PN:TRAC:BDM:X:STAR:100 Band marker start set :CALC:PN:TRAC:BDM:X:START? Queries jitter integration start frequency Example :CALC:PN:TRAC:BDM:X:STAR? :CALC:PN:TRAC:BDM:X:STOP:<value> Sets the jitter integration stop frequency Example :CALC:PN:TRAC:BDM:X:STOP:10MHz Band marker stop set :CALC:PN:TRAC:BDM:X:STOP? Queries jitter integration stop frequency Example :CALC:PN:TRAC:BDM:X:STOP? 10000000...
- Page 49 Set Trigger Type :SENS:PN:MODE:<value> Sets the trigger type of the measurement Example :SENS:PN:MODE:PERSIST Persist mode set <value> Single, Each, Continuous, Persist :SENS:PN:MODE? Queries trigger type Example :SENS:PN:MODE? Persist Set Data Resolution :SENS:PN:SAMPLES:COUN:<value> Sets the data resolution for the measurement Example :SENS:PN:MEAS:TYPE:512 Number of samples set <value>...
- Page 50 DUT Power Supply :SENS:PN:DUT:VSUPPLY:<value> Sets the DC voltage of the DUT supply Example :SENS:PN:DUT:VSUPPLY:12.000V 12.000 Volts written to supply voltage output <value> 0.000 to 12.000 :SENS:PN:DUT:VSUPPLY? Queries DUT supply voltage Example :SENS:PN:DUT:VSUPPLY? 12.000 Volts :SENS:PN:DUT:ILIMIT:<value> Set DUT supply current limit Example :SENS:PN:DUT:ILIMIT:0.2 0.200 Amps written to supply current limit...
- Page 51 Measurement Command Sequence Initialize Measurement :INIT:PN:IMM Begins the measurement Example :INIT:PN:IMM Phase noise measurement initialized Check Measurement Status :SENS:PN:CORE:STATUS? Queries measurement status Example :SENS:PN:CORE:STATUS? "Phase noise measurement initialized" OR "Data not ready" Loop issuing this command until you receive "Phase noise measurement initialized".
- Page 52 Check Instrument Status :STAT:OPER:COND? Returns the status of the instrument Example :STAT:OPER:COND? "Instrument Busy" OR "Instrument Ready" Loop issuing this command until you receive "Instrument Ready" Number of Points :SENS:PN:SWE:POIN? Returns the number of measurement points Example :SENS:PN:SWE:POIN? Integer value will vary based on measurement settings Page 51 of...
- Page 53 Pull Amplitude Data From Instrument :CALC:PN:DATA:FDAT? Returns the amplitude data Example :CALC:PN:DATA:FDAT? Returns amplitude data in comma separated string Continue reading data until the number of points match the number returned from the previous command. Pull Frequency Data From Instrument :CALC:PN:DATA:XDAT? Returns the frequency data Example...
- Page 54 Jitter Measurement Jitter Measurement Settings :CALC:PN:TRAC:BDM:X:STAR:<value> Jitter integration frequency start Example :CALC:PN:TRAC:BDM:X:STAR:1kHz Band marker start set :CALC:PN:TRAC:BDM:X:STOP:<value> Jitter integration frequency stop Example :CALC:PN:TRAC:BDM:X:STOP:10MHz Band marker stop set Jitter settings are stored in memory until a power cycle. They can be entered in any order and can be modified repeatedly without re-initializing a measurement.
- Page 55 Smoothing and Spur Removal Functions Spur Removal :CALC:PN:TRAC:SPUR:OMIS:<value> Turn spur removal on/off Example :CALC:PN:TRAC:SPUR:OMIS:ON Spur removal on <value> ON, OFF :CALC:PN:TRAC:SPUR:OMIS? Queries spur removal status Example :CALC:PN:TRAC:SPUR:OMIS? :CALC:PN:TRAC:SPUR:THR:<value> Sets spur removal threshold Example :CALC:PN:TRAC:SPUR:THR:5 5 dB spur threshold set <value> 0 to 99 :CALC:PN:TRAC:SPUR:THR? Queries spur removal threshold Example...
- Page 56 Smoothing :CALC:PN:TRAC:SMO:STAT:<value> Turn smoothing on/off Example :CALC:PN:TRAC:SMO:STAT:ON Smoothing on <value> ON, OFF :CALC:PN:TRAC:SMO:STAT? Queries smoothing status Example :CALC:PN:TRAC:SMO:STAT? :CALC:PN:TRAC:SMO:PNTS:<value> Sets number of smoothing points Example :CALC:PN:TRAC:SMO:PNTS:25 25 smoothing points set <value> 3 to 99 :CALC:PN:TRAC:SMO:PNTS? Queries number of smoothing points Example :CALC:PN:TRAC:SMO:PNTS? :CALC:PN:DATA:FDAT?
-
Page 57: Appendix B: Ethernet Configuration Commands
APPENDIX B: ETHERNET CONFIGURATION COMMANDS Ethernet programming commands may be used to configure static network settings. These commands may be sent via the Console window in the software application. If a command is not understood, the module will have in its buffer: Invalid Command The format for describing the command instruction is as follows: :COMMAND:<value>... - Page 58 :IP:ADDR:<value> Set Static IP Address <value> IP Address Example :IP:ADDR:192.168.10.11 Static IP address changed :IP:ADDR? Query Static IP Address Example :IP:ADDR? 192.168.10.11 :IP:GATEWAY:<value> Set Gateway IP Address for Static IP <value> Gateway address Example :IP:GATEWAY:192.160.10.1 Gateway address changed. :IP:GATEWAY? Query Gateway Address Example :IP:GATEWAY? 192.160.10.1...
-
Page 59: Appendix C: Gpib Configuration Commands
APPENDIX C: GPIB CONFIGURATION COMMANDS :GPIB:ADDR:<value> Set instrument GPIB address <value> 0 thru 30 Example :GPIB:ADDR:5 GPIB Address: 5 :GPIB:ADDR? Query GPIB address Example :GPIB:ADDR? GPIB Address: 5 :GPIB:EOIWLC:<value> Set Instrument GPIB EOI with last character <value> ON <or> OFF Example :GPIB:EOIWLC:ON EOI with last character enabled... - Page 60 USER NOTES Page 59 of...
- Page 61 All rights reserved. Holzworth Instrumentation Inc. 2540 Frontier Ave., STE 200 Boulder, Colorado 80301 USA +1.303.325.3473 www.HOLZWORTH.com Revision 1.04 November 2018...
Need help?
Do you have a question about the HA7701A and is the answer not in the manual?
Questions and answers