
Related Manuals for Holzworth Instrumentation HA7402B


Summary of Contents for Holzworth Instrumentation HA7402B
- Page 1 HA7402B PHASE NOISE ANALYZER RoHS User Manual 1.04 Holzworth Instrumentation Inc. 1722 14 Street, Suite 220 Boulder, CO 80302 USA...
-
Page 3: Table Of Contents
2.1 CE CERTIFICATION ....................3 2.2 RoHS COMPLIANCE ....................3 3.0 PRODUCT WARRANTY ....................3 4.0 CALIBRATION NOTICE ....................3 5.0 HA7402B CONFIGURATION GUIDE ................4 5.0 HA7402B CONFIGURATION GUIDE ................4 5.1 CONFIGURATION SUMMARY ................... 4 5.2 MECHANICAL CONFIGURATION ................5 5.2.1 Product Dimensions ..................... - Page 4 8.4.4 Settings Save / Recall ..................29 8.5 DISPLAY DATA ZOOM .................... 30 9.0 CONTACT INFORMATION ..................31 APPENDIX A: ........................32 EXTERNAL LO MODE - ABSOLUTE MEASUREMENT EXAMPLE ....... 32 www.holzworth.com HA7402B Manual Rev 1.04 Page 2 of 44...
-
Page 5: Introduction
1.0 INTRODUCTION Thank you for purchasing a Holzworth Instrumentation HA7402B Phase Noise Analyzer. This user manual is setup to cover specifications, product configuration, operational features and examples of some common phase noise measurement applications as they relate to the analyzer. -
Page 6: Ha7402B Configuration Guide
5.0 HA7402B CONFIGURATION GUIDE 5.1 CONFIGURATION SUMMARY The HA7402B tunable phase noise analyzer responds to industry demands for a no frills phase noise measurement system that is highly reliable and intuitive while offering measurement speeds that eliminate bottlenecks on manufacturing test lines. -
Page 7: Mechanical Configuration
The HA7000 Series analyzers each come in a 1U high, rack mountable chassis. A universal rack mount bracket kit is an available accessory (Part No.: RACK-1U or RACK2-1U). Mechanical dimensions are listed in inches (and millimeters). 17.00 (432) 15.00 (381) HA7402B FRONT 1.75 REAR (45) www.holzworth.com HA7402B Manual Rev 1.04 Page 5 of 44... -
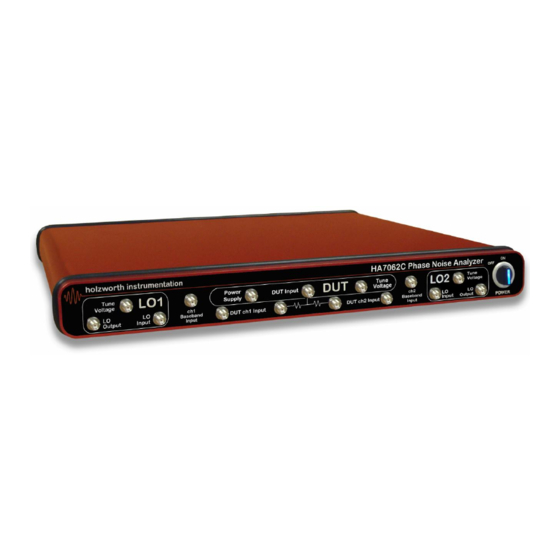
Page 8: Front Panel Connectors
100-240V , 47-63Hz. Output: 12V , 5A . Specify country at time of order. NO GROUND. Data I/O Interface Connector Type DB25 (female) Notes For use with HCM5 Ethernet Communications Module www.holzworth.com HA7402B Manual Rev 1.04 Page 6 of 44... -
Page 9: Operational Environment
Add on Ethernet communications module for HA7000 Series. ACCESSORY RACK-1U 19” Rack mount bracket kit for HA7000 Series. 90º rear. ACCESSORY RACK2-1U 19” Rack mount bracket kit for HA7000 Series. Straight rear. ACCESSORY CASE ACCESSORY www.holzworth.com HA7402B Manual Rev 1.04 Page 7 of 44... -
Page 10: Performance Summary
HA7402A phase noise analyzer. The highly reliable hardware is capable of additional functionality for custom requirements. Inquire with Holzworth Instrumentation or your local sales representative. -
Page 11: Phase Noise Measurement Speed (Sample Time)
± 2ppm (typical), ± 1ppm (specified). 10MHz is for frequency counters only. 6.6 LO MODES MODE DESCRIPTION External LO Mode User supplied LO sources. Auto calibration of LO sources and auto phase lock. www.holzworth.com HA7402B Manual Rev 1.04 Page 9 of 44... -
Page 12: Ssb Phase Noise Sensitivity - Standard
The sensitivity values outlined in this section are based on a single cross correlation. Lower phase noise measurement floors are achieved by running additional cross correlations, as outlined in section 6.4. External LO Mode – Phase Detector Sensitivity www.holzworth.com HA7402B Manual Rev 1.04 Page 10 of 44... -
Page 13: Ssb Phase Noise Sensitivity - Option Opt-Pd1
6.4. NOTE: Installation of OPT-PD1 limits the operating frequency range of the entire instrument from 5MHz to 1.5GHz. Phase Detector Sensitivity – Low Noise Front End www.holzworth.com HA7402B Manual Rev 1.04 Page 11 of 44... -
Page 14: Phase Noise Analyzer Installation
The latest version of Java™ can be downloaded directly from Oracle. To validate what version of Java™ is installed on the host PC or to download the latest version, go to: http://www.java.com/en/download/index.jsp www.holzworth.com HA7402B Manual Rev 1.04 Page 12 of 44... -
Page 15: Loading The Application Gui
Be certain that the entire folder has been extracted. 2. Double click the “HolzworthPNA.jar” Executable Jar File to open the application. The GUI will be immediately displayed on the monitor. www.holzworth.com HA7402B Manual Rev 1.04 Page 13 of 44... -
Page 16: Hardware Installation
The cable that is included with the equipment has a proprietary end fitting that enables secure fastening at the analyzer via 2 captive panel screws (as pictured above). www.holzworth.com HA7402B Manual Rev 1.04 Page 14 of 44... -
Page 17: Ethernet Hardware (Optional)
Ethernet cable is installed. To regain a USB connection, the HCM5 module must be completely removed from the instrument. NOTE 2: For direct PC connection via Ethernet (non-networked) a cross over Ethernet cable is required. www.holzworth.com HA7402B Manual Rev 1.04 Page 15 of 44... -
Page 18: Device Connection
Device Attached” message inside the button, as shown in the diagram above. NOTE that the GUI is universal for Holzworth phase noise analyzer products. GUI functionality will automatically update to appropriately match the capabilities of the selected /attached device. www.holzworth.com HA7402B Manual Rev 1.04 Page 16 of 44... -
Page 19: Application Gui / Operation
Highlighted Field both left and right Up/Down Arrows used to increase/decrease the value of the Highlighted Field Number Keys used to directly enter value into active field www.holzworth.com HA7402B Manual Rev 1.04 Page 17 of 44... -
Page 20: Measurement Settings Sub-Menu
LO Calibration Sub-menu Engine Mode Accesses the LO calibration table to Set for running XCorr test or verify calibrated range of each LO. validating performance of each (or both) external LO. www.holzworth.com HA7402B Manual Rev 1.04 Page 18 of 44... - Page 21 NOTE that smaller interval settings will provide greater accuracy in the frequency measurements, but will also increase the amount of time it takes to complete a measurement. www.holzworth.com HA7402B Manual Rev 1.04 Page 19 of 44...
- Page 22 The LO calibration table is also a valuable reference for External LO Mode to verify that the DUT is within the calibrated range of the LOs for proper phase locking. Refer to the measurement examples in the Appendices for more details. www.holzworth.com HA7402B Manual Rev 1.04 Page 20 of 44...
- Page 23 Monitor tool is used to calculate Kd once quadrature is achieved via phase offset adjustments. Kd is then manually entered into this field by pressing the Apply Kd button inside the Quadrature Monitor sub-menu. www.holzworth.com HA7402B Manual Rev 1.04 Page 21 of 44...
-
Page 24: Display Settings Sub-Menu
NOTE that the X-axis will automatically scale to match the measurement offset range that is setup in the Measurement Sub-Menu. Refer to section 8.6 for instructions for applying the mouse zoom function directly to the data plot area. www.holzworth.com HA7402B Manual Rev 1.04 Page 22 of 44... - Page 25 Note that applying the Spur Removal function to the data does not result in saved raw data .CSV file that has the spurs removed. Refer to section 8.4 for more information on saving data. www.holzworth.com HA7402B Manual Rev 1.04 Page 23 of 44...
- Page 26 Using the same limit line example, test limit lines can be preconfigured using a program like MS Excel to create a .CSV file to define limit lines that can be saved and then quickly loaded as necessary for repeat use. www.holzworth.com HA7402B Manual Rev 1.04 Page 24 of 44...
- Page 27 "Smoothing" data trace. Markers set to "Peak" will be placed at the maximum amplitude located by the software over a limited range of data around the frequency offset. www.holzworth.com HA7402B Manual Rev 1.04 Page 25 of 44...
- Page 28 Markers can be removed either by changing the number of markers in the drop down menu under advanced display settings or simply by clicking and dragging off of the plot area. www.holzworth.com HA7402B Manual Rev 1.04 Page 26 of 44...
-
Page 29: Save / Recall Sub-Menu
NOTE: By default the save data is set to "Invert Colors," which will result in the plot being saved with a white background. Disable this option to save with a black background. www.holzworth.com HA7402B Manual Rev 1.04 Page 27 of 44... -
Page 30: Saving The Debug File
The Display Traces function allows a user to load up to 3 separate traces that have been previously saved in a .CSV format. These traces can be data that has been saved from the HA7402B or from an analyzer made by an alternate manufacturer. Furthermore, hand built .CSV files can also be loaded. -
Page 31: Settings Save / Recall
The saved settings file will be saved in an .XML format. If a single .XML settings file is saved in the same location as the HA7402B .JAR file, it will automatically load each time the GUI is activated. If more than one settings .XML file is saved in the same folder location as the .JAR file, no settings file will be auto-loaded. -
Page 32: Display Data Zoom
Zoom back to normal scale by double clicking the left mouse button with the mouse pointer located inside the plot area. www.holzworth.com HA7402B Manual Rev 1.04 Page 30 of 44... -
Page 33: Contact Information
Contact Holzworth directly for product support. A list of US Sales Representatives and non-US Distribution partners are listed on the Holzworth website. Holzworth Instrumentation Sales Support Phone: +1.303.325.3473 (option 1) Email: sales@holzworth.com Holzworth Instrumentation Technical Support Phone: +1.303.325.3473 (option 2) Email: support@holzworth.com www.HOLZWORTH.com www.holzworth.com HA7402B Manual Rev 1.04 Page 31 of 44... -
Page 34: External Lo Mode - Absolute Measurement Example
EXTERNAL LO MODE - ABSOLUTE MEASUREMENT EXAMPLE The example provided here is a phase noise test performed on a 100MHz OCXO, using an HA7402B that is equipped with OPT-PD1 (low noise front end). For demonstrational purposes, the external LOs used are 100MHz OCXOs exhibiting phase noise performance that is approximately 5 dB worse than that of the DUT. - Page 35 Once the DUT and LOs are setup and phase noise analyzer is connected to the GUI on the host PC, the steps towards making the measurement are as follows: www.holzworth.com HA7402B Manual Rev 1.04 Page 33 of 44...
- Page 36 LOs should be similar, the tune voltages and their slopes need not be the same. The analyzer will make the appropriate adjustments if the proper tune voltage range has been set. www.holzworth.com HA7402B Manual Rev 1.04 Page 34 of 44...
- Page 37 “Calibration complete” will appear in the lower left hand corner. At this point, the user can close the Calibration Table window and proceed to begin the measurement. www.holzworth.com HA7402B Manual Rev 1.04 Page 35 of 44...
- Page 38 Once Kd has been calculated, the value is loaded into the system and the Diagnostics window will then change over to verify a proper phase lock to the DUT. www.holzworth.com HA7402B Manual Rev 1.04 Page 36 of 44...
- Page 39 The status bar in the lower left hand of the main dashboard will reach 100% at the end of one full correlation for the band that is set closest to the carrier. The range of each band is shown in section 8.2.2. www.holzworth.com HA7402B Manual Rev 1.04 Page 37 of 44...
- Page 40 LO power levels are present. LO Calibration Sub-Menu Initiate the Calibration Table window under the Measurement sub-menu by clicking the Cal LOs button. Close the Calibration Table window by selecting the www.holzworth.com HA7402B Manual Rev 1.04 Page 38 of 44...
- Page 41 In this example, a 5dB spur threshold is applied to the data. The modified display shows the modified data overlapping the raw data as the blue colored trace. www.holzworth.com HA7402B Manual Rev 1.04 Page 39 of 44...
- Page 42 Furthermore, the raw data can be completely removed by selecting the Smoothing Only check box located to the right side of the set number of smoothing points. The resultant data display is a smoothed, spur free plot. www.holzworth.com HA7402B Manual Rev 1.04 Page 40 of 44...
- Page 43 USER NOTES www.holzworth.com HA7402B Manual Rev 1.04 Page 41 of 44...
- Page 44 USER NOTES www.holzworth.com HA7402B Manual Rev 1.04 Page 42 of 44...
- Page 45 USER NOTES www.holzworth.com HA7402B Manual Rev 1.04 Page 43 of 44...
- Page 46 All rights reserved. Holzworth Instrumentation Inc. 1722 14 Street, STE 220 Boulder, Colorado 80302 USA +1.303.325.3473 www.HOLZWORTH.com Rev 1.04 Version September 2013...
Need help?
Do you have a question about the HA7402B and is the answer not in the manual?
Questions and answers