Table of Contents
Advertisement
Quick Links
DIRECT READING FERROGRAPH
Model: ___________________________________
Serial Number: ____________________________
Date of Purchase: __________________________
Windows Product Serial Number: ________________________________________
DR-7
USER MANUAL
November 2022 Revision F
Trico Corporation
1235 Hickory Street
Pewaukee, WI 53072
Phone: 262.691.9336
www.tricocorp.com
Page 1 of 28
Advertisement
Table of Contents

Related Manuals for Trico DR-7


Summary of Contents for Trico DR-7
- Page 1 DR-7 DIRECT READING FERROGRAPH USER MANUAL November 2022 Revision F Trico Corporation 1235 Hickory Street Pewaukee, WI 53072 Phone: 262.691.9336 www.tricocorp.com Model: ___________________________________ Serial Number: ____________________________ Date of Purchase: __________________________ Windows Product Serial Number: ________________________________________ Page 1 of 28...
-
Page 2: Table Of Contents
7.3 – BASELINE Tab ..........................17 7.4 – CALIBRATION Tab ........................... 18 7.4.1 – OPTICAL Calibration ........................ 18 7.4.1.1 – Optical Calibration Check with Trico #DR7-FIL ..............20 7.4.2 – END OF OIL Sensor Adjustment ....................21 7.5 – HELP Tab ............................22 7.6 –... -
Page 3: Introduction
(DL) and small (DS) in a known oil sample. The numbers given do NOT relate to any other numbers such as parts per million (ppm). The DL and DS numbers of the DR-7 will correspond to those reading generated by a DR-5 and will be slightly higher than a DR-3. In turn these numbers can be used to calculate the wear particle count (WPC). -
Page 4: Packing List And Assembly
Instrument. Tighten the screws using a #2 Phillips head. 4. Plug the universal power cord into the back of the DR-7 into the power jack and then into an electrical outlet. -
Page 5: Specification And Operating Parameters
10ºC to 29ºC Humidity: 5% to 50% non-condensing CAUTION: DO NOT operate the DR-7 with the back panel removed. Unplug the DR-7 from the power supply before removing the back panel for adjustments. Check with Trico before removing as this could void the unit warranty. -
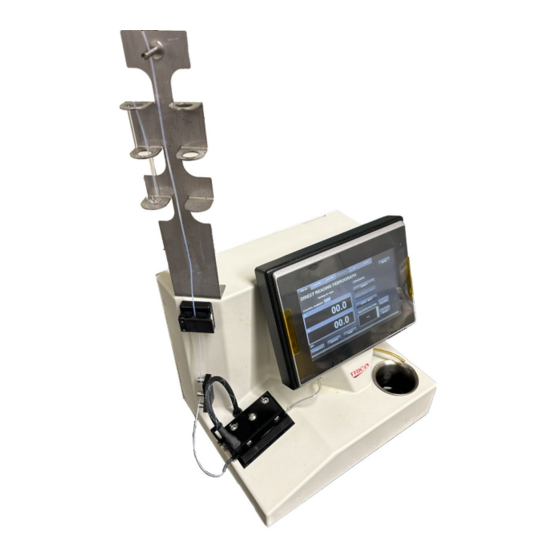
Page 6: Nomenclature
DR-7 Direct Reading Ferrograph Instrument shown above. 1) Vial Holder: Holds two sample vials and mounts on the top of the DR-7 with two screws. Do not use this as a handle to pick up the unit. - Page 7 Windows product support through Microsoft. The DR-7 Model, and Serial Number Label is located on the bottom or back of the unit and used when calling Trico for DR-7 support. Record these numbers on the DR-7 user manual for future reference.
-
Page 8: Consumables And Accessories
5. Consumables and Accessories It will become necessary to reorder the consumables to continue testing on the DR-7 unit. This section contains reordering information. Many of the test equipment items should not be reused. Contaminated devices can cause inaccurate or incorrect interpretation. -
Page 9: Oil Sample Preparation
6.2 – Dilutions Readings on the DR-7 greater than 90 in the 1:1 or 1:2 dilution modes are not linear due to the particles piling on top of one another. When the DR-7 readings reach 90, the test is invalid and should be repeated using a dilution of the base sample. -
Page 10: Operating Procedures
7. Operating Procedures Always use the DR-7 on a sturdy, level surface in a well-ventilated room. To start the DR-7 system, flip the rocker switch on the back of the unit to the “ON” position. The operating system will automatically start booting and the Trico logo will illuminate. -
Page 11: Standard Operation
The DR-7 displays the time (in seconds) that each sample takes to complete. The sample time is defined as the time required from when the DR-7 detects the oil at its DL and DS sensors, to the time the last of the oil passes the end of oil sensor. - Page 12 4. Place the end of the capillary tube in the oil sample in the vial holder until it touches the bottom of the sample vial and press the tubing into the spring at the top of the sample vial holder to hold the tubing in place.
- Page 13 a script can be written to load the data into a given lab data tracking software or spread sheet. iv. After ENTER has been selected the keypad will disappear and the RUN DR will again be displayed. 6. Press START and the unit will begin the test until it is completed. When pressed the pump activates and starts the siphoning effect in the precipitator tube.
-
Page 14: Opaque Operation
Diesel oil is a good example of an opaque sample. If an opaque sample is run as a regular sample on the DR-7, the top line of the display will read TOO DARK – USE OPAQUE. - Page 15 2. Enter the control number, if used, by pressing the ENTER CONTROL NUMBER button, as explained in the Standard Operation section. 3. Pump 4 ml of heptane into a clean sample vial to be placed in the vial holder on top of the DR-7 next to the prepared oil sample.
-
Page 16: Menu Button
7.1.3 – MENU Button The MENU button is in the upper right corner of the RUN DR tab. By pressing this button, the DR-7 settings menu appears in the Submenu Selection area. Different settings can be selected from the pull- down menu to control beep on key hit, if a control number is required per sample before testing, and the number of pump revolutions to start suction during a test. -
Page 17: Charting Tab
7.2 – CHARTING Tab The Charting Tab is the function that will plot the DL and DS. Pressing GENERATE GRAPHS button will graph the L and S Base levels and L and S Count levels over time. Pressing CLEAR GRAPHS then clears all the data from the graph. -
Page 18: Calibration Tab
DR versions, the optics block should never be removed for cleaning (see section 9 Maintaining the DR-7). The new design of the Optics block uses a special fluid filled calibration tube for both the alignment procedure during the factory build, and in calibrating the LED light source by the lab technician. - Page 19 2. Select the CALIBRATION tab. 3. Press the OPTICS button. 4. Press the CALIBRATE button in the submenu. The DR-7 will automatically calibrate the light intensity by determining the maximum intensity and then balancing the optical channels to a predetermined offset to produce the most effective results.
-
Page 20: Optical Calibration Check With Trico #Dr7-Fil
NOTE: Neutral density filters should be handled with care. Fingerprints, smears, or scratches will change the calibration readings. Density filters from older model DR's can still be used on the DR-7. However, note the changes in instrument reads in the table below. -
Page 21: End Of Oil Sensor Adjustment
This is done by testing oil suspected of containing large particles using the DR-7’s end of oil calibration feature in the CALIBRATION tab. This procedure is useful when conducting a large batch of samples with large particle properties. For single samples the alternate method is suggested to bypass the End of Oil sensor. -
Page 22: Help Tab
7.5 – HELP Tab The DR-7 has a HELP tab that contains a link to the last version of the manual that was loaded onto the machine when the unit shipped from the factory. This is not an internet link and will have to manually be updated if needed. -
Page 23: Downloading And Understanding Dr Data
If using a lab database software, a script will need to be written to pull these files into lab firmware. Connection to the DR-7 can be completed through the internet or by USB. - Page 24 Consequently, when the D and D numbers, under normal steady state wear, trend closer together, this indicates larger particles have precipitated out and most of the particle concentration present are small particles. In abnormal wear modes, except for corrosive wear, large particle concentrations will increase.
- Page 25 the cumulative concentration and the cumulative size distribution plotted on the same graph. A normally operating machine will produce two straight diverging lines, but a machine in distress will cause both plots to increase in slope. Figure 8.2 Example of D and D Cumulative plots Variation of plots:...
-
Page 26: And D Readings
Red Alert Level = WPC +3s 8.2 – D and D Readings Flow rates through the precipitator tube have some effect on particle deposition across the precipitator tube assembly. All precipitator tubes are pressure dropped during assembly within the limits needed to maintain a certain consistent flow rate. D and D readings are susceptible to changes as the flow rate decreases. -
Page 27: Maintaining The Dr-7
1. Close the DR-7 program and shutdown the Windows operating system. 2. Once the operating system is shut down, turn off the DR-7 and unplug the power cord. 3. Remove the sensor cable coming out the top of the optics holder assembly by loosening the set screw with a 0.05-inch Allen wrench. -
Page 28: Limited Warranty
Trico will repair (or at its option, replace) at no charge any defective component(s) of Trico’s instruments for twelve (12) months from date of purchase. Trico will repair (or at its option, replace) at no charge any defective component(s) of Trico’s supplies and accessories for ninety (90) days from date of purchase.
Need help?
Do you have a question about the DR-7 and is the answer not in the manual?
Questions and answers