Table of Contents
Advertisement
Quick Links
Advertisement
Table of Contents

Summary of Contents for 3DATX parSYNC
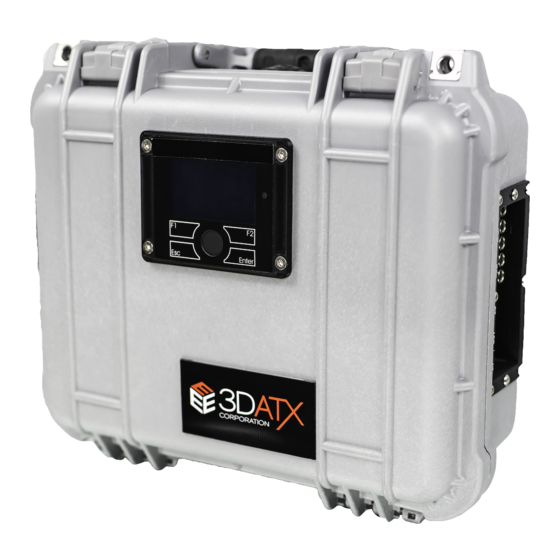
- Page 1 User Guide 3DATX Corp. parSYNC®miniPEMS Updated July 2020...
-
Page 2: Table Of Contents
Temperature ..........................18 3.10 PSN .............................. 19 3.11 RAW ............................19 Span Calibration Procedure ........................ 20 Test Checklist - parSYNC® and CUBE™ ....................22 Day before test ..........................22 Test Day ............................22 5.2.1 Zero Sensors ........................22 5.2.2 If Calibration is needed, proceed below, (IF NOT, skip this section) ........22 Data Collection/System Setup .................... - Page 3 7.1.3 Legend ..........................27 7.1.4 Control Palette ........................28 7.1.5 Scroll Bar ..........................28 Test Data File Format ........................29 Hardware Overview and Technical Specifications ..............31 7.3.1 Overview ..........................31 7.3.2 Next Generation: iPEMS ...................... 31 7.3.3 Modular Sensor Cartridge Advantage: Particulates and Gases .......... 31 7.3.4 C.U.B.E.
-
Page 4: Unpacking Your Parsync
*TIP - Before we get started, remember to carefully open the boxes and save them in case you need to send the equipment back or use them to ship to a testing location. Box 1: Open the big box. This box contains your parSYNC® device along with all of its accessories. •... - Page 5 Remove the second layer of foam protection. • • The final layer holds your parSYNC® with a few other accessories. o On this layer, you may find the parSYNC® power adapter/charger, extra tubing, and/or extra feet that can be attached to the bottom of the unit.
- Page 6 Remove the first layer of foam protectant and you will find your CUBE™ below. • Now let’s get charging! Be sure the parSYNC®, CUBE™, and tablet all have a full charge before starting your first test. o When you power up your tablet, *IF* a PIN or password has been set, they are: PIN = 2020 ...
-
Page 7: Items Needed In The Field (Not Included)
CO (Carbon Monoxide) – 8% (Carbon Dioxide) – 12% (Hydrocarbon) – 3100 ppm Routine measurement should be made of the parSYNC ® sampling flowrate (with the standard lengths of hoses when the system was purchased) and any significant decrease in... -
Page 8: Software
Main power button on the unit and verify that the blue LED surrounding the power button is lit and that the sampling pump is running (audible noise). On the laptop controller, click the shortcut link on the Taskbar or Desktop that points to the parSYNC® application executable file. The executable file in the “Software” is typically named parSYNC_**.exe where the ** is a placeholder for software version number and date. - Page 9 8. PSN (Particulate Synchronization Number) 9. Raw (Raw Voltage Signals from All Sensors) The tabs will be described as they come up when you set-up parSYNC®, operate your equipment, and analyze your data afterwards. TIP: For any button or control in the User Interface (UI), right-click and click “Description and Tip…” for notes on usage and/or functionality.
-
Page 10: Config And Connect
3.3 Config and Connect 3.3.1 Overview If a suitable default config file is found the message window will instruct the user to proceed with establishing a connection between the software and the hardware. Note that when a config file is loaded, many of the GUI controls will be populated by the values stored in the config file. -
Page 11: Config Save Button
Thus, each test data file has a timestamp in its file name and no two files should have the same file name. The test data file is stored in the basefolder\TestData location. Currently, parSYNC® records data at 1 hz. The actual data recording does not start until you zero the system or hit the “Start” button. -
Page 12: Calibration Settings
). The software automatically fills in the measured zero voltages from all parSYNC® sensors when the system is zeroed prior to a test run (using the controls in the Zero tab). The span voltages for the test calibration gases are obtained by using the equipment to test the calibration gases and referencing the span voltage values displayed in the “RAW”... -
Page 13: Admin
The Admin sub-tab under the Config tab is not meant for the user and is only for use by the developers of the parSYNC® system. This tab is useful when someone from 3DATX needs to troubleshoot a data acquisition issue for a remote user. - Page 14 Please note – sudden significant change in values or when opacity zero value drops below 5 VDC are indicative of cartridge reaching end of service life. Zero air data recording (when warming up the parSYNC) should be reviewed regularly.
-
Page 15: How To Start Recording
Please note – appearance of spurious noise on the data values is also indicative of cartridges reaching end of service life. 3.5 How to Start Recording To start recording, click the “Start” button in the left panel. This will start sampling of gases and PM and the values are displayed in real-time on the charts in the tabs to the right side of the Zero tab. -
Page 16: Gases Tab
The Gases tab displays real-time 1 hz data for NO (ppm), NO (ppm), CO (%), and CO (%). The CO channel is a new addition, and if your model of parSYNC® does not have the CO sensor then the CO chart will remain blank. 3.7 PM Conc and PN The PM Conc tab displays the PM values in micrograms/cu.meter (µg/m... -
Page 17: Pm (Sig)
3.8 PM (Sig) The PM (Sig) tab shows the absolute (or modulus) voltage signal from the particulate sensors after correction for the sensor voltage during zeroing. Typically, the user would not need to pay attention to this tab, but it does provide a window into the response of the scattering, ionization and opacity sensor channels. -
Page 18: Temperature
Temperature tab. Note that this is not the temperature of any specific gas flow path, but rather the temperature of the inside of the PM cartridge inside of the parSYNC®. The temperature trends are useful in diagnosing the thermal stability of the system and use in recalibration of individual sensors that... -
Page 19: Psn
The PSN metric was initially developed to apply pass/fail criteria to issues with diesel particulate filter (DPF) technology, where a hairline crack in the DPF would not be noticed by a typical opacity sensor but would be readily seen by the parSYNC® due to its three particulate measurement technologies. -
Page 20: Span Calibration Procedure
4 Span Calibration Procedure 1. After following calibration gas bottle and equipment setup to proper working temperature, complete the zeroing process and start sampling the calibration gas using the parSYNC® miniPEMS (minimum of approximately 10 seconds of steady state span gas measurement). -
Page 22: Test Checklist - Parsync® And Cube
• Turn on the parSYNC® internal heater power (POWER button is on the temperature controller of parSYNC®); This is the “Driver” temperature, should initially be set to 10 degrees C above ambient temperature of testing facility Target for internal sensor temperature is 32 degC – 38 degC, dependent on ambient temperature. -
Page 23: Data Collection/System Setup
5.3 Data Collection/System Setup • Install parSYNC®, CUBE™, and condensate trap in the vehicle; route sample and exhaust lines. Avoid significant low spots in sample line between window and the condensate trap that could collect condensation (Be sure to check condensate trap during test stop for water accumulation) Move vehicle to dynamometer or outside test start location •... -
Page 24: Post Processing
Remove condensate from traps and store at room temperature after sealing unit for next use. Turn off parSYNC® & CUBE™ with on/off buttons: Turn off heater on grey temperature panel, turn • off pump and sensor electronic using silver ON/OFF button •... -
Page 25: Appendix
7 Appendix 7.1 Software - Chart Design Elements This section covers the common design elements in parSYNC® user-interface charts. Legend Chart Area Y-Axis Control Palette X-Axis Scroll Bar 7.1.1 Y-axis and X-axis Place your mouse on either the Y-axis (vertical axis) or the X-Axis (horizontal axis) and right-click to see options to change marker space and turn autoscale ON/OFF. - Page 26 TIP: You can change the minimum and maximum on the Y-axis and X-axis by directly typing the new values. For example, if you want to NO (ppm) Y-axis to be 0-200 ppm, simply place the cursor where it says 100, and change that to 200. Or, if you want the X-axis to display 1000 records, change the 300 to 1000.
-
Page 27: Chart Area
7.1.2 Chart Area Right-click anywhere inside the charts (but away from the axis) to see the menu options for copying the data, clearing the chart, or exporting it to the clipboard, as an Excel file, or a bitmap image. You can use any of these features during a test while measurement is active or when it is paused. -
Page 28: Control Palette
7.1.4 Control Palette The control palette allows you to: select and move the cursor on the chart (only if the chart has a cursor), zoom in/out of the data displayed on the chart, and pan the chart display. The zoom functions are particularly useful. -
Page 29: Test Data File Format
7.2 Test Data File Format The parSYNC® software creates a comma-separated values (CSV) file at the time a connection is established between the software and the hardware. The software appends a row of data for each second of measurement while it is in “Start” or “Zero” modes of operation. The data is added to the file real-time, so if the test is interrupted or the connection is broken, the data up to that point is already saved to the file. - Page 30 Column Description Name Opacity Voltage output from the opacity sensor without any correction, volts (Vraw) (Vraw) Voltage output from the NO sensor without any correction, volts NO (Vraw) Voltage output from the NO sensor without any correction, volts (Vraw) Voltage output from the CO sensor without any correction, volts CO (Vraw) Voltage output from the CO sensor without any correction, volts...
-
Page 31: Hardware Overview And Technical Specifications
A significant advantage of the 3DATX iPEMS design is the Modular Sensor Cartridge design. - Page 32 Note that although their particulate size sensitivities overlap, their optimal particle size and concentration responsiveness is different between sensors. Thus, particle mass concentration and number can be extrapolated based on the evaluation of sensor modality and empirical references. Multi-plex post-processing maps matched up with engine failure response modes may also enable prediction for engine trouble diagnostic/failed DPF applications.
-
Page 33: (Condensate Unit For Batch Emissions) Chiller/Water Trap (Sample Conditioner)
7.4 Technical Memorandum The parSYNC® directly samples 2.5Liters/min from the engine exhaust, there is no dilution and thereby no extrapolation of sensor values to full concentration. Thus, the small lightweight device can be comparably responsive and accurate to a large PEMS device. -
Page 34: Opacity
The standard wavelength of typical opacity sensors is in the green range, and parSYNC® follows suit by using gel filters. Opacity is measured by the change in the current within the circuit that the opacity meter resides. -
Page 35: Scattering
However, opacity sensors are known to be less accurate when there is a lot of light scattering within the sample and when the particles are very small. To counter these issues, parSYNC® has included a scattering sensor (sensitive to larger particles and when large amounts of scattering occur) plus an ionization sensor (sensitive to ultra-fine particles). -
Page 36: Ionization
(Note: Because of the dependencies on both angle and wavelength, varied incident angles and wavelengths can provide even more of a complete picture of the distribution.) To complete the picture for the particle size distribution, parSYNC® also incorporates an ionization sensor. 7.4.3 Ionization Ionization sensors are far more sensitive to ultra-fine particulates than opacity and scattering sensors. - Page 37 Opacity sensor has a peak in the 0.8 micron diameter range (800nm) and Scattering sensor peaks in the 3.5 micron diameter range. The parSYNC® can perceive changes in the distribution of the size of the particles by using this physical property. These results have been quantified in the literature and in measured laboratory test.
Need help?
Do you have a question about the parSYNC and is the answer not in the manual?
Questions and answers