Table of Contents
Advertisement
Quick Links
Advertisement
Table of Contents

Related Manuals for Teledyne Lecroy T3DSO3000


Summary of Contents for Teledyne Lecroy T3DSO3000
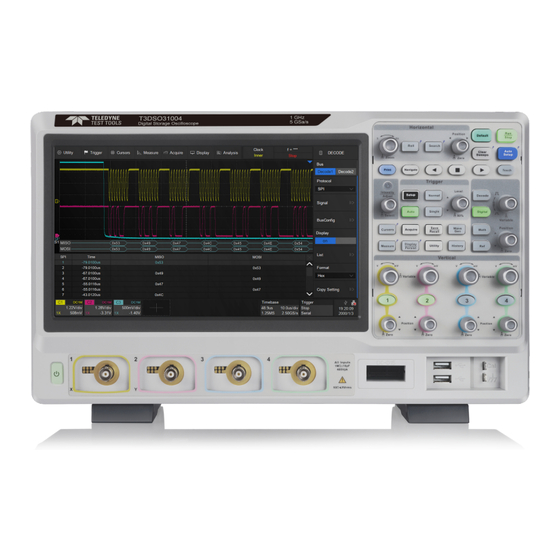
- Page 1 T3DSO3000 Digital Storage Oscilloscope User Manual...
- Page 2 Resale or unauthorized duplication of Teledyne LeCroy publications is strictly prohibited. Teledyne Test Tools is a trademark of Teledyne LeCroy, Inc., Inc. Other product or brand names are trademarks or requested trademarks of their respective holders. Information in this publication supersedes all earlier versions.
-
Page 3: Table Of Contents
Contents 1 Introduction ......................1 2 General Safety Summary ..................2 2.1 Safety Terms and Symbols ..................3 2.2 Working Environment ..................4 2.3 Cooling Requirements ..................6 2.4 AC Power ......................6 2.5 Power and Ground Connections .................7 2.6 Calibration ......................8 2.7 Cleaning ......................8 2.8 Abnormal Conditions ...................8 3 First Steps ......................... - Page 4 7.4 Channel Descriptor Box ..................20 7.5 Timebase and Trigger Descriptor Boxes .............21 7.6 Dialog Box ......................25 7.7 Touch Gestures ....................27 7.8 Mouse and Keyboard Operation .................28 7.9 Choosing the Language ..................28 8 Front Panel ........................ 29 8.1 Overview ......................29 8.2 Vertical Control ....................30 8.3 Horizontal Control ....................30 8.4 Trigger Control .....................31 8.5 Run/Stop Button ....................32...
- Page 5 14.2 Trigger Setup ......................69 14.3 Trigger Level .......................71 14.4 Trigger Mode ......................71 14.5 Trigger Type ......................72 14.5.1 Overview ....................72 14.5.2 Edge Trigger ....................74 14.5.3 Slope Trigger ....................74 14.5.4 Pulse Trigger ....................77 14.5.5 Video Trigger ....................78 14.5.6 Window Trigger ..................
- Page 6 15.7.1 FlexRay Signal Settings ................125 15.7.2 FlexRay Trigger ..................126 15.7.3 FlexRay Serial Decode ................127 15.8 CAN FD Trigger and Serial Decode ..............129 15.8.1 CAN FD Signal Settings ................129 15.8.2 CAN FD Trigger ..................129 15.8.3 CAN FD Serial Decode ................131 15.9 I2S Trigger and Serial Decode ................
- Page 7 18.3.1 Differential ....................179 18.3.2 Integral ....................181 18.3.3 Square Root .................... 182 18.4 Frequency Analysis ..................183 18.5 Formula Editor ....................194 19 Reference ......................195 20 Search ........................196 21 Navigate ........................ 199 22 Mask Test ......................206 22.1 Overview ......................
- Page 8 31.11 Default ......................298 31.12 Power on Line ....................298 31.13 Debug ......................298 32 Remote Control ..................... 299 32.1 Web Browser ....................299 32.2 Other Connectivity ................... 300 33 Troubleshooting ....................301 34 Contact Teledyne LeCroy ..................304 35 Certifications ......................305...
-
Page 9: Introduction
1. Introduction Teledyne Test Tools T3DSO3000 series Digital Storage Oscilloscopes are available in bandwidths of 1 GHz, 500 MHz and 350 MHz. All models include a maximum sample rate of 5 GSa/s, maximum record length of 250 Mpts, and display up to 4 analog channels + 16 digital channels mixed signal analysis capability. -
Page 10: General Safety Summary
Before connecting to the instrument, read the manual to understand the input/output ratings. Do not operate with suspected failures. If you suspect that the instrument is damaged, contact the Teledyne LeCroy service department immediately. Do not operate in wet/damp conditions. Keep the surface of the instrument clean and dry. -
Page 11: Safety Terms And Symbols
This chapter contains information and warnings that must be followed to keep the instrument operating under the appropriate safety conditions. In addition to the safety precautions specified in this section, you must also follow recognized safety procedures. 2.1 Safety Terms and Symbols When the following symbols or terms appear on the front or rear panel of the instrument or in this manual, they indicate special care in terms of safety. -
Page 12: Working Environment
dangerous if not followed. Do not proceed until its conditions are fully understood and met. WARNING The “WARNING” symbol indicates a potential hazard. It calls attention to a procedure, practice or condition which, if not followed, could possibly cause bodily injury or death. If a WARNING is indicated, do not proceed until the safety conditions are fully understood and met. - Page 13 Note: Installation (Overvoltage) Category II refers to the local distribution level, which is applicable to equipment connected to the mains supply (AC power source). Installation (Overvoltage) Category I refers to signal level, which is applicable to equipment measuring terminals that are connected to source circuits in which measures are taken to limit transient voltages to an appropriately low level.
-
Page 14: Cooling Requirements
2.3 Cooling Requirements This instrument relies on the forced air cooling with internal fans and ventilation openings. Care must be taken to avoid restricting the airflow around the apertures (fan holes) at each side of the scope. To ensure adequate ventilation it is required to leave a 15 cm (6 inch) minimum gap around the sides of the instrument. -
Page 15: Power And Ground Connections
2.5 Power and ground connections The instrument includes a grounded power cord with a molded three terminal polarized plug and a standard IEC320 (Type C13) connector for making the line voltage and safety ground connection. The AC inlet ground terminal is connected directly to the frame of the instrument. -
Page 16: Calibration
2.6 Calibration The recommended calibration interval is one year. Calibration should be only performed by qualified personnel. 2.7 Cleaning Only clean the exterior of the instrument using a damp, soft cloth. Do not use chemicals or abrasive elements. Under no circumstances allow moisture to penetrate the instrument. -
Page 17: First Steps
3.2 Quality Assurance The oscilloscope has a 3-year warranty (1-year warranty for probe attachments) from the date of shipment, during normal use and operation. Teledyne LeCroy can repair or replace any product that is returned to the authorized service center during the warranty period. -
Page 18: Maintenance Agreement
The oscilloscope's firmware has been thoroughly tested and is presumed to be functional. Nevertheless, it is supplied without warranty of any kind covering detailed performance. Products not made by Teledyne LeCroy are covered solely by the warranty of the original equipment manufacturer. -
Page 19: Shut Down
4.2 Shut down Press the power button to turn off the oscilloscope. Or follow the steps below: Utility > Shutdown Note: The Power button does not disconnect the oscilloscope from the AC power supply. The only way to fully power down the instrument is to unplug the AC power cord from the outlet. -
Page 20: Probe
5 Probe The T3DSO3000 series oscilloscope package includes passive probes as standard accessories. Please visit www.teledynelecroy.com for technical data and information on the full range of probes available. Probe Compensation When a probe is used for the first time, you should compensate it to match the input channel of the oscilloscope. -
Page 21: Quick Start
6 Quick Start 6.1 Front Panel Overview Touch Screen Display The display and menu functions area. See “Touch Screen Display” chapter for more details. Front Panel Includes knobs and buttons. See “Front Panel” chapter for more details. Probe Compensation and Ground Terminal Supplies a 1 kHz square wave for compensating the probes. -
Page 22: Rear Panel Overview
6.2 Rear Panel View Auxiliary Output Outputs the trigger pulse. When Pass / Fail is enabled, it will output the pass / fail signal. External Trigger Input 10MHz Clock Input / Output Receives or outputs 10 MHz reference clock for synchronization between the oscilloscope and other instruments. -
Page 23: Connecting To External Devices/Systems
6.3 Connecting to External Devices/Systems 6.3.1 Power Supply The standard power supply for the instrument is 100 - 240 V, 50/60 Hz or 100 - 120 V, 400 Hz. Please use the power cord provided with the instrument to connect it to AC power. 6.3.2 LAN Connect the LAN port to the network with a network cable with RJ45 head for remote control. -
Page 24: Auxiliary Output
Press the WaveGen button on the front panel or touch the screen Utility>AWG Menu to set the waveform. 6.3.7 Probes The T3DSO3000 series oscilloscope supports active probe and passive probes. The specifications and documents for the full range of probes can be found on our website www.teledynelecroy.com. -
Page 25: Touch Screen Display
7 Touch Screen Display 7.1 Overview The entire T3DSO3000 display is a capacitive touch screen. Use your fingers to touch, drag, pinch, spread, or draw a selection box. Many controls that display information also work as “buttons” to access other functions. If you are using a mouse, you can click anywhere that you can touch to activate a control;... -
Page 26: Menu Bar
trigger position of the waveform. Cursors show where measurement points have been set. Move the cursors to quickly reposition the measurement point. Channel Descriptor boxes include analog channels (C1 - C4), digital channels (D), math (M) and reference (Ref). They are located under the grid area, showing the parameters of the corresponding traces. -
Page 27: Grid Area
Analysis > Histogram Analysis > Bode Plot Analysis > Power Analysis Analysis > Counter 7.3 Grid Area The grid area displays the waveform traces. Traces can be moved by dragging, and re-scaled by pinch and zoom. The area is divided into 8 (vertical) * 10 (horizontal) grids. -
Page 28: Channel Descriptor Box
D. Vertical Scale E. Vertical Offset F. Probe Attenuation Factor Bandwidth Limit Indicators: The T3DSO3000 has two available bandwidth limits: 20 and 200 MHz. They are indicated by the following icons: :20 MHz bandwidth limit :200 MHz bandwidth limit None: Full bandwidth... - Page 29 : AC coupling, 50Ω impedance : Ground Vertical Scale: The scale of each grid in the vertical direction. For example, when the vertical scale is 1.00V/div, the full scale of the oscilloscope is 1.00V/ div*8div=8V. Vertical Offset: The offset of the channel in the vertical direction. When the vertical offset is 0, the channel offset indicator is located in the middle of the vertical axis.
-
Page 30: Timebase And Trigger Descriptor Boxes
7.5 Timebase and Trigger Descriptor Boxes A. Trigger delay B. Horizontal scale (timebase) C. # Samples D. Sample Rate Trigger delay: The time offset of trigger position. When trigger delay is 0, the trigger delay indicator is in the center of the horizontal axis of the grid area. Horizontal scale: Timebase, the time of each grid in the horizontal direction. - Page 31 Trigger source • C1 - C4:Analog channels • EXT: External trigger channel • EXT/5:5x attenuation of external trigger channel • AC Line: AC mains supply • D0 - D15: Digital channels Trigger coupling: Coupling mode of the current trigger source. It is only valid when the trigger source is C1 - C4, EXT or EXT/5.
- Page 32 Trigger mode • Auto: The oscilloscope will sweep without a set trigger. An internal timer triggers the sweep after a preset timeout period so that the display refreshes continuously. This is helpful when first analyzing unknown signals, however Auto mode functions in the same way as Normal mode when a trigger condition is found.
-
Page 33: Dialog Box
To Set Parameters The T3DSO3000 provides several different ways to input/select parameters: Switch: Sets parameters with two states, such as to enable or disable a function. Touch the switch region to change from one state to the other. - Page 34 List: Sets parameters with more than two options, such as coupling mode of channels. Touch the parameter region, and then select the expected option from the pop-up list. Virtual Keypad: Sets parameters with numerical value. Touch the parameter region, and the parameter can be adjusted by the universal knob on the front panel;...
-
Page 35: Touch Gestures
Hide Dialog Box When the dialog box is opened, the grid area will be compressed horizontally to display the complete waveform. After setting the parameters, in order to achieve the best waveform display effect, you can touch the title bar in the upper right corner to hide the dialog box. -
Page 36: Mouse And Keyboard Operation
7.8 Mouse and Keyboard Operation The T3DSO3000 user interface features mouse control as well as the touch screen. If the oscilloscope is connected to a USB mouse, you can click on an object with the mouse instead of touching the object. Similarly, if a USB keyboard is connected, you can use the keyboard to input characters instead of using the virtual keyboard. -
Page 37: Front Panel
8 Front Panel 8.1 Overview The front panel is designed to operate the basic functions without having to open the software menu. Most of the front panel controls duplicate functionality available through the touch screen display, but it is quicker to use the front panel controls. -
Page 38: Vertical Control
8.2 Vertical Control A. When a channel is disabled, push the channel button to turn it on. When the channel is turned on and activated, push the button to disable it. B. Rotate the knob to adjust the DC offset or vertical position of the channel. Push to set the offset to zero C. -
Page 39: Trigger Control
A. Rotate to adjust horizontal scale (time/div); push to enable Zoom; push again to exit Zoom mode. B. Rotate to adjust trigger delay; push to set trigger delay to zero. C. Push to enable horizontal Roll; push again to exit Roll mode. At timebase settings larger than 50ms/div, it is recommended to set the oscilloscope to Roll mode so that the waveform is displayed in real time. -
Page 40: Run/Stop Button
8.5 Run/Stop Button Press the button to switch the acquisition state between Run and Stop. When the state is Run, and the button is illuminated in yellow; when the state is Stop, the button is illuminated in red. 8.6 Auto Setup Button The oscilloscope will automatically set the vertical scale, horizontal scale and trigger level according to the input signal to get optimum waveform display. -
Page 41: Decode/Digital/Math/Ref Control
8.7 Decode/Digital/Math/Ref Control A. Press the button to turn on serial bus decode function and open the DECODE dialog box. Press again to turn off the decode function. B. Press the button to turn on the digital channel and open the DIGITAL dialog box. -
Page 42: Navigate Control
F. Rotate the knob to adjust the vertical offset of Math or Ref, press down the knob to quickly reset the vertical offset to zero. It can also be used to adjust the position of selected digital channel on the screen. 8.8 Navigate Control A. -
Page 43: Universal Knob
8.10 Universal Knob When the parameter setting area is highlighted, you can use the Universal Knob to set the parameter. Press the knob to select an option from the list. The default function of the Universal Knob is to adjust intensity of the waveform traces. -
Page 44: Multiple Approaches To Recall Functions
Enables/Disables measurements and recalls the MEASURE dialog box. Press the button to recall the DISPLAY dialog box. The second press turns on Persist, and the button will light up. Press the button again to turn off Persist. Recalls the UTILITY dialog box. Enables/Disables a measurement and recalls the HISTORY dialog box. -
Page 45: Descriptor Box
Trigger > Menu The operations can be completed either by touch or by mouse clicks. 9.2 Descriptor Box For setup of channels, math, ref, timebase and trigger, there are dialog boxes at the bottom of the display. For more information on the descriptor box, see the sections "Channel Descriptor Box"... -
Page 46: Quickly Capture The Signal
10 Quickly Capture the Signal In this example we will explain how to acquire a signal quickly. Firstly, we will assume the signal is connected to channel 1 and that channel 1 is turned off. Press the channel 1 button to turn the channel on. The LED on the button will light up, and the descriptor box of channel 1 will be displayed at the bottom left of the screen. -
Page 47: Channel Setup
From the Touch Screen Touch the + button and then select the expected channel to turn it on, and its channel descriptor box and dialog box will appear on the display. Touch the channel descriptor box and then touch the Off button to disable it. Turn on C1 Turn off C1 11.2 Channel Setup... - Page 48 Touch the region to set the vertical scale with universal knob or virtual keypad ▲ to increase the vertical scale and ▼ to decrease Check to coarsely adjust the vertical scale and uncheck to enable fine adjustment Touch the region to set the offset with universal knob or virtual keypad ▲...
- Page 49 A. Turn channel on/off B. Coupling (DC, AC or GND) C. Bandwidth limit (Full, 200 MHz or 20 MHz) D. Probe attenuation (1X, 10X, 100X or custom) E. Set the label text. Click to recall the label setting. Users can customize the text and display of the label F.
- Page 50 (SNR) can be obtained by turning on a bandwidth limit. The T3DSO3000 provides two bandwidth limit options: 20 MHz and 200 MHz. Probe Attenuation The T3DSO3000 provides 1X, 10X, 100X and custom probe attenuation factor options.
- Page 51 “Display” option is set to “on”, the label will be displayed on the right side of the channel offset indicator. The labels are hidden The labels are displayed Applied to With this setting, some common functions such as Cursor, Measure, FFT, Search, DVM, Histogram and Mask Test can be quickly applied to the selected channel.
- Page 52 Deskew Due to the skew between channels, cables or probes, the delay of signals passing through different measurement paths may be inconsistent. For example, two coaxial cables with a 1 inch difference in length could introduce a skew of more than 100 ps.
-
Page 53: Digital Channels
Before invert After invert 12 Digital Channels 12.1 Overview The logic probe is designed to monitor up to 16 digital signals simultaneously. The 16 digital channels are separated into two groups and each group has its own threshold, making it possible to simultaneously view data from different logic families. - Page 54 The equipment shall be used only for the purposes specified by the manufacturer. The logic probe is used only for Teledyne LeCroy’s T3DSO series oscilloscopes. Protection mechanisms can be compromised if the way the devices connected by the logic probe are not used for their intended purpose.
-
Page 55: Enable/Disable The Digital Channels
12.2 Enable/Disable the Digital Channels Turning on or off the digital channels is very similar to analog channels. Digital data can be stored as waveform files. Horizontal cursors and most of horizontal measurements also apply to digital waveforms. A. Digital channel waveform display, which shares the same grid area with the analog channels. -
Page 56: Digital Channel Setup
From the Front Panel Press the Digital button on the front panel to turn on digital channels and display the waveforms. Press again to turn off. From the Touch Screen Click + at the bottom of the display and select the “Digital” to turn on; click the digital channel descriptor box, and clicking Off on the pop-up menu to turn off. - Page 57 Height=8div, Position=0div Height=4div, Position=1div The quick menu only covers the height range and position of the digital channels display area. More setting can be found in the dialog box. A. Turn on/off the digital channels B. Labels, can be set to data, address or custom characters.
- Page 58 Logic Threshold Setting The threshold level determines how the input signal is evaluated. The threshold level can be set in the Logic Setting . The input voltage less than the threshold is recognized as a '0', and the input voltage greater than the threshold is recognized as a ‘1’.
-
Page 59: Horizontal And Acquisition Setup
13 Horizontal and Acquisition Setup 13.1 Timebase Setup The timebase setup is used to adjust the scale and offset of the X (horizontal) axis. This setting applies to all analog, digital channels and all math traces except FFT. Touch the timebase descriptor box, the quick menu of the timebase settings will pop up. -
Page 60: Acquisition Setup
With 250 Mpts memory depth, T3DSO3000 can still run at full sample rate (5 GSa/s) even when set to the 5 ms/div timebase. - Page 61 Note: The memory depth here is the upper limit of the memory space allocated by the oscilloscope. The actual sample points is related to the current timebase and may be less than memory depth. The actual sample points information can be obtained in the timebase descriptor box (see the section “Timebase and Trigger”...
-
Page 62: Acquisition
Gibbs phenomenon. X Interpolation Sinc Interpolation Acq mode: "Fast" is the default setting. The T3DSO3000 provides a very high waveform update rate in fast mode. "Slow" mode will slow down the waveform update rate intentionally. 13.2.2 Acquisition The acquisition mode is used to determine how to acquire and process the signal. - Page 63 If a stable trigger is available, the resulting average has a random noise component lower than that of a single-shot record. The more frames that are accumulated, the lower the noise is. For the T3DSO3000, 55 User Manual...
- Page 64 (SNR) is improved. As a result, the effective number of bits (ENOB) of the oscilloscope is enhanced. For the T3DSO3000, ERES processing is implemented by the hardware engine, so it can still maintain a high waveform update rate when the acquisition mode is set to average.
-
Page 65: Roll Mode
Normal mode ERES mode (3-bit) ERES acquisition does not require the signal to be periodic, nor does it require stable triggering, but due to the digital filtering, the system bandwidth of the oscilloscope will degrade in ERES mode. The higher the enhanced bits, the lower the bandwidth. -
Page 66: Sequence
If sequence mode is enabled, the display will not update until all of the sequences have been acquired. The T3DSO3000 can achieve a minimum 2 us trigger interval in Sequence mode, corresponding to a waveform update rate of 500,000 wfm/s. - Page 67 After the acquisition is finished, the oscilloscope will map all the segments together to the screen. If you need to view and analyze each frame separately, history mode will help (see the section “History” for details). History mode provides timestamp labels for each segment. In addition to minimizing the dead time, another advantage of Sequence mode is that it can capture and record rare events over long time periods.
- Page 68 Set the coupling mode of C1 to DC50Ω, and vertical scale to 500 mV/div, vertical offset to 0. Set the trigger level to 0. In normal mode, 5 pulses can be obtained on the screen with the sample rate of 1.25 GSa/s at the maximum memory depth.
- Page 69 In Sequence mode, there is no waveform displayed on the screen until the acquisition is completed. During acquisition, there is a counter on the screen indicating the number of segments that have been acquired. In the example, 53969 pulses can be obtained with the sample rate of 5 GSa/s at the maximum memory depth.
-
Page 70: History
13.3 History Press the History button on the front panel or touch Analysis > History to recall the history dialog box. A. Turn on or off history mode B. Specify the frame index C. Set the playing mode D. Play backward, pause and play forward E. - Page 71 Continuing with the example in the section above. In Sequence mode, all waveforms that satisfy the trigger conditions are mapped to the display. If you need to observe a single frame, you can use history mode. To enable history mode, touch the Frame No. area twice, then the virtual numeric keypad pops up.
- Page 72 Acq Time label Delta T label In addition to manually specifying a frame, history mode supports auto play: Press the softkey to replay the waveform from the current frame to the first. Press the softkey to stop replaying. Press the softkey to replay the waveform from the current frame to the last.
-
Page 73: Zoom
13.4 Zoom The T3DSO3000 supports waveform zoom in the horizontal direction. Press down the horizontal knob on the front panel to turn on the zoom function. When the Zoom function is on, the waveform area is divided into upper and lower parts. - Page 74 scale knob and horizontal position knob are used to change the timebase and trigger delay of main window. The horizontal position of the zoom area, the horizontal position of the waveform, the horizontal scale of Zoom window and the horizontal scale of main window can also be controlled by different gestures, as follows: Adjust the horizontal position of the zoom area by dragging left and right in the zoom area of the main window or waveform in Zoom window...
- Page 75 Adjust the horizontal scale of main window by pinch and spread in the gray area of the main window 67 User Manual...
-
Page 76: Trigger
14 Trigger 14.1 Overview The oscilloscope only acquires waveforms of interest (i.e. the ones that satisfy the trigger condition) and aligns all trigger events at the trigger position to form a stable waveform display. The trigger is one of the most important features of any oscilloscope, since we can only analyze a signal that we are able to trigger in a reliable and stable manner. -
Page 77: Trigger Setup
Trigger settings should be based on the features of the input signal. For example, a sine wave with repeatable period can be triggered on the rising edge; for capturing hazards in a combinational logic circuit, the pulse trigger can be set. - Page 78 A. Select trigger type B. Select the trigger source C. Select the trigger slope (When the trigger type is “Edge”, “Slope” and other specific types) D. Set holdoff (None/Time/Events) E. Set trigger coupling mode (DC/AC/LF Reject/HF Reject) F. Enable/disable Noise Rejection. When Noise Reject is on, the trigger hysteresis is increased, so the noise immunity of the trigger circuit is better.
-
Page 79: Trigger Level
14.3 Trigger Level Both analog and digital triggers must have a correct trigger level value. The oscilloscope judges whether a waveform satisfies the trigger condition when it crosses the trigger level. If it does, the crossing time is the trigger position. In the following figure, the trigger condition is set as rising edge. -
Page 80: Trigger Type
� Rare events 14.5 Trigger Type 14.5.1Overview The trigger modes of the T3DSO3000 are digital designs. Compared with analog trigger circuits, digital triggers can not only greatly optimize trigger precision, trigger jitter, but also support multiple trigger types and complex trigger conditions. - Page 81 Edge - Trigger on rising edge, falling edge or both Slope - Trigger when an edge crosses two thresholds which lie inside or outside a selected time range Pulse - Trigger at the end of a pulse when the pulse width lies inside or outside a selected time range Video - TV trigger on falling edge Window - Trigger when the signal leaves the widow region.
-
Page 82: Edge Trigger
14.5.2 Edge Trigger Edge trigger distinguishes the trigger points by seeking the specified edge (rising, falling, rising & falling) and trigger level. Trigger source and slope can be set in the trigger dialog box. Touch the Source area to select trigger source, and touch the Slope area to select rising, falling or alter. - Page 83 positive edge as shown in the figure below: Touch the Source area to select trigger source, and touch the Slope area to select rising or falling. Rising - Only trigger on the positive slope Falling - Only trigger on the negative slope Adjust Upper/Lower Level The slope trigger requires upper and lower trigger levels.
- Page 84 Use the Level knob on the front panel directly to set the level value. Press the knob to switch between upper and lower level, and rotate it to set the value. The lower level should always be less than or equal to the upper level. In the trigger descriptor box, the lower level is displayed.
-
Page 85: Pulse Trigger
14.5.4 Pulse Trigger Trigger on a positive or negative pulse with a specified width. Trigger source, polarity (positive, negative), limit range and time value can be set in the trigger dialog box. Less than a time value(≤)- Trigger when the positive or negative pulse time of the input signal is lower than the specified time value. -
Page 86: Video Trigger
The trigger circuitry detects the vertical and horizontal interval of the waveform and produces trigger based on the video trigger settings you have selected. The T3DSO3000 supports standard video signal for NTSC (National Television Standards Committee), PAL (Phase Alternating Line), HDTV (High Definition Television) and a custom video signal trigger. - Page 87 Touch the Standard and select the video standard. The T3DSO3000 supports the following video standards: TV Standard Scan Type Sync Pulse NTSC Interlaced Bi-level Interlaced Bi-level HDTV 720P/50 Progressive Tri-level HDTV 720P/60 Progressive Tri-level HDTV 1080P/50 Progressive Tri-level HDTV 1080P/60...
- Page 88 (line value)/2 (2:1) 1, 2, 3, 4, 5, 6, 7, 8 (line value)/4(4:1) 1, 2, 3, 4, 5, 6, 7, 8 1, 2, 3, 4, 5, 6, 7, 8 (line value)/8(8:1) Line value: The number of lines set in the Of Lines (300 - 2000). In the custom video trigger type, the corresponding “Of Fields”...
- Page 89 For interlaced scanning signals (such as NTSC, PAL, 1080i/50, 1080i/60, Custom), when the synchronization mode is “Select”, the specified line and the specified field can be selected to trigger. The following table shows the corresponding relations between line and field for all video standards (except for Custom) Standard Field 1...
- Page 90 1. Press the Setup button on the front panel to open the trigger menu. 2. In the trigger menu, touch Type , select “Video”. 3 . Touch the Source and select CH1 as the trigger source. 4. Touch the Standard and select the “NTSC”. 5.
-
Page 91: Window Trigger
In the trigger menu, touch the Type, select the “Video” Touch the Source and select CH1 as the trigger source. Touch the Standard and select the “Custom” option. Touch the Custom Setting to open the custom setting menu, touch the Interlace to select the required interlace ratio (assuming that the interlace ratio is 8:1). - Page 92 • If the lower and the upper trigger levels are both within the waveform amplitude range, the oscilloscope will trigger on both rising and falling edges. • If the upper trigger level is within the waveform amplitude range while the lower trigger level is out of the waveform amplitude range, the oscilloscope will trigger on the rising edge only.
- Page 93 To set window trigger via the Absolute window type When the window trigger type is set to “Relative”, touch the trigger descriptor box. The pop-up menu will show two user defined parameters: “Level +/- Delta” and “Level Center”. The above two parameters can be set in the following ways: Select the parameter in the Level +/- Delta area of the quick menu, then set the parameter value by the virtual keypad, or the level knob on the front panel.
-
Page 94: Interval Trigger
14.5.7 Interval Trigger Trigger when the time difference between the neighboring rising or falling edges meets the time limit condition. When the trigger condition is set as an interval between two neighboring rising edges and it is less than the set time value, the trigger diagram is as follows: Trigger source, slope (rising, falling), limit range and time value can be set in the trigger dialog box. -
Page 95: Runt Trigger
State Trigger when the time interval ( T) from when the rising edge (or falling edge) of the input signal passes through the trigger level to when the neighboring falling edge (or rising edge) passes through the trigger level is greater than the set time, as shown in the figure below: Trigger source, slope (rising, falling), dropout type and time value can be set in the trigger dialog box. -
Page 96: Pattern Trigger
14.5.10 Pattern Trigger The Pattern trigger identifies a trigger condition by looking for a specified pattern. The T3DSO3000 provides 4 patterns: logical AND, OR, NAND and NOR combination of the channels. Each channel can be set to “Low”, “High” or “Don't Care”. - Page 97 Logic (AND, OR, NAND, NOR), source, limit range and time value can be set in the trigger dialog box. When the logic is "OR" or "NAND", the setting of time limit is invalid. Source Setting Touch the Source Setting area to recall the following dialog box and set up for each channel separately.
-
Page 98: Qualified Trigger
Limit Range When the logic is “AND” or “NOR”, the time limit condition is available. This setting is particularly useful to filter the hazard signals of combinational logic. When the logic is “OR” or “NAND”, the time limit setting is not supported. Holdoff can be set in pattern trigger, see the sections “Holdoff”... - Page 99 When the type is “Edge”, the oscilloscope triggers at the first edge after the specified edge (Rising or Falling) of the qualified source; when the type is “Edge with Delay”, time limit condition is available. Qualified Source Edge Trigger Source Trigger Qualified Edge = Rising Edge = Rising...
-
Page 100: Trigger Source
14.6 Trigger Source The trigger sources supported by each trigger type are different. See the table below for details: Trigger Type C1-C4 EXT, EXT/5 AC Line D0-D15 Edge √ √ √ √ Slope √ × × × Pulse √ × ×... - Page 101 Holdoff by Time Holdoff time is the amount of time that the oscilloscope waits before re-arming the trigger circuitry. The oscilloscope will not trigger until the holdoff time expires. Use the holdoff to trigger on repetitive waveforms that have multiple edges (or other events) between waveform repetitions.
-
Page 102: Trigger Coupling
Parameter Start Holdoff On defines the initial position of holdoff. Acq Start - The initial position of holdoff is the first time point satisfying the trigger condition. In the example above, each holdoff starts from the first rising edge of the pulse sequence. Last Trig Time -The initial position of holdoff is the time of the last trigger. -
Page 103: Noise Reject
• LFR: The signal is coupled through a capacitive high-pass filter network, DC is rejected and low frequencies are attenuated. For stable triggering on medium to high frequency signals. See the datasheet for details of the cutoff frequency. 14.9 Noise Reject Noise Reject adds additional hysteresis to the trigger circuitry. -
Page 104: Zone Trigger
Noise Reject = On 14.10 Zone Trigger The T3DSO3000 includes a zone trigger to help isolate elusive glitches. There are two user-defined areas: Zone1 and Zone2. Users can set the property of each zone as “intersect” or “not intersect” as an additional condition to further isolate the interested event quickly. - Page 105 Touch Trigger > Zone to recall zone dialog box: A. Turn on or off zone trigger B. Select the source: C1-C4 C. Turn on or off zone1 D. Set the property of zone1: Intersect or Not intersect E. Set the coordinate of zone1. The range is within the waveform area F.
- Page 106 When the finger moves out of the screen, a menu pops up allowing you to select the zone and set the zone properties: User Manual 98...
- Page 107 Once a zone is created, it can be moved by dragging. Just touch and hold the zone box and use a dragging gesture. Select C1 as source, turn on zone1, and Select C1 as source, turn on zone1, and set the property as “Intersect” set the property as “Not Intersect”...
- Page 108 With a simple edge trigger, it is unlikely to trigger consistently on this anomaly. Thanks to the high waveform update rate of the T3DSO3000, we can confirm that bus contention is happening by enabling the persistence display, as shown in the...
- Page 109 contention part, as shown in the figure below: Now, we can accurately capture the exact bus contention waveform: User Manual...
-
Page 110: Serial Trigger And Decode
15 Serial Trigger and Decode 15.1 Overview The T3DSO3000 supports serial bus trigger and decode on the following serial bus protocols: I2C, SPI, UART, CAN, and LIN. Press the Setup button on the front panel or touch the trigger descriptor box,... - Page 111 A. Set the list of decode result B. Select the bus to set, Bus1 and Bus2 C. Turn on/off the bus D. Set the bus display E. Select the serial bus protocol F. Touch to set the signal, including the mapping relation between channels and bus signals, and the thresholds.
-
Page 112: I2C Trigger And Serial Decode
15.2 I2C Trigger and Serial Decode This section covers triggering and decoding of I2C signals. Please read the following sections for more details: “I2C Signal Settings”, “I2C Trigger” and “I2C Serial Decode”. 15.2.1 I2C Signal Settings Connect the serial data signal (SDA) and serial clock signal (SCL) to the oscilloscope, set the mapping relation between channels and signals and then set the threshold level of each signal. -
Page 113: I2C Trigger
Set the source of SDA. In the example above, SDA is connected to C1. Set the threshold level of the SDA channel. Return to previous menu. Threshold level line. It only appears when adjusting the threshold level. Copy Setting Touch the Copy Setting in the decode dialog box to synchronize the settings between trigger and decode. - Page 114 Touch Trigger Setting in the I2C trigger dialog box to select the trigger condition: Start - The oscilloscope will be triggered when the SDA line transitions from high to low while the SCL is high. Stop - The oscilloscope will be triggered when the SDA line transitions from low to high while the SCL is high.
- Page 115 EEPROM - The trigger searches for the EEPROM control byte value 1010xxx on the SDA bus, and if there is a Read bit and an ACK bit behind the EEPROM. Set the data value and compare the type according to Data1 and Limit Range . If the EEPROM’s data is greater than (less than, equal to) Data1 , the oscilloscope will be triggered at the edge of ACK bit behind Data byte.
- Page 116 Frame (Start: 7-bit address: R/W: Ack: Data: Ack: Data2) - If all bits match, then trigger on the Ack bit followed by the Data2. 10 bit Address & Data - If all bits match, then trigger on the Ack bit followed by the Data.
-
Page 117: I2C Serial Decode
If you set the trigger condition to 7 address & data or 10 address & data: � Address can be selected in the hexadecimal range of 0x00 to 0x7F (7-bit) or 0x3FF (10-bit). If the address is selected as "0xXX (7-bit address)" or "0xXXX (10-bit address)", the address is ignored. - Page 118 Waveform display area, shows the original waveforms of the bus signals Bus display, shows the decode result of the bus. Two buses can be decoded at the same time. Touch Bus Operation of the dialog box to turn on or off selected bus, and touch Bus Display to select the display type of decode result (Binary, Decimal, Hex or ASCII) and set the bus location on the display List display area.
- Page 119 • after a data or address byte represents ACK (acknowledgement), and indicates no acknowledgement. • The data value is displayed in white. � A red point at the end of a segment indicates there is not enough space on the display to show the complete content of a frame, and some content is hidden, such as List •...
-
Page 120: Spi Trigger And Serial Decode
Configuration There is only one item Include R/W Bit in the configuration of the I2C decode. When it is disabled, the address is represented separately from the R/W bit, and when it is enabled, the R/W bit is represented together with the address. For example, the address 0x4E: Write: Ack, is displayed as “0x4E (W)”... - Page 121 In addition to specifying the source and the threshold level, for the CLK signal it is also necessary to specify the Edge Select . � Rising - Data latched on rising edge of the clock. � Falling - Data latched on falling edge of the clock. The user can select the edge according to the actual phase relationship between the clock and data of the SPI bus.
- Page 122 � -CS - Active low. The -CS signal needs a complete falling edge in the screen to be regarded as active. � Clock Timeout - It is not necessary to specify the source and threshold level for the CS signal. The only parameter for the CS signal is the timeout Limit, which is the minimum time that the clock signal must be held idle for before the oscilloscope acquires valid data.
- Page 123 When the CS type is set to Clock Timeout, turn on a Cursor, measure the clock idle time between frames as 150 us, and measure the interval between the clock pulses as 0.14 us, then set the timeout to a value between 0.14 and 150 us.
-
Page 124: Spi Trigger
If the data width is set to be greater than 8 bits (such as 16 bits), measure the clock idle time between 8-bit data packets as 0.57 us, and then set the timeout time to a value between 0.57 and 150 us. In this example, it is set to 1 us: 15.3.2 SPI Trigger The trigger condition for SPI trigger is mainly about data. -
Page 125: Spi Serial Decode
15.3.3 SPI Serial Decode The configuration of SPI decoding is similar to I2C. In the Bus Config menu, Data Length (4-32 bit) and Bit Order (LSB or MSB) are configurable. 15.4 UART Trigger and Serial Decode This section covers triggering and decoding UART signals. Please read the following for more details: “UART Signal Settings”, “UART Trigger”... -
Page 126: Uart Trigger
A. Touch to select the baud rate: 600,1200, 2400, 4800, 9600, 19200, 38400, 57600, 115200 b/s or Custom B. Data Length: 5 - 8 bit C. Parity Check: None, Odd, Even, Mark or Space. If the data is 9 bits, the 9 bit is treated as Mark parity or Space parity D. -
Page 127: Uart Serial Decode
A. Source Type: RX or TX B. Trigger Condition: Start, Stop, Data or Error C. When the "trigger condition" is Data, set the compare type to: =, >, < D. When the “trigger condition” is Data, set the data value E. -
Page 128: Can Trigger And Serial Decode
15.5 CAN Trigger and Serial Decode This section covers triggering and decoding CAN signals. Please read the following for more details: “CAN Signal Settings”, “CAN Trigger” and “CAN Serial Decode”. 15.5.1 CAN Signal Settings Connect the CAN_H and CAN_L signals to the oscilloscope, set the mapping relation between channels and signals, and then set the threshold level of each signal. -
Page 129: Can Serial Decode
• Start - The oscilloscope triggers at the beginning of the frame. • Remote - The oscilloscope triggers on a remote frame with a specified ID. ID, ID Bits (11-bit or 29-bit) and Curr ID Byte (1st, 2nd, 3rd, or 4th byte) can be set. - Page 130 • The red point at the end of a segment indicates there is not enough space on the display to show complete content of a frame and some content is hidden. In the list view: • Time - The horizontal offset of the current data frame head relative to the trigger position.
-
Page 131: Lin Trigger And Serial Decode
15.6 LIN Trigger and Serial Decode This section covers triggering and decoding LIN signals. Please read the following for more details: “LIN Signal Settings”, “LIN Trigger” and “LIN Serial Decode”. 15.6.1 LIN Signal Settings Connect the LIN signal to the oscilloscope, and then set the threshold level of the signal. -
Page 132: Lin Serial Decode
• Break - The oscilloscope triggers at the beginning of the frame. • - The oscilloscope triggers on the frame that matches the specified ID, which ranges from 0x00 to 0x3f. • ID & Data - The oscilloscope triggers on the frame that matches the specified ID and data.ID, Data1 and Data2 can be set. -
Page 133: Flexray Trigger And Serial Decode
In the list view: • Time - The horizontal offset of the current data frame head relative to the trigger position. • - ID of the frame. • Data length - Data length. • ID Parity - ID parity check. •... -
Page 134: Flexray Trigger
In BusConfig menu of trigger and decode, the baud rate can be set to: 2.5 Mb/s, 5.0 Mb/s, 10.0 Mb/s or Custom. The method of copying settings is the same as I2C signal settings. See “I2C Signal Settings” for details. 15.7.2 FlexRay Trigger Touch Trigger Setting in the FlexRay trigger dialog box to... -
Page 135: Flexray Serial Decode
• Symbol - The oscilloscope triggers on CAS/MTS (Conflict Avoidance Symbol/ Media access Test Symbol) or WUS (Wake-up Symbol) • Errors - The oscilloscope will trigger when a data error happens, including errors on FSS, BSS, FES, Header CRC, and Frame CRC. 15.7.3 FlexRay Serial Decode The configuration of FlexRay decoding is similar to that of I2C decoding. - Page 136 In the list view: � Time— The horizontal offset of the current data frame head relative to the trigger position. � FID— Frame ID, symbol occupy a single line of the list. � PL— Valid Data Length � HCRC— Head Check Code �...
-
Page 137: Can Fd Trigger And Serial Decode
15.8 CAN FD Trigger and Serial Decode This section covers triggering and decoding CAN FD signals. Please read the following for more details: “CAN FD Signal Settings”, “CAN FD Trigger” and “CAN FD Serial Decode”. 15.8.1 CAN FD Signal Settings Connect the CAN FD signal to the oscilloscope, and then set the threshold level of the signal. - Page 138 A. Frame Type: Both, CAN, CAN FD B. When the "Frame Type" is CAN FD, turn on or off ISO C. When the "Frame Type" is CAN FD, set the BRS (Bit Rate Switch) to Both, Normal or FD D. Trigger Condition: Start, Remote, ID, ID + Data, Error E.
-
Page 139: Can Fd Serial Decode
✓ Stuff Bit Error ✓ CRC Mismatch Error: The oscilloscope triggers when the calculated CRC does not match the transmitted CRC. ✓ Stuff Bit Cnt Err: Effective only when ISO is turned on, the oscilloscope triggers when the stuff bit count is incorrect. ✓... - Page 140 • The red point at the end of a segment indicates there is not enough space on the display to show complete content of a frame and some content is hidden. In the list view: • Time - The horizontal offset of the current data frame head relative to the trigger position.
-
Page 141: I2S Trigger And Serial Decode
15.9 I2S Trigger and Serial Decode This section covers triggering and decoding I2S signals. Please read the following for more details: “I2S Signal Settings”, “I2S Trigger” and “I2S Serial Decode”. 15.9.1 I2S Signal Settings Connect the WS, BCLK, and Data signals to the oscilloscope, set the mapping relation between channels and signals, and then set the threshold level of each signal. -
Page 142: I2S Trigger
15.9.2 I2S Trigger Touch Trigger Setting in the I2S trigger dialog box to set the trigger conditions: A. Audio Variant: Audio-I2S, Audio-LJ, Audio-RJ B. Trigger Condition: Data, Mute, Clip, Glitch, Rising Edge, Falling Edge C. Channel: Set the channel to trigger, Left or Right D. - Page 143 • Mute - Trigger on the mute signal. Mute signal: Volume is less than the set value and duration reaches the set value. ✓ Touch MNF to set the mute threshold by the universal knob or virtual keypad. The range of value is related to the number of Data Bits .
-
Page 144: I2S Serial Decode
� - Trigger on signals less than the Threshold setting value. Falling Edge ✓ Touch Threshold to set the threshold by the universal knob or virtual keypad. The range of value is related to the number of Data Bits . 15.9.3 I2S Serial Decode The configuration of I2S decoding is similar to that of I2C decoding. -
Page 145: Mil-Std-1553B Signal Settings
15.10.1 MIL-STD-1553B Signal Settings Connect the MIL-STD-1553B signal to the oscilloscope, set the mapping relation between channels and signals, and then set the threshold level of each signal. The process of specifying the source and threshold is similar to “I2C Signal Settings”. -
Page 146: Sent Trigger And Serial Decode
In the decoding list view: • Time - The horizontal offset of the current data frame head relative to the trigger position. • RTA - The RT address • Type - Type of the word • Data - Data values •... -
Page 147: Sent Trigger
In the BusConfig menu of trigger or decode, the following parameters are available: A. Touch to specify the nominal clock period (tick) time B. Set the percent tolerance to determine whether the sync pulse is valid for decoding the data C. - Page 148 Start - the oscilloscope will be triggered on the start of the message (after 56 synchronization ticks). You can select the type of the message: Fast Channel Message, Slow Channel Message or any. Fast Channel - the oscilloscope will be triggered on a Fast Channel Message when the Status &...
- Page 149 The serial message frame contains 21 bits of payload data. Two different configurations can be chosen determined by the configuration bit (serial data bit #3, serial communication nibble No. 8): Frame (enhanced serial message with 4bits ID) - 16-bit data and 4-bit message ID, the configuration bit is 1.
- Page 150 If you set the trigger condition to Slow Channel: • ID can be selected in the hexadecimal range of 0x0 to 0xF (short serial / enhanced serial with 4 bits ID)or 0x00 to 0xFF(enhanced serial with 8 bits ID. If it is selected as “0xXX”, the ID is ignored. •...
-
Page 151: Sent Serial Decode
15.11.3 SENT Serial Decode The configuration of SENT decoding is similar to that of I2C decoding. On the bus: For Fast Channel: • SYNC is displayed in pink • STATE is displayed in green • DATA is displayed in white •... - Page 152 In the list view: • Time - The horizontal offset of the current data frame head relative to the trigger position. • Sync - Sync pulse width (only fast channel) • State - Status & Communication nibble (only fast channel) •...
-
Page 153: Manchester Serial Decode
15.12 Manchester Serial Decode This section covers decoding Manchester signals. Please read the following for more details: “Manchester Signal Settings” and “Manchester Serial Decode”. 15.12.1 Manchester Signal Settings Connect the Manchester signal to the oscilloscope, set the mapping relation between channels and signals, and then set the threshold level of signal. The process of specifying the source and threshold is similar to “I2C Signal Settings”... - Page 154 A. Touch to specify the baud rate, the range is 500b/s to 5Mb/s B. Set the Manchester signal logic type. R:1 indicates that rising edge is used to encode a bit value of logic 1, and F:1 indicates that falling edge is used to encode a bit value of logic 1 C.
-
Page 155: Manchester Serial Decode
15.12.2 Manchester Serial Decode The configuration of Manchester decoding is similar to that of I2C decoding. On the bus: • SYNC is displayed in pink • Header is displayed in green • DATA is displayed in white • Trailer is displayed in blue In the list view: •... -
Page 156: Cursors
16 Cursors 16.1 Overview Cursors are important tools when measuring signals. Rapid measurements can be performed using cursors in both horizontal and vertical directions. The cursor types includes X1, X2, X1-X2, Y1, Y2 and Y1-Y2, used to indicate X-axis values (time or frequency) and Y-axis values (amplitude) on a selected waveform (CH1/ CH2/CH3/CH4/MATH/REFA/REFB/REFC/REFD/Histogram). - Page 157 A. Turn on or off cursors function B. Cursors Mode. The vertical cursors will automatically track the waveform in Trace mode. C. Specify the cursor and set the position (by gestures, universal knob, or virtual keypad) D. Select the source E.
- Page 158 Manual Mode Track Mode Cursors Type X (horizontal) -- Vertical dotted lines that measure horizontal time (when the source is an FFT waveform, X cursors measure frequency). User Manual 150...
- Page 159 X cursors (time) X cursors (frequency) � — The left (default) vertical dotted line. It can be manually moved to any horizontal position on the screen. • — The right (default) vertical dotted line. It can be manually moved to any horizontal position on the screen.
- Page 160 • - The upper (default) horizontal dotted line. It can be manually moved to any vertical position on the screen. • - The lower (default) horizontal dotted line. It can be manually moved to any vertical position on the screen. •...
- Page 161 Display Mode Display Mode M1 Display Mode M2 • - The position information of each cursor is attached to the cursor, and the difference information is between the two cursors with arrows connected to the cursors. This mode is more intuitive. •...
- Page 162 • Fixed Position – When the vertical scale is changed, the Y cursors remain fixed to the grid position on the display. Take X cursors reference as an example to demonstrate the scaling effect of different settings: Timebase = 50ns/div,X1 = -50ns = -1div,X2 = 100ns = +2div User Manual 154...
-
Page 163: Select And Move Cursors
Fixed position, timebase is changed to 100ns/div, the grid number of X cursors (-1div, +2div) remains fixed. The value of X1 and X2 are changed to -100ns, 200ns. Fixed delay, timebase is changed to 100ns/div, the value of X cursors (-50ns, 100ns) remains fixed. - Page 164 Touch the display area of △X (or △Y) in M1 mode and drag it to move the two cursors simultaneously, as shown in the figure below. This is equivalent to the operation on the cursor type X1-X2 or Y1-Y2. User Manual 156...
- Page 165 Universal Knob Move the cursor position by turning the universal knob on the front panel. Press the knob to select different cursor lines. For example, if the current cursor is X1, press to select X2, and press again to select X1-X2. Gestures move the cursor quickly but not precisely, while the knob moves the cursor precisely but not as quickly.
-
Page 166: Measurement
The T3DSO3000 features a strong automatic measurement list. These parameters can be automatically measured without cursors and include a number of common measurements such as rise time, fall time, peak-peak, and period. The T3DSO3000 can also measure multiple channels at the same time, showing up to 5 parameter measurements with statistics while in the M1 display mode and up to 12 parameters in the M2 mode. - Page 167 A. Waveform display area, automatically compresses when the other windows are displayed B. Measurement parameters and statistics display area. If select the mode as “Simple”, the “Simple” parameter area is displayed C. Statistics histogram display area D. Measure dialog box Press the Measure button on the front panel or touch Measure>Menu to open the dialog box.
- Page 168 A. Enable/disable measure B. Set the mode of measure: Simple or Advanced. “Simple” shows the specified basic measurement parameters of the selected channel. In “Advanced” mode, the measurement parameters can be added one-by-one as needed C. Select measurement parameters D. Clear all the selected measurements E.
-
Page 169: Set Parameters
17.2 Set Parameters Touch Type in the measure dialog box, or touch + in the measurement parameters and statistics display area to open the parameter selection window: Set the source of the current setting. Measurement parameter classification tabs, including Favorite, Vertical, Horizontal, Miscellaneous and CH Delay. Touch a tab and the main area will display the corresponding parameters. - Page 170 Source>C1>Vertical>Pk-Pk Source>C2>Horizontal>Period For the channel delay (CH Delay) measurement, because the number of sources involved is greater than 1, the steps to specify the source is different: In the parameter selection area, the channel corresponding to Source A is specified first, and then the channel corresponding to Source B . Finally, the measurement parameter is selected.
-
Page 171: Type Of Measurement
The “Favorite” tab is used to store frequently used items. You can customize this tab. Up to 20 items can be stored in it. Long press an item to add or remove it from the “Favorite” tab. For example, to add Pk-Pk to the “Favorite” tab: Advanced>Type >Vertical>Pk-Pk>Add to favorite To remove Period from the “Favorite”... - Page 172 • Max: Highest value in the input waveform • Min: Lowest value in the input waveform • Pk-Pk: Difference between maximum and minimum data values • Top: Value of most probable higher state in a bimodal waveform • Base: Value of most probable lower state in a bimodal waveform •...
- Page 173 • Cycle Stdev: Standard deviation of the data in the first cycle • RMS: Root mean square of the data • Cycle RMS: Root mean square of the data in the first cycle • Median: Value at which 50% of the measurements are above and 50% are below •...
-
Page 174: Horizontal Measurement
� L@T: Level measured at trigger position 17.3.2 Horizontal Measurements Horizontal measurements menu includes 17 parameters: User Manual 166... - Page 175 • Period: Time between the middle threshold points of two consecutive like-polarity edges. • Freq: Reciprocal of period • Time@max: Time of maximum value • Time@min: Time of minimum value • +Width: Time difference between the 50% threshold of a rising edge to the 50% threshold of the next falling edge of the pulse •...
-
Page 176: Miscellaneous Measurements
• T@M: Time from the trigger to each rising edge at the 50% crossing • 10-90%Rise: Duration of rising edge from 10-90% • 90-10%Fall: Duration of falling edge from 90-10% • 20-80%Rise: Duration of rising edge from 20-80% • 80-20%Fall: Duration of falling edge from 80-20% •... -
Page 177: Delay Measurement
� Rising Edges: Number of rising edges in a waveform � Falling Edges: Number of falling edges in a waveform � Edges: Number of edges in a waveform � Ppulses: Number of positive pulses in a waveform � Npulses: Number of negative pulses in a waveform 17.3.4 Delay Measurement Delay measurement measures the time difference between two channels. - Page 178 • FRLR: The time between the first rising edge of source A and the last rising edge of source B at the 50% crossing • FRLF: The time between the first rising edge of source A and the last falling edge of source B at the 50% crossing •...
-
Page 179: Trend
17.4 Trend After adding a measurement parameter, Trend can be used to observe the change of the selected measurement value over time. A. Measurement parameter display area B. Trend plot display area C. Extend the range of time. Touch it to expand the time range. D. -
Page 180: Display Mode
Press Clear Sweeps button or touch Reset Statistics in the measure dialog box, or touch the symbol in the statistics display area to clear and restart statistics. 17.5 Display Mode In advanced measurement mode, two display modes are supported: M1 and M2. In M1 mode, up to 5 parameter measurements are displayed at a time. -
Page 181: Measurement Statistics
17.6 Measurement Statistics Enable the Statistics function to observe distribution of the measured values of every selected parameter. � Value – The current measurement � Mean – Average of all historical measurements � – The minimum of all historical measurements �... -
Page 182: Statistics Histogram
17.7 Statistics Histogram After enabling statistics on a selected measurement, you can also activate statistical histogram. The histogram appears at the bottom of the statistics area. This enables users to quickly view the probability distribution of the measured parameters. The color of the histogram is consistent with the measurement source (Channel 1 is yellow, etc.). -
Page 183: Simple Measurements
Count of statistics Current value The bin that includes the maximum value and the probability of a value falling into it Close the enlarged histogram 17.8 Simple Measurements Enabling Simple Measurement displays all selected measurement parameters of the specified channel at the same time. The font color of the measurement parameters is consistent with the color of the specified source. - Page 184 Touch Gate in the measure dialog box, then two horizontal cursors A and B will appear in the grid area. The gate setting dialog box will be displayed on the right. Gate cursors A and B are used to define the range of time for parameter measurements.
-
Page 185: Math
18 Math 18.1 Overview The T3DSO3000 supports 2 math traces and multiple operators: Addition (+), subtraction (-), multiplication (x), division (/), differential (d/dt), integral (∫dt), square root (√) and FFT, as well as a formula editor. The math traces are labeled with an “F1”... -
Page 186: Arithmetic
∧ ∧ √ 0.5 or A 18.2 Arithmetic The T3DSO3000 can perform arithmetic operations including addition, subtraction, multiplication or division on any two analog input channels. The values of Source A and Source B are computed point-by-point. User Manual 178... -
Page 187: Algebra
The following figure shows an example of F1 = C1 + C2: 18.3 Algebra The T3DSO3000 can perform algebra operations including differential (d/dt), integral (∫dt) and square root (√) 18.3.1 Differential The differential (d/dt) operator is used to calculate the derivative of the selected source. - Page 188 The range of “dx” in the d/dt menu is 2-20. The measurement units are points and the corresponding time difference range is 0.02-0.20 div. “div” indicates the number of the pixel points that each division has, the T3DSO3000 has 100. If dx = 10 points, the time difference is: 0.01*10 = 0.1 div...
-
Page 189: Integral
18.3.2 Integral Integral operation integrates the waveforms on the screen or within the specified gate. Setting Offset in the integral menu provides an approach to correct the DC offset of the source. Small DC offsets in the input signal (or even small offset errors of the oscilloscope itself) may cause the integral output waveform to “Ramp”... -
Page 190: Square Root
18.3.3 Square Root Square root (√ )calculates the square root of selected source. If the waveform value is negative (the waveform is below the ground level), the result is displayed as zero. User Manual 182... -
Page 191: Frequency Analysis
18.4 Frequency Analysis The result of FFT (Fast Fourier Transform) calculations is the frequency spectrum of the source signal. The horizontal axis of the FFT display is labeled using frequency (Hz) units instead of time (seconds). In addition, the vertical axis provides the option of logarithmic scaling (dBVrms/dBArms or dBm). - Page 192 In this example, FFT sample rate = 5 GSa/s ÷ 2 = 2.5 GSa/s. • FFT points (Curr): The current FFT points, which is an integer power of 2. The T3DSO3000 supports up to 2 M points (2097152, to be exact). • Frequency interval (△f): The frequency interval between two adjacent points in the FFT sequence, which is proportional to the frequency resolution.
- Page 193 Select Operation as FFT in the math dialog box and touch Config to recall the configuration dialog box: A. Set the maximum points (2 , n = 11 - 21) B. Set the window type (Rectangle, Blackman, Hanning, Hamming and Flattop) C.
- Page 194 Windows Spectral leakage in FFTs can be considerably decreased when a window is used. T3DSO3000 provides five windows which have different characteristics and are applicable to different scenarios. For example, for a two-tone signal with a very close frequency interval, it is suitable to use a Rectangle window with the best frequency resolution.
- Page 195 Maximum Main lobe Side lobe Window Characteristics amplitude width suppression error Poor frequency 12π/N -58 dB 1.1 dB resolution Blackman Better amplitude resolution Poor frequency 23π/N -93 dB < 0.1dB resolution Flattop The best amplitude resolution Display Mode • Split: Time domain waveform and frequency domain waveform are displayed separately.
- Page 196 Split Mode, Zoom off Split Mode, Zoom on Full Screen Mode Exclusive Mode FFT Mode • Normal: Displays the FFT result of each frame directly. • Max-Hold: Holds the maximum value in the historic frame on the display until cleared. This mode is suitable for detecting discontinuous waves, such as sporadic pulse signals, or frequency hopping signals.
- Page 197 Touch Vertical or Horizontal in the math dialog box to recall the FFT vertical or horizontal settings dialog box: A. Set the vertical scale and reference level B. Set the unit (dBVrms, Vrms and dBm). When the unit is dBm, the oscilloscope will automatically calculate the dBm value based on the Ext Load value set in area...
- Page 198 FFT Tools The T3DSO3000 provides two tools for FFT waveform: Peaks and Markers. The peaks tool can automatically search the qualified peak points and mark them on the FFT waveform. Up to 10 peaks is supported. Based on the peak tool, the markers tool can automatically search the qualified harmonics, and users can control the position of each marker.
- Page 199 When the FFT tool is selected as peaks, the dialog box is as follows: A. Turn on or off the table. Turn on the table, the peaks searched with the limit of Search Threshold and Search Excursion will be displayed in table B.
- Page 200 When FFT tool is selected as markers, the dialog box is as follows: A. Control markers. Touch to control the display and position of each marker B. Marker on peaks. It will automatically mark the peak that meets the conditions of Search Threshold and Search Excursion C.
- Page 201 The following shows the peaks of the FFT waveform: Measure the FFT waveform Press the Cursors button on the front panel to turn on the cursor function, and then specify the source as “Math”. X1 and X2 cursors can be used to measure the frequency value at the cursor position.
-
Page 202: Formula Editor
18.5 Formula Editor Touch Formula Editor in the operation setting page to recall the editor: A. Formula display text box B. Text box operation area, which can clear and modify the entered formula C. Special operators D. Operation source E. Keyboard area, which contains the basic arithmetic operators addition (+), subtraction (-), multiplication (*), division (/) F. -
Page 203: Reference
19 Reference Data from analog channels or math can be saved to the reference locations (REFA/REFB/REFC/REFD) in the built-in nonvolatile memory. The saved reference waveform can be recalled to be compared with current waveform. A. Channel waveform B. Reference waveform C. -
Page 204: Search
21 Search The T3DSO3000 can search for the specified events in a frame. Location of the events are displayed with white triangle indicators. In YT mode or Roll mode with the acquisition stopped, up to 1000 events is supported. In Roll mode with acquisition in run, the number of search events is unlimited. - Page 205 A. Search event indicator, marking the time point of an event B. Total number of events marked on the display C. Search dialog box, hidden in this example In the stop state, the area shows the index of current event /total number of events.
- Page 206 Analysis > Search to recall the search dialog box and turn on it. Setup Menu Select and set the search type in the Setup Menu . The T3DSO3000 provides five search conditions: Edge, Slope, Pulse, Interval and Runt. Search Type...
-
Page 207: Navigate
22 Navigate Press the Navigate button on the front panel or touch the menu Analysis > Navigate to recall the navigate dialog box. The T3DSO3000 provides three navigate types: Search by Event, Time and History Frame. 199 User Manual... - Page 208 Navigate by Time The oscilloscope automatically adjusts the trigger delay according to the direction set by the user. Touch Type in the navigate dialog box to select the navigate type as “Time”. There are two ways to navigate by time: �...
- Page 209 Touch Event Num to set the event number by the universal knob or the virtual keypad. Press the navigation buttons on the front panel to go to the previous or next search event. Touch Playing Mode to set the search event playing mode.
- Page 210 Navigate by History Frame When the history function is turned on, Navigate can be used to play history frames (see the chapter “History” for details of history function). Touch Type in the navigate dialog box to select the navigate type as “History Frame”. Touch Frame to set the frame number by the universal knob or the virtual keypad.
- Page 211 The following is an example of an occasional runt signal to demonstrate how to quickly locate and find events of interest by using the combination of Search and Navigate: The input signal is a 5V periodic square wave, in which every 200ms there is a dwarf pulse with a height of 1/3 of the normal amplitude: First, set the trigger type to Runt, in order to trigger on the dwarf pulse.
- Page 212 Set the horizontal scale to 100 ms/div, then 5 markers with a 200 ms interval are shown on the display, indicating that a total of 5 dwarf pulses were found in the full 1 second acquisition: Turn on the Zoom function to observe the full view of the frame and the detail of the third dwarf pulse at the same time: User Manual 204...
- Page 213 Press the Run/Stop button on the front panel to stop the acquisition, and then follow the steps Navigate> Type to select “Search Event”. The following figure shows the first dwarf pulse. In this example the list is enabled and time labels of each event are shown in the list.
-
Page 214: Mask Test
22 Mask Test 22.1 Overview Users can create masks and define the rule used to evaluate Pass/Fail operations. An event violating the rule is defined as a failure and a pulse can be generated from the “Aux Out” port on the back panel. This is very useful to find and quantify anomalies in production tests or similar batch measurements. - Page 215 Perform Analysis > Mask Test to open the Mask Test dialog box: A. Turn on/off the test B. Select the source(C1-C4) C. Select the rule(All In, All Out, Any In and Any Out) D. Set the mask Turn on/off the Pass/Fail operation.
-
Page 216: Mask Setup
22.2 Mask Setup Touch Mask Setup in the Mask Test dialog box to set the mask. There are two methods to create mask, one is by setting horizontal and vertical values, and the other is by drawing polygon mask. A. Create mask automatically according to the waveform B. - Page 217 A. Set the spacing of the mask to the trace in horizontal, with unit of division B. Set the spacing of the mask to the trace in vertical, with unit of division C. Create the mask based on settings in D.
-
Page 218: Mask Editor
Saving and recalling mask files (*.msk) is similar to the operation of setup files, see the chapter “Save/Recall” for details. 22.2.2 Mask Editor The Mask Editor is a built-in tool which provides an approach to create custom masks. Below is its layout: Menu bar Coordinate of the latest touched point on the display Mask edit area, which is equivalent to the grid area. - Page 219 Menu bar There are 2 menus on the menu bar. The File menu includes ordinary file operations such as: � New: Create a new mask file � Open: Open an existing mask file � Save: Save the current mask file �...
-
Page 220: Pass/Fail Rule
� Edit Polygon: Edits a polygon. Vertices, sides and the polygon are all editable object � Delete Polygon: Deletes selected polygon To edit a vertex, side or polygon object, firstly select it, and then move it by a dragging gesture or by entering the desired value in coordinate edit area. -
Page 221: Operation
• Any In: Any data point inside the mask will be recognized as pass. All data points outside the mask will cause a failure. • Any Out: Any data point outside the mask will be recognized as pass. All data points inside the mask will cause a failure. -
Page 222: Dvm
23.1 Overview The DVM (Digital Voltage Meter) function can be used to measure parameters such as DC and AC amplitudes. The T3DSO3000 measures the specified parameter of the input signal and can display it in various formats, including: Bar, Histogram and Trend. DVM is asynchronous to the acquisition system of the oscilloscope. -
Page 223: Mode
Touch the menu Analysis>DVM to open DVM dialog box: A. Turn on or off the DVM B. Select the source (C1-C4) C. Select the Mode: DC Mean, DC RMS, AC RMS, Peak-Peak and Amplitude D. Turn on or off the Auto Range E. -
Page 224: Diagrams
• DC Mean: Average of the data • DC RMS: Root mean square of the data at DC coupling • AC RMS: Root mean square of the data at AC coupling • Peak-Peak: Difference between maximum and minimum data value •... - Page 225 Bar diagram accurately displays the current measured value. Touch Bar in the DVM dialog box to display it. A. Mode B. Current value C. Bar corresponding to the current value Histogram Histogram visually indicates probability distribution of the measured values. Touch histogram in the DVM dialog box to display it.
- Page 226 A. Mode B. Histogram display area C. Current value D. The bin including the maximum value and probability with which values falling into it E. Statistics counts F. Reset statistics Trend Trend diagram indicates the trend of the measured values over time. Touch trend in the DVM dialog box to display it.
- Page 227 E. Maximum value F. Minimum value G. Average value H. Reset statistics Press the Clear Sweeps button on the front panel to restart counting and statistics. Touch the symbol in the histogram and trend display areas to restart statistics. When all the 3 diagrams are closed, there is a simple information bar on top left of the waveform display area to show the current value of the DVM: 219 User Manual...
-
Page 228: Counter
24 Counter 24.1 Overview The counter is used to measure the frequency and period of a signal or count the events happening within it. The counter is asynchronous to the acquisition system of the oscilloscope. It can work well even if the acquisition of the oscilloscope is stopped (indicated by a red colored Run/Stop button) Touch the menu Analysis >... -
Page 229: Mode
Statistics When statistics are enabled, the counter will increment the data and display the statistics results on the screen. Value – The latest count Mean – The average of all historical counts – The minimum of all historical counts – The maximum of all historical counts Stdv –... - Page 230 • Frequency: Average frequency over a period of time • Period: The reciprocal of the average frequency over a period of time • Totalizer: Cumulative count When the mode is selected as totalizer, the edge of the counting source needs to be set.
- Page 231 A. Turn on or off the gate B. Select the gate type: Level or After Edge C. Gate source display area. C1 and C2 are gate sources of each other, C3 and C4 are gate sources of each other D. When the gate type is level, set the polarity (Positive or Negative) of the gate source.
-
Page 232: Histogram
26 Histogram 26.1 Overview The T3DSO3000 supports waveform histograms for observing probability distributions of the waveform in the specified region. The statistics can be performed in both horizontal and vertical directions. The histogram continues to update as long as the acquisition is active. - Page 233 Type • Horizontal – Displays a histogram in the horizontal direction. The oscilloscope counts waveform data falling into every horizontal (time) bin defined by the histogram region and shows the histogram at the bottom of the waveform area. • Vertical –...
- Page 234 Histogram Statistics When histogram statistics is turned on, the oscilloscope will show statistics parameters of the histogram on the display. – Total samples falling in the histogram region Peak – Samples in highest bin – Maximum value of the samples –...
-
Page 235: Region Setting
Press the Clear Sweeps button or touch Reset Histogram in the histogram dialog box to clear and restart the statistics. 26.2 Region Setting Histogram region can be created and moved directly by gesture or by setting Histogram > Region Setting in the dialog box. The border color of the histogram region is consistent with the color of the specified source. - Page 236 After the region is created, it can be moved by dragging gesture. Dialog Box Touch Histogram > Region Setting to recall the dialog box. A. Set left border of the histogram region B. Set right border of the histogram region C.
-
Page 237: Power Analysis
26 Power Analysis 26.1 Overview The T3DSO3000 supports a power analysis function. Power analysis can help users quickly and easily analyze and debug switching power supply design. It automatically calculates Power Quality, Current Harmonics, Inrush Current, Switching Loss, Slew Rate, Modulation, Turn On/Turn Off, Transient Response, PSRR, Power Efficiency, Output Ripple, etc. -
Page 238: Power Quality
26.2 Power Quality The specific measurement parameters of power quality analysis include active power, apparent power, reactive power, power factor, power phase angle, voltage effective value, current effective value, voltage crest factor and current crest factor of power input of a switching power supply. Type Power - includes all the items to describe energy flow in a system: Active... - Page 239 Vrms V_Crest = Vpeak / Vrms Current Crest - current parameters of the power input, include current crest, current effective value and current crest factor. Irms I_Crest = Ipeak / Irms Signal Settings Touch Signal to recall signal settings dialog box: A.
-
Page 240: Current Harmonics
Touch Signal > Connection Guide to recall the connection guide of power quality, as shown in the figure below. Please follow the instructions in this figure for the correct connections. Touch the icon on the top right of the guide to close. 26.3 Current Harmonics Current harmonics is used to analyze the input current harmonics. - Page 241 A. Set the frequency of the line (Auto, 50 Hz, 60 Hz or 400 Hz) B. Set the standard type (IEC61000-3-2 A, IEC61000-3-2 B, IEC61000-3-2 C or IEC61000-3-2 D) C. Set the display type (Off, Bar Chart or Table) D. Return to previous menu Standard IEC 61000-3-2 is an international standard that limits mains voltage distortion by prescribing the maximum value for harmonic currents from the second...
-
Page 242: Inrush Current
Parameter Description For the first 40 harmonics, the following values are displayed: Measured Value (RMS) -- The measured value displayed in the unit specified by the harmonic unit parameter Limit Value (RMS) -- Limits specified by selected standard Margin (%) --The margin specified by selected standard parameters. - Page 243 Signal Settings Touch Signal to recall signal settings dialog box: A. Set the input voltage source B. Set the input current source C. Set the expected current value, the range is 100 mA - 500 A. The oscilloscope will set the trigger level to expected current/20 and the vertical scale of the current channel to expected current/3.
-
Page 244: Switching Loss
26.5 Switching Loss Switch loss analysis can be used to calculate the power dissipated in the switching period. Deskew Calibration A relatively small skew can cause a large measurement error of switching loss, especially during the on phase when the voltage is close to zero and the nonon phase when the current is close to zero. - Page 245 After deskew calibration Before deskew calibration Configuration Touch Config to recall configuration dialog box: A. Set the voltage reference, i.e. the switch level at the edge of the input switch. This value is a percentage of the maximum switching voltage. Adjusting value ignore background noise.
- Page 246 Conduction Type Waveform -- The power waveform uses the original data, and the calculation formula is P = V * I,E = P * T. Rds (on) -- In the on area (where the voltage level is lower than the voltage reference (adjustable)), the power calculation formula is P = I * Rds (on).
-
Page 247: Slew Rate
26.6 Slew Rate The slew rate measures the change rate of voltage or current during switching. Connection Guide Touch Signal > Connection Guide to recall the connection guide for slew rate, as shown in the figure below. Please follow the instructions shown in this figure for the connections. -
Page 248: Output Ripple
Connection Guide Touch Signal > Connection Guide to recall the connection guide of modulation, as shown in the figure below. Please follow the instructions shown in this figure for the connections. Touch the icon on the top right of the guide to close. 26.8 Output Ripple Power supply ripple is an important parameter to evaluate DC power supply, which represents the quality of output DC voltage. -
Page 249: Turn On/Turn Off
26.9 Turn On/Turn Off Turn on analysis determines the time taken for the power supply to reach 90% of its steady state output. Turn off analysis determines the time taken for the power supply to fall to 10% of its maximum output voltage. Signal Settings Touch Signal to recall signal settings dialog box: 241 User Manual... - Page 250 A. Set the input voltage source B. Set the output voltage source C. Set the input type (AC or DC) D. Set the duration, the range is 5 ns - 20 s. The oscilloscope will set the timebase according to the value (duration / 10) E.
- Page 251 - When the input voltage first rises to a certain percentage (usually 10%) of its maximum amplitude - When the output DC voltage rises to a certain percentage (usually 90%) of its maximum amplitude Turn Off - Determines the time taken for the power supply to fall to a certain percentage of its maximum output voltage when it is turned off.
-
Page 252: Transient Response
26.10 Transient Response Transient response analysis can determine the response speed of the output voltage of the power supply to the change of the output load. This time starts from the first time that the output voltage exits the stable band and ends at the last time that the output voltage enters the stable band. - Page 253 Configuration Touch Config to recall configuration dialog box: A. Set the input low current value. This is the expected low current value before or after the load change B. Set the input high current value. This is the expected high current value before or after the load change C.
-
Page 254: Psrr
26.11 PSRR Power supply rejection ratio (PSRR) test is used to determine how the regulator suppresses ripple noise in different frequency ranges. The oscilloscope controls the arbitrary waveform/function generation to output a sweep signal, which is used to introduce ripple into the DC voltage transmitted to the voltage regulator. Measure the AC RMS ratio of input to output, and plot the relationship between the ratio and frequency. -
Page 255: Power Efficiency
26.12 Power Efficiency Power efficiency analysis can test the overall efficiency of the power supply by measuring the output power and input power. This analysis is only available on 4-channel oscilloscopes, because all of the input voltage, input current, output voltage and output current probes are necessary for the measurement. -
Page 256: Bode Plot
27 Bode Plot 27.1 Overview The T3DSO3000 supports an automatic bode plot function. This function provides a frequency response curve of the device-under-test as well as the interface for output sweep parameter control and data display settings. At this time, either the built in AWG or one of the T3AFG function generators are supported. -
Page 257: Configuration
A. Turn on/off the bode plot B. Configure the bode plot (DUT, AWG connection, sweep parameters) C. Turn on/off the operation D. Set display parameters. You can set the coordinate axis of bode plot, trace visibility display, and cursors of bode plot E. -
Page 258: Sweep
B. Channel gain. When it is set to Auto, the oscilloscope will automatically adapt the vertical scale according to the signal amplitude; when it is set to Hold, it will always keep the vertical scale used previously C. Arbitrary waveform generator connection settings. Touch Interface to select the connection type. - Page 259 and span frequency need to be set; when it is set to decade, the corresponding start frequency and stop frequency need to be set C. Set the number of sweep points. The larger the number of points, the higher the sweep resolution D.
- Page 260 G. Variable level signal display area H. Touch Edit to turn on the profile editor Touch Nodes to set the signal node number through the universal knob, or touch ▲ to increase the nodes and ▼ to decrease. Touch the cell in the table area to set the frequency and amplitude of the corresponding node.
-
Page 261: Display
27.3 Display Bode plot display settings include: amplitude, phase, cursors and trace visibility. Amplitude Set the amplitude coordinate axis of bode plot. Touch Display>Amplitude to recall the amplitude setting dialog box: A. Set the scale of the amplitude coordinate axis B. - Page 262 E. Return to previous menu Cursors T3DSO3000 can use the cursors to measure the bode plot curve. The cursor of bode plot is similar to the ordinary cursor, see the chapter “Cursors” for details. Touch Display > Cursors to recall the cursor setting dialog box.
-
Page 263: Data Analysis
A. Turn on/off the cursors of bode plot B. Set the cursors type (X or Y) C. Specify the cursor and set the position (by gestures, universal knob, virtual keypad) D. Set the source 1 E. Set the source 2 F. - Page 264 can be used to measure the five parameters of the bode plot curve: upper cutoff frequency (UF), lower cut-off frequency (LF), bandwidth (BW), gain margin (GM), phase margin (PM). A. Data list display area B. Cursors C. Data point location line D.
- Page 265 A. Turn on/off the data list B. Set the selected row in the list. Adjust the universal knob to set, or directly touch the list display area to select a specific line. C. Set the data source D. Save/Recall the data. Saving and recalling bode plot data (*.csv) is similar to the operation of setup files, see the chapter “Save/Recall”...
-
Page 266: Display
B. Set the measurement source C. Measurement parameter area. Touch each parameter area to activate the measurement parameter. In the figure above, "UF" is activated. D. Clear all measurements V. Clear the current measurement VI. Close the measurement configuration window For example, to add UF measurements for C2 and GM measurements for C3, follow the steps below: Measure >... - Page 267 A. Switch the waveform display type to Vectors (line display) or Dots B. Turn on or off color grade C. Set persist D. Clear persist E. Clear display. The operation clears waveforms displaying on the screen and clear persist F. Select the grid type (M1, M2 and M3) G.
- Page 268 • Vectors: The samples are connected by lines (i.e. interpolated) and displayed. The interpolation methods include linear interpolation and sin(x)/x interpolation. See the section of “Acquisition Setup” for details of interpolation. • Dots: Displays the raw samples directly. Vector Display Dot Display User Manual 260...
- Page 269 Note: In the Run state, due to the high waveform update rate of the oscilloscope, the waveform displayed is the superposition of multiple frames. Therefore, what is seen using the dots display is not the discrete sampling points, but the display effect similar to equivalent sampling.
- Page 270 New acquisitions are shown in their normal color with normal intensity. In combination with T3DSO3000's high waveform update rate and persist function, in some cases anomalies in the waveform can be found in short time without complex trigger settings to improve test efficiency.
- Page 271 When the display dialog box and persist are off, double pressing the Display/ Persist button on the front panel can quickly turn on persist. Touch Persist in the display dialog box to set the persistence time. • Off: Turn off persist. •...
- Page 272 M2 Mode M3 Mode User Manual 264...
-
Page 273: Arbitrary Waveform Generator
29 Arbitrary Waveform Generator 29.1 Overview The T3DSO3000 supports arbitrary waveform/function generation by incorporating an external USB Arbitrary Waveform Generator accessory. The AWG functions include: � 6 basic waveforms: Sine, Square, Ramp, Pulse, Noise and DC � 45 built-in and 2 custom arbitrary waveforms �... -
Page 274: Output
A. Turn on/off the output of the AWG B. Select the waveform type (Sine, Square, Ramp, Pulse, Noise, DC and Arb) C. Set the frequency D. Set the amplitude E. Set the offset F. Other AWG settings: output load, overvoltage protection etc. G. -
Page 275: Wave Type
29.3 Wave Type The AWG function provides six standard waveforms and multiple arbitrary waveforms. The standard waveforms are Sine, Square, Ramp, Pulse, Noise and DC. The following table shows all waveform types and corresponding parameters. Wave Type Parameters Sine Frequency, Amplitude, Offset Square Frequency, Amplitude, Offset, Duty Ramp... - Page 276 There are 6 tabs in the window. Under each tab a catalog of waveforms are listed. Built-in waveforms are stored in Common, Math, Engine, Window, and Trigo. Stored waveforms are located in the Stored menu. Users can edit arbitrary waveforms using the EasyWaveX PC software, and send the stored waveforms to the instrument through the remote interface, or import the stored waveforms from a USB disk.
-
Page 277: Other Setting
29.4 Other Setting Touch Setting in the AWG dialog box to recall “Other Setting” dialog box: A. Select the output load B. Turn on/off the OVP (Over Voltage Protection) C. Turn on/off the sync output D. Do zero adjust E. Set to default F. - Page 278 Sync Output When the Sync Output is turned on, the Aux In/Out port of AWG outputs a CMOS signal with the same frequency as the basic waveform (except Noise and DC) and arbitrary waveform. The maximum supported frequency is 10MHz. Zero Adjust The output zero error of the AWG can be calibrated by using auto mode or manual mode.
-
Page 279: System
– includes Model, Serial Number, Firmware Version and Hardware Version of the AWG module. Upgrade The firmware here refers to the firmware of the AWG module. The T3DSO3000 supports firmware and configuration file upgrades for the AWG via a USB disk. Follow the steps below: 1. - Page 280 4. Touch Upgrade to start the upgrade progress. A progress bar shows the percentage finished. 5. After the upgrade, the AWG will disconnect from the system, and the oscilloscope will dsiplay the message “Upgrade completed. Please reconnect the AWG device.” 6.
-
Page 281: Save/Recall
30 Save/Recall The T3DSO3000 supports saving setups, reference waveforms, screen shots, and waveform data files to internal storage or external USB storage devices. Saved setups and reference waveforms can be recalled as needed. 30.1 Save Type T3DSO3000 supports saving: Setup, Reference, Image (*.bmp/*.jpg/*.png), Waveform Data (binary/csv/matlab), and Calibration Files. - Page 282 Saves the screen shot to external memory in *.jpg format. Saves the screen shot to external memory in *.png format. Binary Data Saves the waveform data to external memory in binary (*.bin) format. CSV Data Saves the waveform data to the external memory in “.csv” format. After selecting this type, you can touch the ParaSwitch to determine to include the scope configuration parameter information (horizontal timebase, vertical scale, etc.) or not.
- Page 283 The following table shows the relationship between the save types and the save/recall operations. Type Recall Save to Save to Internal External Setup √ √ √ Reference × √ √ × √ × × √ × × √ × Binary Data ×...
-
Page 284: Internal Save And Recall
30.2 Internal Save and Recall “Setup” can be saved/recalled to/from the internal memory. In this section the save/recall operations of Setup is introduced. Save the oscilloscope setup to internal memory Follow the steps below: A. Select Mode as “Save” B. Select Type as “Setup” C. -
Page 285: External Save And Recall
Recall oscilloscope setup from internal memory Follow the steps below: A. Select Mode as “Recall” B. Select Type as “Setup” C. Select Recall Path as “Internal” D. Select No. of internal storage locations, 1-10 optional E. Touch Recall to perform the recall operation 30.3 External Save and Recall Before performing an external save or recall, make... -
Page 286: File Manager
30.3.1 File manager The T3DSO3000's file manager has similar style and operation to the MS Windows operating system. A. Left window - directory structure B. Right window - file listing C. Menu bar D. Save/Recall command bar E. Close the file manager Left window: Displays a list of available drives and internal folders. - Page 287 Right window: Displays the files and the subfolders contained in the selected folder. Tool bar: Graphical commands for file operations. � File Type: Specify the file type to display, including All (all types), *.xml,*.ref,*.bmp,*.jpg,*.png,*.csv,*.dat,*.bin, *msk, *smsk � View Type: Contains two modes of "Detail" and "Icon Detail View Type Icon View Type �...
-
Page 288: External Save And Recall Instance
Recall the specified file. Visible when the mode is “Recall” 30.3.2 External Save and Recall Example Save the screen shot to the path “Udisk0\t3dso3000\” in the format of BMP First, Insert the USB stick. Secondly, set the parameters of the Save operation: Select Mode as “Save”... - Page 289 Fourth, touch Save As , click the pop-up text box to recall the virtual keyboard and input the file name, and then touch OK : Once saved, the new BMP file is visible in the file manager: 281 User Manual...
- Page 290 1. Note: Pressing the Print button on the front panel quickly saves a screen shot to the USB stick. Recall the setup file “uart_decode.xml” stored in path “Udisk0\t3dso3000\” First, insert the USB stick with the file "uart_decode.xml" stored folder “\t3dso3000\”.
- Page 291 Third, select the \Udisk0\t3dso3000\directory in the file manager, and then select the setup file “uart_decode.xml” t3dso3000 Fourth, touch Recall and wait for the oscilloscope to finish recalling the setup. 283 User Manual...
-
Page 292: System Setting
31 System Setting Most of the system settings can be found in the Utility dialog box, such as system status, language, sound, self-calibration and firmware upgrade. 31.1 System Status Operate Utility> System Setting > System Status to check the system status. System information includes the contents shown below. -
Page 293: Upgrade Software
:Indicates the buzzer is on. :Indicates the buzzer is off. 31.3 Upgrade Software The firmware is upgradeable through use of an external USB memory devices. Make sure the USB disk contains the correct upgrade file (*.ads) is connected to the oscilloscope before performing the upgrade. Operate Utility>... - Page 294 T3DSO3000 Click Upgrade in the upgrade dialog box to start the upgrade. The oscilloscope first copies the upgrade file (*.ads) to the local memory and parses it. If the parse succeeds, it will show the following dialog. Users can choose Cancel to cancel the upgrade, or Reboot to restart the oscilloscope immediately and continue the upgrade.
-
Page 295: Language
Warning: Do Not turn off the power during upgrading. Otherwise, the oscilloscope may not boot up any more! 31.4 Language The T3DSO3000 supports multiple languages, including: Simplified Chinese, Traditional Chinese, English, French, Japanese, German, Spanish, Russian, Italian, Portuguese, and so on. -
Page 296: I/O Setting
31.6 I/O Setting 31.6.1LAN Operate the following steps to set the LAN port: Perform Utility> System Setting > I/O Setting > LAN Config to open the LAN config dialog box. A. Check Automatic (DHCP) to enable dynamic IP. In this case the oscilloscope must be connected to the local area network with a DHCP server. -
Page 297: Clock Source
31.6.2 Clock Source The T3DSO3000 supports internal and external clock sources. When an external clock source is used, the 10 MHz reference clock output of another instrument can be used to achieve clock synchronization between two instruments. Operate the following steps to set the clock source: Utility>... -
Page 298: Date/Time
31.7 Date/Time The T3DSO3000 has a RTC clock, which helps to record absolute time information for screen shots, history frames and so on. Operate Utility> System Setting > Date/Time to open the Date/Time dialog box: Touch the text box of Hour, Minute, Second, Day, Month and Year to edit these fields. - Page 299 Horizontal Ref • Fixed Delay: When the timebase is changed, the horizontal delay value remains fixed. As the horizontal timebase scale is changed, the waveform expands/contracts around the center of the display • Fixed Position: When the timebase is changed, the horizontal delay remains fixed to the grid position on the display.
- Page 300 Timebase=10ns/div,Horizontal Delay=-20ns=-2div Fixed position, timebase is changed to 5ns/div, the grid number of delay (-2div) remains fixed, while the horizontal delay changes to -10ns User Manual 292...
- Page 301 Fixed delay, timebase is changed to 5ns/div, the horizontal delay value remains fixed, while the grid number of delay changes to -4div 293 User Manual...
-
Page 302: Perform Self-Test
31.10 Perform Self-Test The Self tests includes screen test, keyboard test and LED test. It is used to check whether the oscilloscope has any electrical or mechanical problems on the user interface such as color distortion or sensitivity of buttons and knobs. Screen Test The screen test checks if the oscilloscope display has serious color distortion, bad pixels or screen scratches. - Page 303 Keyboard Test The keyboard test is used to check whether the oscilloscope front panel buttons or knobs are responsive or sensitive. Perform Utility> Do Self-Test > Keyboard Test to recall the following interface: Knob test: Turn each knob clockwise, counter-clockwise, and press down. Observe whether the value on the corresponding knob (default 0) on the screen increases or decreases in real time and whether the knob lights up when it is pressed.
- Page 304 LED Test The LED test is used to check whether the button backlight on the front panel is functional. Operate Utility> Do Self-Test > LED Test to recall the following interface: Press the “Single” button and the first LED on the front panel will light. The corresponding position of the key on the screen will also change color.
-
Page 305: Do Self Cal
31.11 Self Cal The self-calibration program can quickly calibrate the oscilloscope to reach the best working state and the most precise measurement. It is recommended to perform a self-calibration if the change of ambient temperature is more than 5 ℃. Note: Make sure the oscilloscope has been warmed up or operated for more than 30 minutes before the self-calibration. -
Page 306: Default
Pressing the Default button on the front panel has an equivalent effect. 31.13 Power on Line Operate Utility> Power on Line to set. See the chapter “Power on” for details. 31.14 Debug This function is used for internal development of Teledyne LeCroy. User Manual 298... -
Page 307: Remote Control
32 Remote Control The T3DSO3000 provides a LAN port and a USB Device port which can be used for remote control in multiple ways. 32.1 Web Browser A built-in web server provides an approach to visit the oscilloscope by web browser. -
Page 308: Other Connectivity
E. Click here to perform a firmware upgrade 32.2 Other Connectivity The T3DSO3000 also supports remote control of the instrument by sending SCPI commands via NI-VISA, Telnet, or Socket. For more information, refer to the programming guide of this product. -
Page 309: Troubleshooting
The commonly encountered failures and their solutions are listed below. When you encounter those problems, please solve them following the corresponding steps. If the problem remains still, please contact Teledyne LeCroy as soon as possible. 1. The screen is still dark (no display) after power on: a) Check whether the power is correctly connected. - Page 310 d) Check whether there are signals generated from the item to be tested. e) Resample the signal. 3. The tested voltage amplitude is greater or lower than the actual value (Note that this problem usually occurs when a probe is used): a) Check whether the attenuation coefficient of the channel complies with the attenuation ratio of the physical probe.
- Page 311 Make sure that the USB disk system format is FAT32. e) Restart the instrument and then insert the USB storage device to check it. f) If the USB storage device still cannot be used normally, please contact Teledyne LeCroy. 303 User Manual...
-
Page 312: Contact Teledyne Lecroy
34 Contact Us Teledyne LeCroy (US Headquarters) 700 Chestnut Ridge Road Chestnut Ridge, NY. USA 10977-6499 Phone: 800-553-2769 or 845-425-2000 Fax Sales: 845-578-5985 Email Sales: contact.corp@teledynelecroy.com Email Support: support@teledynelecroy.com (Oscilloscopes, Waveform Generators, Signal Integrity) Web Site: h�p://teledynelecroy.com/ Phone Support: 1-800-553-2769... -
Page 313: Certifications
35 Certifications Teledyne LeCroy certifies compliance to the following standards as of the time of publication. Please see the EC Declaration of Conformity document shipped with your product for current certifications. EMC Compliance EC DECLARATION OF CONFORMITY - EMC The instrument meets intent of EC Directive 2014/30/EU for Electromagnetic Compatibility. - Page 314 European Contact:* Teledyne GmbH, European Division Im Breitspiel 11c D-69126 Heidelberg Germany Tel: + 49 6221 82700 AUSTRALIA & NEW ZEALAND DECLARATION OF CONFORMITY – EMC The instrument complies with the EMC provision of the Radio Communications Act per the following standards, in accordance with requirements imposed by Australian Communication and Media Authority (ACMA): AS/NZS CISPR 11:2015 Radiated and Conducted Emissions, Group 1, Class A.
- Page 315 Many countries prohibit the disposal of waste electronic equipment in standard waste receptacles. For more information about proper disposal and recycling of your Teledyne LeCroy product, please visit teledynelecroy.com/recycle. RESTRICTION OF HAZARDOUS SUBSTANCES (RoHS) EC DECLARATION OF CONFORMITY – RoHS...
- Page 316 CHINA RoHS 2 Unless otherwise specified, all the materials and processes are compliant with the latest requirements of China RoHS 2. The hazardous substances contained in the instrument are disclosed in accordance with the standards SJ/T 11364-2014 (Marking for the restricted use of hazardous substances in electronic and electrical products) and GB/T 26572-2011 (Requirements on concentration limits for certain restricted substances in electrical and electronic products).
- Page 317 Toxic or Hazardous Substances and Elements Part Name Hexavalent Polybrominated Polybrominated Lead Mercury Cadmium Chromium Biphenyls Diphenyl Ethers (Pb) (Hg) (Cd) (PBDE) (Cr6+) (PBB) PCBAs Mechanical Hardware Sheet Metal Plastic Parts Cable Assemblies Display Power Supply Fans Batteries Power Cord Exit Power Supply (if present) Probes (if present)
- Page 318 © 2020 Teledyne Test Tools is a brand and trademark of Teledyne LeCroy Inc. All rights reserved. Specifications, prices, availability and delivery subject to change without notice. Product brand or brand names are trademarks or requested trademarks of their respective holders.
Need help?
Do you have a question about the T3DSO3000 and is the answer not in the manual?
Questions and answers