Table of Contents
Advertisement
Quick Links
Advertisement
Table of Contents

Related Manuals for Minebea MPC-201B-25


Summary of Contents for Minebea MPC-201B-25
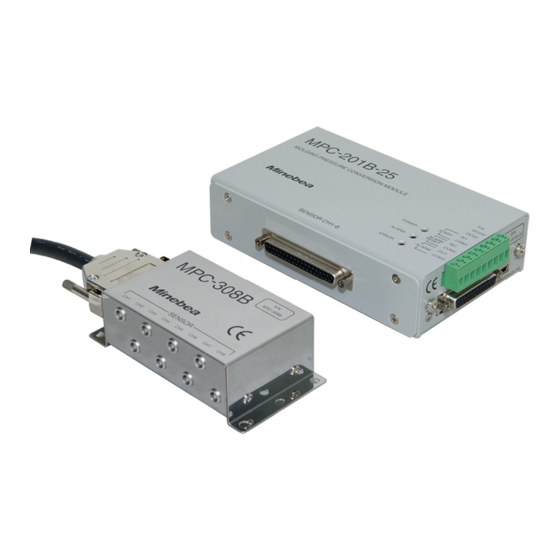
- Page 1 Molding Pressure Conversion Module MPC-201B-25 Instruction Manual EN294-1889C...
-
Page 3: Introduction
Introduction Thank you for purchasing the MPC-201B-25 Molding Pressure Conversion Module. This instruction manual describes how to operate the device, as well as noteworthy points. Note that handling or operating the device incorrectly may result in malfunctions. Read this manual thoroughly before use for safety and optimal results. -
Page 4: Safety Precautions
Safety Precautions Please be sure to read this manual before attempting to use the equipment. 1. Installation location CAUTION Install in a location where temperature and humidity conditions are within the ranges described below. Amplifier Environmental temperature: -10° C to 50° C Environmental humidity: 85 % RH or less (Non-condensing) ... - Page 5 (2) When installing the amplifier The individual component dimensions are as shown below: Unit: mm The amplifier is held in place by sticking the magnetic sheet on the bottom of the device to the surface on which it is to be installed. The following conditions must be complied with when installing the amplifier.
- Page 6 (3) When installing MPC-308B relay box (For more information on installing the MRB-304-BI or MRB-304-CV, see the separate instruction manuals.) MRB-304-BI instruction manual EN294-1959 MRB-304-CV instruction manual EN294-1960 The individual component dimensions are as shown below: 2 m (FA409-541-2M) Minimum bending radius: 50 mm Unit: mm M ag n et The relay box can be mounted using the magnets or bolt-mounted using the mounting holes.
- Page 7 M4 hex socket head bolts × 4 Magnet mounting screws × 2 Magnets × 2 Mount using the M4 hex socket head bolts in two of Remove the magnets before mounting using the bolts. the three holes on each side. (M4 tapped holes must The magnets can be removed by removing the screws be drilled in the mounting surface.) in the center of the magnets.
-
Page 8: Power Supply
2. Power supply WARNING Turn off power before connecting or disconnecting cables. Leaving power on may result in electric shock or equipment damage. WARNING Before turning on power, confirm that the power supply specifications match the power supply specifications for the equipment. Contact with us if the specifications do not match. - Page 9 Do not open numerical data or alarm history csv files while acquiring data with the PC. Opening such files while acquiring data with the PC will result in an error, and will turn the PC interface off-line without updating the numerical data or alarm history. Set the start trigger signal interrupt interval to at least 1 s.
-
Page 10: Compatible Standards
4. Compatible standards This equipment conforms to the following standards: EN61326-1: 2013 "Electrical equipment for measurement, control, and laboratory use – EMC requirements" "Immunity requirements for equipment intended to be used in industrial locations" RoHS compliant CAUTION The following usage conditions must be strictly adhered to ensure that this equipment complies with the above standards. -
Page 11: Revision History
Revision History Date Manual No. Revision reason (details) 1st issue Nov. 2019 DRW. No. EN294-1889 In accordance with ECN No. FN21-0401. Beginning, Section 1: Added MRB-304-BI/CV operating environment. Beginning, Section 1 (3): Added MRB-304-BI/CV information. Beginning, Section 4: Updated RoHS directive standards. Section 3: Added “Configuration example”... -
Page 12: Table Of Contents
Contents Page I nt roduct i on ..................... . . I Pi ct ogram s and conv ent i ons u sed i n t hi s m anual . - Page 13 8-9. Display Channel Selection ..................40 8-10. Status Display 1 ......................41 8-11. Status Display 2 ......................41 9. Chan ge Co ndi t i on Screen ................42 9-1.
- Page 14 Anal og O ut put F i ne Adj ust m ent Screen ............85 Check ERRO R LED D et ai l s .
-
Page 15: Overview
1. Overview This equipment is an eight-channel input digital conversion module for measuring resin pressure inside molds in injection molding machines. The pressure input from force sensors is monitored in accordance with preset parameters, and the results are output in the form of an alarm signal. Pressure waveforms converted to analog voltages can be transmitted to the molding machine. -
Page 16: System Configuration
. . . Force sensors (LSMS,LSMSB × 8) The MPC-201B-25 (this equipment), relay box, and relay cable are all sold separately. For further details on optional items, see Section 22-6 “Options”. The MPC-201B-25 can also be connected to the MPC-308 relay box. -
Page 17: Equipment Part Names And Functions
(1) Sensor connection D-sub connector (1) Sensor connection D-sub connector Allows up to eight sensors to be connected via the relay cable and relay box. Only Minebea dedicated sensors are supported. (2) Status LEDs Indicate the equipment status. The POWER LED illuminates when the power is on, the ALARM LED illuminates when an alarm occurs, and the ERROR LED illuminates when an amplifier error occurs. -
Page 18: Relay Box And Relay Cable
4-2. Relay box and relay cable MPC-308B (4) Bolt mounting holes (2) Relay cable (1) Sensor connectors CH1 to CH8 (3) Magnetic sheet MRB-304-BI (4) Bolt mounting holes (1) Sensor connectors CH1 to CH4 (4) Bolt mounting holes (2) Relay cable MRB-304-CV (4) Bolt mounting holes (1) Sensor connectors CH1 to CH4... - Page 19 When connecting the relay cable to the relay box, be sure to securely tighten the screws on both sides of the D-sub connector. The MPC-201B-25 (this equipment), relay box, and relay cable are all sold separately. For further details on optional items, see Section 22-6 “Options”.
-
Page 20: System Setup
5. System Setup The procedure for configuring the molding pressure system using the module is outlined below. (1) Installation Install the module close to the molding machine Connect the module power supply, I/O, and V-OUT cables, and (2) Wiring connect the module to a PC using a USB cable. Turn on the power to the module. -
Page 21: Installation On Molding Machine
5-1. Installation on Molding Machine 5-1-1. Relay Box Installation The relay box can be mounted using the magnets or bolt-mounted using the mounting holes. For further details on how to mount the relay box, see “1. Installation location” in “Safety Precautions”. CAUTION When connecting the relay cable to the relay box, be sure to tighten the screws on both sides of the D-sub connector fully. -
Page 22: Amplifier Installation
5-1-2. Amplifier Installation The amplifier is mounted on the lower part of the molding machine close to the moving part (platen) of the mold clamping unit. Make sure the operating temperature does not exceed 50 °C here. The amplifier is mounted using the magnetic sheet. For further details, see "1. Installation location" in "Safety Precautions". -
Page 23: Terminal Board Connections
5-2. Terminal Board Connections Wiring precautions Always turn off the power before connecting wires. Do not turn on the power until all installation work is complete. The terminal board is made of resin. Do not drop it or subject it to impact. ... -
Page 24: External Control Input/Output Connection
5-2-2. External Control Input/Output Connection Check that the power has not been turned on, and connect the external control input/output. Marking on casing Description Frame ground (Case protective ground F.G. terminal and F.G. terminal are linked.) 24 V DC power supply DC24 V (20.4 V ~... -
Page 25: Analog Voltage Output Connection
CAUTION There is a possibility that this unit is damaged to cause the potential difference when neither DC0 V nor COM1/COM2 of the power supply on the molding machine are common. In that case, be short-circuited of DC0 V and COM1/COM2 with the terminal block. Use shield cable for the I/O cable, and connect the shield wire to the protective ground terminal. -
Page 26: Usb Connection
Insert the mini-B USB cable provided into the USB connector on the amplifier, and connect it to a PC. Attach the ferrite core provided around the cable at the MPC-201B-25 end as shown below to minimize the effects of noise on the USB cable. -
Page 27: Installing The Software
5-3. Installing the Software Always make sure that the latest version of the measurement software is installed and used. Older versions of the software will not operate with the latest version of the amplifier updated with additional features. The latest software version supports all previous amplifiers. When upgrading the measurement software, always uninstall the old software version first before installing the new version. - Page 28 2) Click [Next]. (To install to a different location, click [Browse] and choose a different volume/directory.) 3) Click [Next].
- Page 29 4) The installation begins. Wait until the process is complete. 5) The window shown above will appear when installation is complete. Click [Close].
-
Page 30: Installing The Driver Software
5-4. Installing the Driver Software The instructions here apply to Windows 7; the screen may appear differently for other operating systems. To install the driver software, connect the amplifier to the PC by a USB cable, and turn on the power to the amplifier. - Page 31 3) Right-click to display the context menu, and select [Properties].
- Page 32 4) Click on [Update Driver…] in the [Driver] tab. 5) Select [Browse my computer for driver software].
- Page 33 6) Click [Browse], specify the location for the driver file, and then click [Next]. To specify a driver located on a CD-ROM: Specify [<CD-ROM>\driver]. 7) Installation starts. Wait for installation to be completed. *If the window below appears during installation, click [Install].
- Page 34 8) The following window appears once installation is complete. 9) Once installation is complete, COM is added to the Device Manager. * The exact COM number will vary depending on the particular system.
-
Page 35: Starting To Use The Software
6. Starting to Use the Software The following flow chart describes basic operating procedures. (1) Launch software Measure molding pressure. Analyze acquired waveform data. *1,*2 (2) Click [Change conditions], (7) Click [Data Processing] to display and set measurement and alarm related Data Processing screen→Step (8) conditions (8) Load and analyze desired... -
Page 36: Launching The Software
The [Measurement screen] will appear as the startup screen. [Measurement screen] You will see the following dialog if the MPC-201B-25 is not connected to the PC by a USB cable when the software is launched. Check that the USB driver has been installed correctly and that the MPC-... -
Page 37: Explanation Of The Measurement Screen
8. Explanation of the Measurement Screen This screen is used to measure and monitor waveforms. This is the screen first displayed when the software starts. The graph windows can be displayed or hidden and their size and position adjusted. * To use [Change conditions], [Data processing], or [Statistics], click [Stop loading data]. Menu bar Measurement Measurement... -
Page 38: Menu Bar
8-1. Menu Bar *Some menus may not be available while acquiring data or measuring. To access the menus, first stop measurement or data acquisition. For details of how to stop measurement and data acquisition, see "(2) Operation" in this section. (1) File Item Description... - Page 39 Item Description Change conditions Displays the [Change Conditions] screen used to modify setting conditions. *To change the conditions, first stop loading data. Data processing Displays the [Data processing] screen to allow data analysis using the waveform data acquired. Statistics Displays the [Statistics] screen to review statistical results for each channel for the measured peak pressure, integral, and peak over eject pressure.
- Page 40 (4) Print Item Description Print screen Prints the Measurement screen. A preview screen is displayed before actual printing occurs. (5) Display Operation buttons and graphs are displayed if they are checked. 1) Measurement button 2) Setting button 3) Quit button 4) Real time screen...
- Page 41 5) Overlay screen 6) Trend (Peak Pressure) screen 7) Trend (Integral) screen...
- Page 42 8) Trend (Peak Over Eject) screen 9) Measurement conditions screen 10) Display channel change screen (6) Browse Displays the [Browse Conditions] screen used to browse the setting conditions. The setting conditions cannot be edited using the [Browse Conditions] screen.
- Page 43 (7) Window Displays the waveforms, trends, and setting conditions display screens in accordance with the format selected below. 1) Restore initial layout 2) Cascade 3) Tile horizontally 4) Tile vertically (8) System 1) Administrator Displays the Administrator setup screen. For details of the Administrator setup window, see "12. Administrator Setup Screen". 2) I/O test Displays the I/O test screen.
-
Page 44: Measurement Buttons
8-2. Measurement Buttons For details of the operation buttons, see "(2) Operation" in "8-1. Menu Bar". The [Change conditions] button is not enabled until waveform data loading has been stopped by clicking [Stop loading data]. Clicking [Stop loading data] stops waveform data loading to the PC until [Restart loading data] is clicked. -
Page 45: Error Display
8-5. Error Display As with the ERROR LED on the main unit, if an amplifier error occurs, the box color changes to red, accompanied by an error indication. The error indication remains visible until the error is canceled. The type of error that has occurred can be checked by opening [ERROR LED information] in [System] on the menu bar. -
Page 46: Waveform Display
8-7. Waveform Display The Waveform display provides [Real time], [Overlay], [Trend (Peak Pressure)], [Trend (Integral)], and [Trend (Peak Over Eject) ]. (1) Real time graph This plots the measured waveforms in real time during measurement. When measurement starts for the next shot, the graph is cleared, and the waveform is plotted for the next shot. - Page 47 (3) Trend (Peak Pressure) This graph is plotted if [Overlay] measurement mode is selected. The peak pressure is plotted as a trend for multiple shots. The pressure (Y-axis) scale can be adjusted automatically on this graph. (4) Trend (Integral) This graph is plotted if [Overlay] measurement mode is selected. The integral pressure is plotted as a trend for multiple shots.
-
Page 48: Using Graph Zoom, In/Out, Move
(5) Trend (Peak Over Eject) This graph is plotted if [Overlay] measurement mode is selected. The peak over eject is plotted as a trend for multiple shots. The pressure (Y-axis) scale can be adjusted automatically on this graph. 8-7-1. Using Graph Zoom, In/Out, Move Right-click on the graph to zoom into a desired area, enlarge/reduce, or move. - Page 49 [Zoom waveform] You can select and zoom into any area of interest on the graph. Using the mouse: Click and hold down the left mouse button at the starting point of the area to enlarge, drag to the end point to enclose the desired area of the frame, then release the left mouse button.
- Page 50 [Move waveform position] Use this function to move the graph up, down, left, or right without changing the size of the graph. Using the mouse: Click and hold down the left mouse button on the graph to be moved while pressing the [Shift] key and drag in the desired direction.
- Page 51 [Enlarge/reduce waveform] The graph can be enlarged or reduced. Using the mouse: Click and hold down the left mouse button while pressing the [Ctrl] key and drag up to enlarge the graph. Using the mouse: Click and hold down the left mouse button while pressing the [Ctrl] key and drag down to reduce the graph.
- Page 52 [Reset scale] 1) Right-click on the graph to be reset to its original scale. 2) Click to select [Reset scale].
-
Page 53: Adjust Scale Automatically
8-7-2. Adjust Scale Automatically Right-click on the graph to adjust the scale automatically. Click [X-axis scale auto adjustment] or [Y-axis scale auto adjustment]. The scale is automatically adjusted to suit the maximum value of the waveform data. * Only the Y-axis can be adjusted automatically on the Trend graph. The scale is automatically adjusted to suit the maximum value of the waveform displayed. -
Page 54: Measurement Conditions Display
8-8. Measurement Conditions Display This displays the measurement-related conditions set in Condition settings. The settings cannot be changed here. To change settings, select [Operation] on the menu bar or use [Change conditions]. For details of how to change conditions, see "9. Change Condition Screen". The top row displays the filename of the setting conditions currently loaded. -
Page 55: Status Display 1
8-10. Status Display 1 Indicates the current software status. Display Description Measuring Indicates that the module interface is connected and measurement is underway. Waiting Indicates that the module interface is connected and measurement is not currently underway. Off-line Indicates that the module interface is not connected. *To connect the interface while off-line, connect the module to the PC and restart the software. -
Page 56: Change Condition Screen
9. Change Condition Screen This screen is used to set measurement and alarm conditions. It must be set before starting waveform measurement. * Numerical values should be entered as single-byte characters. Measurement conditions, graph settings, and other settings set on the [Change Condition] screen can be saved on the PC as setup files and managed as condition files for individual molds. -
Page 57: Measurement Mode
9-1-1. Measurement Mode Setting Description Continuous Measurement continues from the time it begins until it is aborted. Note that the measurement continues with the elapsed time reset to zero after the [Span] set in the measurement conditions elapses. Waveforms are plotted continuously until the span time elapses. *This eliminates the need for a start trigger signal from the molding machine, which can facilitate measurement. -
Page 58: Sensor Channels
9-1-2. Sensor Channels * To edit values or names, double-click the corresponding item name. Press the [ENTER] or [TAB] key after editing to enter the changes made. (1) Operation buttons Operation Description button name Copy CH1 to all Pressing this button refreshes all of the channels to reflect the setting details for CH1. - Page 59 *Check the rated capacity and rated output settings indicated on the label affixed to the sensor cable. Rated capacity Label Rated indication capacity 49.0 N 98.1 N 196.1 N 490.3 N 100K 980.7 N 200K 1961.0 N Rated output 500K 4903.0 N 9807.0 N 29420.0 N...
- Page 60 [200K/500K/1T/3T] Pressure Measurable pressure [MPa] Ejector pin sensor tip diameter area 200K 500K [mm] Rating: 1961.0 N Rating: 4903.0 N Rating: 9807.0 N Rating: 29420.0 N φ4.0 12.56 156.1 390.4 780.8 φ4.5 15.90 123.4 308.4 616.9 φ5.0 19.63 99.9 249.8 499.7 φ5.5 23.75...
-
Page 61: Measurement
9-1-3. Measurement Setting Description Long time Check this to enable long time measurement when the measurement time measurement is set to 121 s or more. With long time measurement, the sampling interval is limited to at least 10 ms, and the maximum number of shots for overlay (121 seconds or curve plotting is limited to 20. -
Page 62: Start Trigger
9-1-4. Start Trigger Setting Description Signal Sets whether the start trigger is input when the contact input is [Rising] (from Lo to Hi) or [Falling] (from Hi to Lo). Delay Sets the start trigger input signal delay (time between receiving a start trigger input and measurement start). -
Page 63: Eject Detection Range
9-1-5. Eject Detection Range Setting Description Start/End Sets start and stop times for measuring peak over eject pressure. Setting range: 0.00 ~ 120.00 s, or 0.00 ~ 600.00 s for long time measurement If the eject detection range is left at the default of 0.00 to 10.00 s, the peak value for the peak over eject pressure will be recorded in the range 0.00 to 10.00 s. -
Page 64: Alarm Conditions Tab
9-2. Alarm Conditions Tab This is used to set alarm monitoring conditions during measurement. The alarm monitoring zone is displayed on the alarm detection graph, allowing the user to set the zone while checking visually. The template can also be viewed on the alarm detection graph, allowing the alarm to be set using the template as a reference. -
Page 65: Graph
9-2-2. Graph Setting Description Graph Alters the alarm detection setting graph scale. Template Displays the filename of the template specified on the [Graph] tab screen. The data of the template file indicated here appears on the alarm detection graph. Filename: 9-2-3. -
Page 66: Alarm Output Condition Settings
9-2-4. Alarm Output Condition Settings Use either monitoring zone or integral pressure to perform alarm monitoring. If the monitoring conditions are met, an alarm signal is output. (1) Alarm monitoring using zone Setting Description Monitoring zone Monitoring 1 Type Area Outputs an alarm if the pressure falls outside the upper or lower limits set within the Monitoring 2... - Page 67 (2) Monitoring zone setting method The monitoring zone can be set by entering values for the upper and lower pressure limits and time for each monitoring system, or using the mouse on the alarm detection graph. Setting Description Right-click on the alarm detection graph to display a menu for selecting Monitoring 1 ~...
- Page 68 (3) Alarm monitoring using integral pressure Setting Description Integral Type Integral Outputs an alarm if the pressure integral falls outside the upper or lower limits set within the measuring period. Range Sets the upper and lower limits. Template integral Displays the template integral value. Integral to Outputs an alarm if the pressure integral for the time taken to peak...
-
Page 69: Alarm Setting Examples
9-2-5. Alarm Setting Examples The correlation between waveform and monitoring zone for various types of alarm monitoring is illustrated below. [NG] in the figures below indicates that an alarm is output. (1) Area An alarm is output if the pressure falls outside the upper or lower limits set within the monitoring period. - Page 70 (4) Time to peak An alarm is output if the time taken to reach the peak within the measuring period is outside the preset time. Peak Peak Time to peak Time to peak (5) Integral An alarm is output if the pressure integral falls outside the upper or lower limits set within the measuring period.
-
Page 71: Alarm Signal Output Settings
9-2-6. Alarm Signal Output Settings Sets how the alarm signal is output when an alarm occurs. Setting Description Signal select Sets the output conditions for the alarm output signal when an alarm is detected. These settings apply to all channels, 1 to 8. Rising Outputs switching contact point from Lo to Hi. -
Page 72: Alarm Cancel Conditions Settings
9-2-7. Alarm Cancel Conditions Settings Sets the conditions for canceling an alarm. Check individual items to enable the corresponding function. Setting Description Key input To cancel an alarm output, press the Space key while the Measurement (Space key) screen is displayed. Time The alarm output is canceled when the preset duration after the alarm elapses. -
Page 73: Graph Tab
9-3. Graph Tab Sets the graph scales for the waveforms displayed using this software. You can also use this tab to change graph titles. 9-3-1. Real Time Graph and Overlay Graph... - Page 74 (1) Real time graph This sets the title, scale, and alarm detection area display for the Real time graph displayed on the Measurement screen. Setting Description Title Sets the title displayed on the graph. Scale Pressure Sets the minimum and maximum scale for the Y-axis. Time Sets the minimum and maximum scale for the X-axis.
-
Page 75: Trend Graph
9-3-2. Trend Graph Sets the title and scale for trend graphs displayed on the Measurement screen and Statistics screen. (1) Peak pressure Setting Description Title Sets the title displayed on the graph. Scale Pressure Sets the minimum and maximum scale for the Y-axis. (2) Integral Setting Description... -
Page 76: Template
9-3-3. Template [Thickness 1 pt] [Thickness 5 pt] Setting Description Template Checking the [Graph display] setting displays the template on the real time and overlay graphs. Click [Reference] and specify an existing template file for the template data. (The path specified will be displayed in the setting box.) Shift The template can be shifted with respect to the time axis. -
Page 77: Analog Output Tag
9-4. Analog Output Tag Sets the analog output for measurement. 9-4-1. Analog Output Settings The settings are applied to all of the analog output channels. Setting Description Analog output Check to enable analog output. 0 V output Sets the zero pressure for analog output. pressure Setting range: 0.00 ~... -
Page 78: Operating Buttons
9-5. Operating Buttons Operating button Description Change Applies the setting changes to the module and software, and returns to conditions the Measurement screen. *If the molding machine is in the middle of a shot, the setting changes are applied from the next shot. Save conditions Saves the setting changes to the specified folder in the PC. -
Page 79: Data Processing Screen
10. Data Processing Screen The Data Processing screen allows up to two measured waveforms to be plotted using the [Graph 1] and [Graph 2] windows. The waveforms can also be used to calculate pressure values at specified points or integral pressure for specified ranges. Menu bar Operating Waveform... -
Page 80: Menu Bar
10-1. Menu Bar 10-1-1. File Item Description Output screen file Outputs the Data Processing screen image to a file. Saved in bitmap (.bmp) format. 10-1-2. Print Item Description Print screen Prints the Data Processing screen. A preview screen is displayed before actual printing occurs. 10-1-3. -
Page 81: Operating Buttons
10-2. Operating Buttons Operating button Description Graph 1 Loads the waveform data to be displayed on the Graph 1 screen. Graph 2 Loads the waveform data to be displayed on the Graph 2 screen. Close Closes the Data Processing screen and returns to the Measurement screen. -
Page 82: Waveform Display Area
10-3. Waveform Display Area The Data Processing screen allows up to two measured waveforms to be plotted using the [Graph 1] and [Graph 2] windows. The waveforms can also be used to calculate pressure values at specified points or integral pressure for specified ranges. 10-3-1. -
Page 83: Analyzing Waveform Data
10-3-3. Analyzing Waveform Data The procedure for analyzing waveform data is the same for all graphs. The explanation provided here describes the procedure using Graph 1 data. If the PC operating system is Windows 8, the real time graph waveform plotting stops if the data processing screen is operated while measurement is in progress. - Page 84 3) Left-click on the ▲ symbol (P1) and drag the line to the position corresponding to the time to view. Release the left mouse button once the line is at the desired time. 4) The pressure for the time corresponding to the ▲ symbol (P1) position will appear in [Graph 1] in the information display area.
- Page 85 [Drawing a horizontal line for a specified pressure] 6) Right-click on the graph, then click to select [Horizontal Line Display]. 7) The graph displays a horizontal line.
- Page 86 8) Left-click on the ▲ symbol (P2) and drag the horizontal line to the desired position. Release the left mouse button once the line is at the desired pressure. 9) The pressure for the ▲ symbol (P2) position will appear in [Graph 1] in the information display area. * See "10-4.
- Page 87 [Viewing the integral for a specified time interval] 11) Right-click on the graph, then click to select [View Integral calculation range line]. 12) The integral calculation range lines are displayed.
- Page 88 13) Left-click on the ▲ symbol (I1) and drag to the start time position for the integral to be calculated. Release the left mouse button once the line is at the desired position. 14) Left-click on the ▲ symbol (I2) and drag to the end time position for the integral to be calculated. Release the left mouse button once the line is at the desired position.
- Page 89 15) The integral for the range defined by two ▲ symbol (I1 and I2) positions will appear in [Graph 1] in the information display area. * Refer to '10-4. Information Display Area'. 16) Right-click on the graph, then click to select [View Integral calculation range line]. This unchecks the menu item and hides the integral calculation line.
-
Page 90: Information Display Area
10-4. Information Display Area This area shows information analyzed from the various graphs. View this display area to check the analysis results. -
Page 91: Explanation Of Display Area
10-4-1. Explanation of Display Area The information displayed for the different graphs is fundamentally identical. The explanation given here provides the details for [Graph 1]. Graph title ▲ symbol position display CH display Pressure Integral selection display display (1) Graph title The analysis results for each graph are displayed in the display area corresponding to the name of the graph analyzed. -
Page 92: Statistics Screen
11. Statistics Screen This screen calculates and displays statistical data (average, maximum, minimum, and standard deviation) for each channel for peak pressure, integral, and peak over eject data measured. 11-1. Display Selection Operating button Description No. of shots Selects the number of shots that can be displayed on a single graph. Trends are displayed by switching the shot number display range for each number of shots set. -
Page 93: Administrator Setup Screen
12. Administrator Setup Screen The Administrator setup screen is used for setting the data save destination for waveform and numerical data, setting and managing passwords, and selecting the display language. (1) Data save destination This sets the data save destination for saving waveform and numerical data. Operating button Description Reference... - Page 94 Operating button Description Alarm record Saves the alarm record in the form of only numerical data when alarms occur. *For details of the alarm record, see "18-2. Measurement Results Auto File Output Destination". Numerical data Saves numerical data after measurement has ended. *For details of numerical data, see "18-2.
- Page 95 2) Change password Clicking the [Change password] displays the following screen. Operating button Description [OK] If the current password entered is correct, the password is changed to the new password. To apply the password change, you need to close the Administrator setup screen. [Cancel] Cancels the password change and closes the Change password screen.
- Page 96 (4) Drive free space threshold value Sets the threshold value at which the available storage space display changes at the bottom left of the Measurement screen. Setting Description Low (Warning) Sets the free space at which the green (OK) display changes to yellow (Low).
-
Page 97: I/O Test Screen
13. I/O Test Screen This screen is used to check external control input and output. You can check the start trigger signal input, alarm resetting signal input, and alarm output signal output. It is useful for checking whether external control devices are connected or disconnected, and for checking the operation of the module. -
Page 98: Analog Output Test Screen
14. Analog Output Test Screen This screen is used to check voltage output. Fixed voltages of 0 V, 5 V, and 10 V can be output via each channel. It is useful for checking the analog input for external control devices, and for checking the analog output operation of the module. -
Page 99: Analog Output Fine Adjustment Screen
16. Analog Output Fine Adjustment Screen The analog output is adjusted at the factory before shipping, but it can be fine-adjusted if the actual output voltage deviates from the output voltage set. Fine-adjust the individual voltage outputs as described below while checking using a digital multimeter or the analog input of an external control device. - Page 100 (3) STEP 3: 10 V output fine adjustment Click [Adjust Start] and fine-adjust the 10 V output. If the analog output voltage is higher than 10 V, adjust by clicking [-], and adjust using [+] if it is lower. Adjustment button Description [-], [+] Fine adjustment buttons...
- Page 101 (4) STEP 4: Fine adjustment complete Fine adjustment of the analog output is now complete for the channel specified. * Note that the adjustment procedure is not yet complete at this stage. To end adjustment and save the settings in the module, click [Register]. Button name Description [Adjust other channel]...
-
Page 102: Check Error Led Details
17. Check ERROR LED Details You can check the error details when the error display on the measurement screen or amplifier ERROR LED is illuminated. The ERROR LED Information Check Function is available for products for which the ROM version of the amplifier is [1.014] or later. -
Page 103: File Output Destinations
18. File Output Destinations This software can save various types of data. The output destinations for the different file types are described below. 18-1. Error Log File Output Destination It may be necessary to send error log files when contacting us. 18-2. -
Page 104: Manual File Output Destination
Do not open numerical data or alarm record csv files while acquiring data with the PC. Opening such files while acquiring data with the PC will result in an error, and will turn the PC interface off-line without updating the numerical data or alarm record. [Numerical data output details] Time/date saved (Time) Time to peak (Time to peak) -
Page 105: Software Condition Setting Precautions
19. Software Condition Setting Precautions 19-1. Maximum Number of Overlay Shots Setting The maximum number of shots that can be overlay-plotted varies depending on the sampling interval, span, and number of channels. Depending on the settings, a malfunction may occur if the PC memory exceeds its capacity. -
Page 106: Software Uninstall Procedure
20. Software Uninstall Procedure 20-1. Uninstalling the Software 1) To uninstall and delete MIP-D-02, open the [Control Panel]. 2) Open [Programs and Features]. 3) Click [MIP-D-02], then click [Uninstall]. - Page 107 4) The uninstall process begins. Wait for the process to complete. Uninstalling is complete once the window above disappears.
-
Page 108: Troubleshooting
21. Troubleshooting Check the corresponding reference details if any of the following problems arise when using the module. If the particular problem is not listed here or if the problem is not remedied by the corrective action suggested, contact us. 21-1. -
Page 109: Measurement Problems
21-2. Measurement Problems Reference Symptom Check points section Is the module power turned on? ― The module switches to offline mode during Is the USB cable connected? ― measurement or when Have numerical data or alarm record csv files saved on Section 18-2. -
Page 110: External Control Input/Output Problems
21-3. External Control Input/Output Problems Symptom Check points Reference section Is it connected correctly? Section 5-2-2. Does the input signal last at least 50 ms? Section 5-2-2. Does the circuit type match the external control Section 5-2-2. device (molding machine)? Is the sensor channel enabled? Section 9-1-2. -
Page 111: Amplifier Error Problems (Error Led Illuminated)
21-5. Amplifier Error Problems (ERROR LED Illuminated) The ERROR LED illuminates if any of the following errors are detected in the amplifier. Check the specific error that has occurred, and take the appropriate corrective action. For details of how to check error details, see "17. -
Page 112: Pc Personalization
21-6. PC Personalization If movement is slow when dragging pressure acquisition lines, horizontal lines, or integral calculation range lines on the data processing screen and real time graph waveform plotting stops, alter the following settings. The instructions here apply to Windows 7. (1) Display the Personalization screen. -
Page 113: Hardware Specifications
22. Hardware Specifications 22-1. Analog Specifications Bridge power supply GV 5 V ±0.25 V, max. 20 mA (per channel) LSMS-S06 series , LSMSB series Applicable transducers * 200K, 500K, 1T, and 3T (2000.0 N or more) are available with ROM Ver.1.200 or later. No. -
Page 114: General Specifications
Vibration resistance 2 hours in each of the directions X/Y/Z External dimensions 120 mm × 60 mm × 35.4 mm (not including protrusions) Weight Approx. 300 g Casing material SUS430 Compatible transducers LSMS-S06 series, LSMSB series Compatible amplifiers MPC-201-25, MPC-201B-25... -
Page 115: Relay Cable
Model MRB-304-BI Operating Temperature 0 °C ~ 100 °C temperature/ Humidity Max. 85 %RH (no condensation) humidity range Storage temperature - 10 °C ~ 100 °C 10 Hz ~ 55 Hz, double amplitude 1.5 mm Vibration resistance 2 hours in each of the directions X/Y/Z External dimensions 98 mm ×... -
Page 116: External Control Input/Output Cable
22-6-4. External control input/output cable Model FA409-477 (2.5 m cable) Operating Temperature 0 °C ~ 50 °C temperature/ Humidity Max. 85 %RH (no condensation) humidity range Storage temperature 0 °C ~ 50 °C Cable external diameter Approx. 7.3 mm Minimum bending radius 44 mm 23. -
Page 117: Appendix
24. Appendix 24-1. Embedding the sensor Minimum Model Minimum bending radius bending radius LSMS-20K-S06 5.0 mm LSMS-50K-S06 5.0 mm Ejector plate (Lower) LSMS-100K-S06 5.0 mm LSMS-200K-S06 5.0 mm LSMS-500K-S06 5.0 mm LSMS-1T-S06 10.0 mm LSMS-3T-S06 16.0 mm 10.0 mm LSMSB-5K Do not bend close to the sensor. -
Page 118: Counterboring The Sensor Embedding Hole
24-2. Counterboring the sensor embedding hole The sensor bears the load on the outer perimeter of its bottom face. Make sure no load acts on the center of the sensor bottom face, as this has no load-bearing strength. Sensor outer dimension Consistent measurements will not be + 0.1 to 0.2 mm obtained as the sensor is not supported on... -
Page 119: Anchoring The Sensor Cable
24-3. Anchoring the sensor cable Use the cable anchoring tube provided with the sensor to anchor the sensor in the hole, and take great care not to damage the cable such as by trapping it when assembling the mold. The tube can be inserted into a 4 mm wide hole. Anchoring tube Slit Ejector plate (Lower) -
Page 120: Opening For The Sensor Cable
24-4. Opening for the sensor cable To avoid damaging sensor cables, chamfer the edges of the wire outlet in the mold. Ejector plate (Upper) Ejector plate (Lower) Sensor cable 24-5. Vertically positioning the ejector plate Positioning pins should be inserted between the upper and lower ejector plates to maintain the ejector pin and sensor axes constant. - Page 122 1-1-1, Katase, Fujisawa-shi, Kanagawa-ken, 251-8531 Japan Tel: +81-466-23-2681 Fax: +81-466-22-7191 Sensing Device Business Unit FUJISAWA PLANT 1-1-1, Katase, Fujisawa-shi, Kanagawa-ken, 251-8531 Japan Tel: +81-466-22-7151 Fax: +81-466-22-1701 KARUIZAWA PLANT 4106-73 Miyota, Miyota-machi, Kitasaku gun, Nagano-ken 389-0293 Japan Tel: +81-267-31-1309 Fax: +81-267-31-1353 HOMEPAGE ADDRESS http://www.minebea-mcd.com...
Need help?
Do you have a question about the MPC-201B-25 and is the answer not in the manual?
Questions and answers