Table of Contents
Advertisement
Quick Links
Advertisement
Table of Contents

Subscribe to Our Youtube Channel
Related Manuals for Sharp EL-9450


Summary of Contents for Sharp EL-9450
- Page 1 ® MODEL EL-9450 GRAPHING CALCULATOR OPERATION MANUAL...
- Page 2 NOTICE • The material in this manual is supplied without representation or warranty of any kind. SHARP assumes no responsibility and shall have no liability of any kind, consequential or otherwise, from the use of this material. • SHARP strongly recommends that separate permanent written records be kept of all important data.
-
Page 3: Table Of Contents
Contents Caring for Your Calculator ....................1 Chapter 1 Getting Started ......................2 Before Use ........................2 Using the Hard Cover ..................... 3 Part Names and Functions ..................... 4 Basic Key Operations ..................... 7 Quick Run-through: Fraction Calculation ............... 8 Chapter 2 Operating the Graphing Calculator ................. - Page 4 Contents 5. Graphing Parametric Equations ................80 6. Tables ........................81 7. Other Convenient Graphing Features ..............83 1. Rapid GRAPH ....................83 2. Rapid WINDOW ....................86 3. Rapid ZOOM ....................88 Chapter 5 SLIDE SHOW Feature ....................89 1. Try it! ........................90 2.
- Page 5 Accessing the OPTION Menu ..................154 1. Adjusting the screen contrast ..............154 2. Checking the memory usage ............... 154 3. Deleting files ....................155 4. Linking to another EL-9450 or PC ............... 156 5. Reset function ....................158 Appendix ........................159 1. Replacing Batteries ....................159 2.
- Page 6 Contents 4. Precedence of Calculations ..................166 5. Error Codes and Error Messages ................ 167 6. Calculation Range ....................169 1. Arithmetic calculation ..................169 2. Function calculation ..................169 7. List of Menu/Sub-menu Items ................173 1. MATH menus ....................173 2.
-
Page 8: Caring For Your Calculator
• Clean with a soft, dry cloth. Do not use solvents. • Do not use a sharp pointed object or exert too much force when pressing keys. • Avoid excessive physical stress. -
Page 9: Chapter 1 Getting Started
Chapter 1 Getting Started Before Use Inserting 1. Open the battery cover batteries - located on the back of the resetting the calculator. Pull down the memory notch, then lift the battery cover up to remove it. 2. Insert the batteries, as indicated. -
Page 10: Using The Hard Cover
Chapter 1: Getting Started Adjusting Since the display contrast may vary with the ambient temperature display contrast and/or remaining battery power, you may want to adjust the contrast accordingly. Here’s how: 1. Press @, then p. 2. Adjust the contrast by using the + and - keys. +: increases the contrast -: decreases the contrast 3. -
Page 11: Part Names And Functions
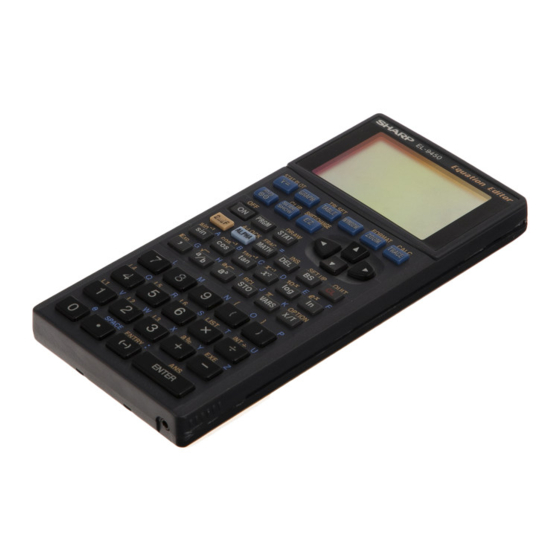
Chapter 1: Getting Started Part Names and Functions EL-9450 1 Display screen 2 Power ON/ 4 Graphing keys OFF key STAT PLOT TBLSET FORMAT CALC CLIP SHIFT CHANGE DRAW 5 Cursor keys A LOCK FRAC SET UP QUI T 3 Key operation... - Page 12 Chapter 1: Getting Started 1 Display screen: Displays up to 96 pixels wide by 64 pixels tall of graphs and texts. 2 Power ON/OFF key: Turns calculator ON. To turn off the calculator, press @, then o. 3 Key operation keys: These keys are used to change the key functions.
- Page 13 Chapter 1: Getting Started Returns calculator to calculation screen. Creates your own slide shows and displays the built-in slide show. Obtains the screen for the slide show. Enters the rapid feature. (See page 83.) Enters the Shift or Change feature. (See page 96.) Basic Operation keys Used when executing calculations or specifying commands.
-
Page 14: Basic Key Operations
Chapter 1: Getting Started Scientific Calculation keys s / c / t / s / c / t: Trigonometric function keys y / l / I / x / 0 / @ / a: Logarithm and exponential functions. b / d: Fraction calculation keys Integer division and remainder calculation keys + / _:... -
Page 15: Quick Run-Through: Fraction Calculation
Chapter 1: Getting Started Quick Run-through: Fraction Calculation Here are the major ingredients for 18 doughnuts: cup warm water cup warm milk cup sugar 4 cups all-purpose flour 2 eggs 3 tablespoons butter Based on these values, solve the following problems using the calculator. Question If you make 60 doughnuts according to the above recipe, how many cups of warm milk are required? - Page 16 Chapter 1: Getting Started 1. Press # to enter the calculation Set up the calculator screen. before 2. Press C to clear the display. calculation 3. Press 3 b 4 '. Enter fractions 4. Press b 18 '. 5. Press E. Now we have found of a cup of warm milk is required per one doughnut, how many cups are required for 60 doughnuts?
- Page 17 Chapter 1: Getting Started You can toggle between decimal values, mixed numbers, and improper fractions using fraction menu. 1. Press @ < 4 E. To a decimal value 2. Press @ < 3 E. To an improper fraction 3. Press @ < 2 E. To a mixed number...
-
Page 18: Operating The Graphing Calculator
Chapter 2 Operating the Graphing Calculator Basic Key Operations LIST SPACE EN TRY COMMUNICATION PORT The standard calculation keys, located at the bottom four rows of the keyboard, enable you to access the basic functions of the calculator. 1. Entering numbers Use the number keys (0 ~ 9), decimal point key (.), and negative number key (_) to enter numbers into the calculator. -
Page 19: Performing Standard Math Calculations
Chapter 2: Operating the Graphing Calculator 2. Enter numbers with the number keys and decimal point key, as follows: 10 . 23456789 @ $ (,) can be used to Note: enter a value in scientific notation. Example × × # C 6.3 @ $ 8 4.9 @ $ 7 The negative number key _ can be used to enter numbers, Entering a... -
Page 20: Cursor Basics
Chapter 2: Operating the Graphing Calculator With the ( and ) keys, parentheses (round brackets) Using parentheses can be added to group sections of expressions. Sections within the parentheses will be calculated first. Parentheses can also be used to close the passings of values in various functions, such as “round(1.2459,2)”. -
Page 21: Editing Entries
Chapter 2: Operating the Graphing Calculator 6. Press E to obtain the answer. Cursor appear- The cursor also displays information regarding the calculator’s ance and input input method. See the following diagram. method Mode Symbol Remarks Normal mode The appearance of the cursor pointer may vary according to the mode or When A is pressed position. - Page 22 Chapter 2: Operating the Graphing Calculator About the Insert When the editing mode is set to one-line, insert mode needs to be manually specified. Press and release @, then i to mode set the insert mode. Press @ i again to return to the overwrite mode.
-
Page 23: Second Function Key
Chapter 2: Operating the Graphing Calculator Second Function Key Use @ to call up the calculator’s extended key functions, math functions and figures. All functions associated with @ are color coded yellow, and are printed above each key. Example Enter “2π” on the screen. 1. -
Page 24: Alpha Key
Chapter 2: Operating the Graphing Calculator ALPHA Key Use A to enter an alphabet character. All 26 alphabet characters from “A” up to “Z”, “ θ ”, “=”, “ : ”, and space can be typed. All functions associated with A are color coded blue, and are printed above each key. -
Page 25: Math Function Keys
Chapter 2: Operating the Graphing Calculator Math Function Keys OPT ION LIST SPACE EN TRY COMMUNICATION PORT Mathematical functions can be called up quickly with the Math Function keys. Math Function keys: Enters a sine function at the cursor Enters an arc sine function at the cursor Enters a cosine function at the cursor Enters an arc cosine function at the cursor Enters a tangent function at the cursor... - Page 26 Chapter 2: Operating the Graphing Calculator Enters “ , ” (a comma) at the cursor Enters a value in scientific notation Enters a fraction. Enters a “root” figure at the cursor Enters an exponent. By itself enters a “root” figure; the cursor will be set at “a”, the depth.
-
Page 27: Math, Stat, And Prgm Menu Keys
Chapter 2: Operating the Graphing Calculator MATH, STAT, and PRGM Menu Keys By using the M, S, and P keys, you can access many menu items for complex calculation tasks. The appendix “List of Menu/Sub-menu Items” shows the contents of each sub-menu item. Example Round the following number beyond the decimal point: 34.567 1. -
Page 28: Setup Menu
Chapter 2: Operating the Graphing Calculator SETUP Menu Use this menu to verify basic configurations, such as to define the calculator’s editing preferences, and scientific and mathematical base units. To check the current configuration of the calculator, press @, Checking the then ;. -
Page 29: Setup Menu Items
Chapter 2: Operating the Graphing Calculator SETUP Menu Items DRG: For trigonometric calculations and coordinate conversions, various angle units can be selected: Angle values to be set in degrees Angle values to be set in radians (default) Grad Angle values to be set in grads FSE: Various decimal formats can be set: FloatPt... - Page 30 Chapter 2: Operating the Graphing Calculator ANSWER: Sets the answer preference to various number formats. Decimal Answers will be given in decimal form (default) Mixed Answers will be given in mixed fractions, whenever appropriate Improp Answers will be given in improper fractions, whenever appropriate EDITOR: Sets the editing style to one of two available formats.
-
Page 31: Error Messages
Chapter 2: Operating the Graphing Calculator SIMPLE: Sets the preference for handling reducible fractions. Auto Fractions will automatically be reduced down (default) Fractions will not be reduced unless @ < Manual 1 (Simp) is used Note: All the procedures in this manual are explained using the default settings unless otherwise specified. -
Page 32: Resetting The Calculator
Chapter 2: Operating the Graphing Calculator Resetting the Calculator Use the reset when a malfunction occurs, to delete all data, or to set all mode values to the default settings. The resetting can be done by either pressing the RESET switch located on the back of the unit, or by selecting the RESET in the OPTION menu. -
Page 33: Selecting The Reset Within The Option Menu
Chapter 2: Operating the Graphing Calculator 2. Selecting the RESET within the OPTION menu 1. Press @, then p. The OPTION menu appears. 2. While in the OPTION menu, press E to select E RESET; the RESET sub-menu items should appear on the right side of the screen. -
Page 34: Manual Calculations
Chapter 3 Manual Calculations In this chapter, we explore calculation features of this calculator, such as fraction to decimal conversion and the quotient-reminder key, trigonometric calculation, as well as basic arithmetic calculations. 1. Try it! 1 The speed of light is known to be 186,282 miles (approximately 300,000 kilometers) per second. - Page 35 Chapter 3: Manual Calculations CONCEPT 1. Enter a math expression, then perform the calculation. 2. Save a number into a store, then recall the value later. PROCEDURE 1. First, press #, then C to clear any screen entries. 2. Type 186282 = 7.5, then press E.
-
Page 36: Try It! 2
Chapter 3: Manual Calculations Try it! 2 The Mendocino Tree, a coast redwood growing in Montgomery Woods State Reserve in California (USA), is known to be the tallest living tree in the world. You are to find out how tall the tree is by using the following factors: •... -
Page 37: Arithmetic Keys
Chapter 3: Manual Calculations 3. Now, let’s work on the actual calculation part. Press the # key to enter the Calculation screen, and press C to clear any screen entries. 4. Press 505.8 | t 36. Press E to execute the calculation. 5. - Page 38 Chapter 3: Manual Calculations Enters an addition sign. Example • Calculate 12 # C 1 2 + 3 4 E Enters a subtraction sign. Example • Subtract 21 from 43. 4 3 - 2 1 E Enters a multiplication sign. Example •...
-
Page 39: Calculations Using Various Function Keys
Chapter 3: Manual Calculations Entering a number with a negative value Sets a negative value. Example × • Calculate _ 1 2 | 4 E Do not use the - key to enter a negative value; use the Note: _ key instead. Enters an open parenthesis. - Page 40 Chapter 3: Manual Calculations Enters a cosine function to be used in a trigonometric calculation. Example • Calculate cosine π/3. c @ $ b 3 E Enters a tangent function to be used in a trigonometric calcula- tion. Example • Calculate tangent π/4. t @ $ b 4 E Squares the preceding number.
- Page 41 Chapter 3: Manual Calculations Enters a fraction, setting the preceding number as its numerator. Example Before proceeding, go to the SETUP Note: menu and make sure that the AN- SWER mode is set to Mixed. • Calculate 2 b 5 ' + b 3 ' 4 ' E * If the calculator is set to one-line mode, then “...
- Page 42 Chapter 3: Manual Calculations Accesses the VARS menu. Refer to chapters 9 to learn how to use each item in this menu. Enters a variable “X” (rectangular) and “T” (parametric). Use this key when working with graph equations. Refer to Chapter 4 to learn how to use this feature.
- Page 43 Chapter 3: Manual Calculations Enters “x ”, and returns an inverse by raising a value to the power of negative one. The inverse of “5”, for example, is “ ”. Example • Raise 12 to the power of negative one. 1 2 @ x E When no base number is entered, “x ”...
- Page 44 Chapter 3: Manual Calculations Enters “ ”. Example • Bring 4 to the 5 root. 5 @ _ 4 E When no depth of power is entered, Note: “ ” is entered, with both number areas left blank. C @ _ 5 ' 4 E Recalls a stored number.
- Page 45 Chapter 3: Manual Calculations Recalls the previous answer. Use this key to incorporate the answer to the previous calculation into an expression. Example × • Perform 3 3 | 3 E Subtract the value of the previous answer from “10”. 1 0 - @ b E b can be considered as a variable;...
- Page 46 Chapter 3: Manual Calculations Performs an integer division, and returns a quotient and a remainder. Example • Get a quotient and a remainder from ÷ 50 @ i 3 E * Quotient value is set to Ans memory and remainder is not stored. Enters a mixed number.
- Page 47 Chapter 3: Manual Calculations 1. Press @ ;. To set the 2. Press H 2. manual simplifi- cation. The answer of division will not simplify automatically. Use Simp feature of FRAC menu to simplify the fraction. 1. Press @ ;. To set a fraction calculation 2.
- Page 48 Chapter 3: Manual Calculations Specifying a common factor Simplify the fraction using the specified common factor. Example 1 b 12 ' + 5 b 12 @ < 1 6 E (Manually specify 6, the Greatest Common Factor of 12 and 6, to simplify the fraction.) Note: •...
-
Page 49: Calculations Using Math Menu Items
Chapter 3: Manual Calculations 4. Calculations Using MATH Menu Items The MATH menu contains functions used for more elaborate math concepts, such as logarithms, probability, and math unit conversions. The MATH menu items may be incorporated into your expressions. The CALC sub-menu contains items to be used in calculations A CALC such as logarithmic and integral functions. - Page 50 Chapter 3: Manual Calculations 5 d/dx( d/dx( equation, value of x [, tolerance] ) Returns derivative of equation Y at the specified X value using the tolerance (if not specified, default value is 1E–5). Example M A 5 z y - 5 , 2 , 0 .
- Page 51 Chapter 3: Manual Calculations Use the NUM sub-menu items when converting between various B NUM number systems. 1 abs( abs( value ) Returns an absolute value. * A real number, a list, variable, or equation can be used as values. Example •...
- Page 52 Chapter 3: Manual Calculations 4 fpart fpart value Returns only the fraction part of a decimal number. * A real number, a list, variable, or equation can be used as values. Example • Discard the integer part of 32.01. M B 4 3 2 . 0 int value 5 int Rounds down a decimal...
- Page 53 Chapter 3: Manual Calculations 8 lcm( lcm( natural number, natural number ) Returns the least common multiple of two integers. Example • Find the least common multiple of 12 and 18. M B 8 1 2 , 1 8 ) E 9 gcd( gcd( natural number, natural number )
- Page 54 Chapter 3: Manual Calculations The random functions (random) will generate different Note: numbers every time when the display is redrawn. Therefore, the table values of the random functions will be different every time. When in case of random-based graphing calculations, the tracing values and other parameters of the graph will not match the graph's visual representation.
- Page 55 Chapter 3: Manual Calculations D CONV CONV sub-menu items are to be used when converting a number in decimal form (degrees) to a number in sexagesimal form (degrees, minutes, seconds), or vice versa, and rectangular/polar coordinate conversion. The “base 60” sexagesimal system, as well as the minutes- Sexagesimal second measurement system, was invented by the Sumerians, and Degree...
- Page 56 Chapter 3: Manual Calculations Rectangular/ This calculator is equipped with rectangular coordinates and polar coordinates conversion capabilities. polar coordinate conversion θ Rectangular to polar coordinate conversion functions , θ = tan Conversion formulas: r = (x (y/x) 3 xy→r( xy→r( x coordinate, y coordinate ) Returns polar coordinate radius value from X-Y rectangular coordinates.
- Page 57 Chapter 3: Manual Calculations rθ→y( r coordinate, θ coordinate ) 6 rθ→y( Returns rectangular coordinate Y value from r-θ polar coordinates. Use the E ANGLE menu to enter a degree, radian and grad value E ANGLE without changing settings. 1 ° Inserts a degree, and sets the preceding value in degrees.
- Page 58 Chapter 3: Manual Calculations F INEQ Use the equality/inequality figures to compare two values. These sub-item tools return 1 (true) or 0 (false). Tests whether a preceding value and a following value are equal. Tests whether a preceding value and a following value are not equal.
- Page 59 Chapter 3: Manual Calculations 1 and value A and value B Enters an “AND” logic figure. Example 5 AND 6 # C 5 M G 1 6 E 5 (decimals) is converted to 101(binary) and 6 to 110. AND will compare the two numbers digit by digit and returns the answer 100 (4).
- Page 60 Chapter 3: Manual Calculations 4 xor value A xor value B Enters an Exclusive-OR (xor) logic figure. Example 12 XOR 6 # C 12 M G 4 6 E 12 (decimals) is converted to 1100 (binary) and 6 to 0110. XOR will compare the two numbers digit by digit and returns the answer 1010 (10).
-
Page 61: Chapter 4 Graphing Features
Chapter 4 Graphing Features In this chapter, the graphing features of the calculator are described. It should be noted that the following examples assume that the angle mode is set Rad (radian), the default angle unit of the calculator. If set to degree or grad, some unexpected results will be obtained. - Page 62 Chapter 4: Graphing Features CONCEPT 1. By using two linear graphs, the approximate crossing point can be found. 2. The exact crossing point can be found with the TABLE function. PROCEDURE 1. Setting to the rectangular coordi- nate graph mode. Press @ ;...
- Page 63 Chapter 4: Graphing Features 7. At the second line, press C to clear any entries, then enter “3.5 1.2X” to represent the Orange Cab’s fare system. When done entering the equation, press E. The two equations are now ready to graph. 8.
-
Page 64: Graph Modes
Chapter 4: Graphing Features 2. Graph Modes • This calculator has two graph modes, rectangular coordinate graph and parametric coordinate graph. • To select the mode, press @ ; to enter the SETUP mode. To set the rectangular coordinate graph mode. (default) 1. - Page 65 Chapter 4: Graphing Features Displays the graph values in a table. The default sample incre- ment value of the graph’s X axis is “1”. Displays the ZOOM menu. Within the ZOOM menu, various preferences can be set for the graph appearance on zooming in/ out .
- Page 66 Chapter 4: Graphing Features 3 In A zoomed-in view of the graph will be displayed, sized according to the B FACTOR set up under the ZOOM menu. For example, if the vertical and horizontal zoom factors are set to “2”, then the graph will be magnified two times.
- Page 67 Chapter 4: Graphing Features 3. Pressing E after entering a value will switch the cursor position to “Y_Fact=”. Enter the required zooming factor, and press E. 4. To go back to the ZOOM menu, press the Z key. C POWER Use this zooming tool when the equation contains a form of “...
- Page 68 Chapter 4: Graphing Features 6 tan –1 Use this when the equation contains an arc tangent function. Under this menu item there is one tool that enables the storing of F STO graph window settings. 1 StoWin By selecting this sub-menu item, the current graph window setup will be stored.
- Page 69 Chapter 4: Graphing Features Press this button to trace the graph drawn on the screen, to obtain the X-Y coordinates: 1. While the graph is displayed, press the U key. The cursor appears, flashing on the graph line, with the present X-Y coordinates.
- Page 70 Chapter 4: Graphing Features Parametric coordinate system Minimum and maximum Tmin/Tmax values for T, respectively Cursor pointer step value for Tstep tracing Others Same as rectangular coordinate system Example The setup values — the minimum/maximum X/Y values, and X/Y- axis scale — can be changed manually: 1.
- Page 71 Chapter 4: Graphing Features Calculations can be performed on the entered graph equation(s). Press @ k to access. The following 7 sub-menu tools are available: With this sub-menu tool, the Y value can be obtained 1 Value by entering an X value. The flashing graph cursor will then be placed in that position on the graph.
- Page 72 Chapter 4: Graphing Features 4 Maximum Finds the maximum of the given graph, and places the flashing cursor at that position. If the given graph has no Note: maximum value, an error message will be displayed. Finds an X-intercept (a crossing point of the graph on 5 X_Incpt the X-axis) of the given graph, and places the flashing cursor at that position.
-
Page 73: The Draw Function
Chapter 4: Graphing Features 4. The DRAW Function With the DRAW function, lines, circles, graphs, and pixel points can be added to the graph window. The DRAW menu also contains configuration tools for the ordinary graphs entered in the Graph Equation Entry window: line types, shading, and visibility status of each graph. - Page 74 Chapter 4: Graphing Features 2 Line( Draws a line according to the given X-Y coordinates of a start/end point. This tool can be used with any type of graph. Note: From the Calculation Line( x-coordinate of start point, y-coordinate of screen start point, x-coordinate of end point, y-coordinate of end point [,0] )
- Page 75 Chapter 4: Graphing Features 2. Press A to select A DRAW, then press 2 to select 2 Line(. The GRAPH window reappears, with the coordinate of the cursor showing at the bottom of the screen. 3. Move the flashing cursor on the screen to set the starting point of the line.
- Page 76 Chapter 4: Graphing Features 3 H_line Draws a horizontal line on the graph window. From the Calculation H_Line y-value screen Draws a horizontal line ( y = value ) on the graph window. Example • Draw a horizontal line of y = 5. 1.
- Page 77 Chapter 4: Graphing Features From the GRAPH V_Line window Example • Draw a vertical line manually. 1. Press @ d A 4. 2. Use the cursor navigation keys ({ } ; ') to move the flashing cursor to the appropri- ate position.
- Page 78 Chapter 4: Graphing Features Draw equation 6 Draw Draws an additional graph based on a given expres- sion. Example • Draw the graph of y = 3x -4x+2. 1. Select Draw. – 2. Enter “3x 2” on the line. 3. Press E. This tool can be used with Note: rectangular coordinate graphs only.
- Page 79 Chapter 4: Graphing Features DrawInv equation 8 DrawInv Draws an inverse of a given graph expression. Example • Draw the inverse graph of y = – 8. 1. Select DrawInv. – 2. Enter “ 8” on the line. 3. Press E. Note: It is also possible to specify a function if stored in Y0 to Y9.
- Page 80 Chapter 4: Graphing Features 0 Text( Text( column, row, “ strings ”) Enters a text string at a given coordinate. Example • Draw “HELLO” on the graph at column 2, row 1. Text(2, 1, “HELLO”) Use M E 3 to Note: enter “”(double quotes).
- Page 81 Chapter 4: Graphing Features PntON( x-coordinate, y-coordinate ) 1 PntON( Draws a point at a given coordinate. It takes the X-Y coordinate as an argument. This tool can either be accessed from the GRAPH window or other windows. Entering from the GRAPH window enables a graphic entry, while entering from other windows enables text-based entry.
- Page 82 Chapter 4: Graphing Features 7 PxlTST( PxlTST( column, row ) Returns “1” if a pixel point is present at a given screen location indicated by column and row. Returns "0" if no pixel point exists. C ON/OFF Sets the visibility status of a given graph number (0-9). DrawON [ equation number 1 , ..] or DrawON 1 DrawON Sets the specified graphs visible.
- Page 83 Chapter 4: Graphing Features D LINE Sets the line appearance of each graph. Each graph coordinate mode can retain a set of line appearance preferences. Solid line, dotted line, bold line, locus and dots can be selected. 1. Press @ d D to select D LINE, then press 2.
- Page 84 Chapter 4: Graphing Features Attempting to call back Note: graph data from an empty location will result in an error. Stores and recalls the displayed pixel data for the graph window. F PICT The graph equations will not be saved or recalled with these tools.
- Page 85 Chapter 4: Graphing Features G SHADE With these sub-menu tools, inequalities, intersections and compliments of multiple graphs can be visualized. Sets up the shading area for each graph. 1 SET Initializes the shading setup, and brings up the shading 2 INITIAL setup window.
- Page 86 Chapter 4: Graphing Features The graph appearance can be set and verified under this menu. Press @ f to access. Displays the current FORMAT settings. The default A – – – – – – setting is: (for the graph equation to be displayed on the graph) (for displaying numeric derivatives on the graph)
-
Page 87: Graphing Parametric Equations
Chapter 4: Graphing Features 5. Graphing Parametric Equations A two-dimensional parametric equation assumes that both X and Y are represented by functions in a third variable T. When set in parametric graphing mode, the calculator automatically sets up the Graph Equation Entry screen to take one set of X and Y per each graph, with the equation’s right side variable to be set as “T”. -
Page 88: Tables
Chapter 4: Graphing Features 6. Tables The calculator enables you to illustrate the changes using the equation and graph you have input. It also has tables for showing a list of X and Y values. Each column item can display up to 7 digits, including a sign and/or a decimal point. There are two kinds of tables available corresponding to the coordinate system. - Page 89 Chapter 4: Graphing Features Setting a table • Table setting allows you set how to input data for a table. • Press @ y to enter the table setting screen. • The cursor is initially located at Auto, showing the variable input method. Automatically creates a table based on the graph equations and Auto: given TableStart and TableStep values.
-
Page 90: Other Convenient Graphing Features
Chapter 4: Graphing Features 2. Press T. Blank table will appear. 3. Press 2 E _ 3 E to enter X values. * An automatically created table in the User mode cannot be scrolled vertically. While the table is in the User mode, a selected row can be Note: deleted by pressing D. - Page 91 Chapter 4: Graphing Features Main menus Sub menus Pre-installed Equations 1) Y=X 2) Y=3X A) Y=AX 3) Y=(1/2)X 4) Y=-2 X 1) Y=X 2) Y=2X –1 B) Y=AX 3) Y=-X 4) Y=-2X –1 1) Y=2(X–1) 2) Y=-2(X+1) C) Y=A(X–H) 3) Y=(X+2) –1 4) Y=-(X+2) –1...
- Page 92 Chapter 4: Graphing Features Example π) Enter “Y = 2sin( 2” for Y1 of the graph equation screen. 1. Press Y to open the graph equation screen and place the cursor at Y1. 2. Press f. The equation classification menu will appear.
-
Page 93: Rapid Window
Chapter 4: Graphing Features 6. Press G to draw the selected graph. No graphing range is determined for the equation selected from the rapid graphing feature. the graph is drawn based on the current window settings. 7. Press @ q to return to the calculation screen. 2. - Page 94 Chapter 4: Graphing Features The X-Window selection screen will appear. The settings displayed on the top line (followed by C:) indicates the current settings. The } mark on the upper right corner indicates that the other settings than displayed on the screen are pre-installed. Use { } to scroll the screen to show the other settings.
-
Page 95: Rapid Zoom
Chapter 4: Graphing Features 3. Rapid ZOOM The Rapid ZOOM feature allows you to easily enlarge or reduce the graph size or change the graph locations while seeing the results. Press f from the graph screen. Example Display all the displacement points of the graph, which cannot be currently seen on the screen. -
Page 96: Chapter 5 Slide Show Feature
The SLIDE SHOW feature is especially incorporated to help students understand math concepts utilizing the calculator’s graphing capabilities. The SLIDE SHOW feature is designed to be used with SHARP’s optional overhead projection system, which offers a hassle-free math presentation environment for the entire class. -
Page 97: Try It
Chapter 5: SLIDE SHOW Feature 1. Try it! Make a SLIDE SHOW named “CNSCTV N” to tell how to use the calculator to find the two consecutive numbers whose product is 6006 under the following concept. • Consecutive numbers are only one apart and can be considered to be roughly the same number. - Page 98 Chapter 5: SLIDE SHOW Feature 5. Press @ n. The message “STORE SCREEN: 01” will appear. The image will be stored on page 1 of the SLIDE SHOW “CNSCTV N”, and the screen will automatically return to the previous screen. 6.
-
Page 99: Built-In Slide Show
Chapter 5: SLIDE SHOW Feature Playing back the original SLIDE SHOW 1. Press ] to go to the SLIDE SHOW menu. Press B to select B ORG. The saved SLIDE SHOW name will be shown. 2. Press E. The first page of the SLIDE SHOW will appear. - Page 100 Chapter 5: SLIDE SHOW Feature 3. Move the cursor to select 2 Y = AX B and press E. The graph and X-Y table of Y1 = 2X 1 are displayed on the first screen. The two-digit number on the upper right corner of the display shows the current screen number.
-
Page 101: Creating An Original Slide Show
Chapter 5: SLIDE SHOW Feature 3. Creating an Original Slide Show You can create and registered one self-made slide show in the calculator. 1. Press ] C (C NEW) and press E. To create an original slide 2. Input the appropriate title and press show E. -
Page 102: Editing The Original Slide Show
Chapter 5: SLIDE SHOW Feature 5. Editing the Original Slide Show The registered slide show data can be sorted and deleted, and the title can be renamed in the edit mode. 1. Changing the order of the screens (MOVE) This sub-menu tool moves the selected screen image to change the playback order. 1. -
Page 103: Shift/Change Features
Chapter 6 SHIFT/CHANGE Features The calculator is equipped with SHIFT and CHANGE features. SHIFT Feature: Automatically shifts the graph without changing its shape. CHANGE Feature: Automatically changes the graph shape without changing its location. • Eight major graphs are built into the calculator for the SHIFT feature and six graphs for the CHANGE feature. - Page 104 Chapter 6: SHIFT/CHANGE Features 2. Press A 1 to select 1 Y = Entering the in the SHIFT feature. SHIFT feature and select the The graph of Y = X will appear on function. the left window. The corresponding function will be displayed on upper half of the right window.
- Page 105 Chapter 6: SHIFT/CHANGE Features 7. Press 1 to select 1 Y = X the CHANGE feature. The graph of Y = X will appear on the left window. The corresponding function will be displayed on upper half of the right window. The lower half shows the registered function during operation.
-
Page 106: Shift Feature
Chapter 6: SHIFT/CHANGE Features 2. SHIFT Feature The graph can be shifted in the specified increments within the specified range described in the following table. No. Equation Shift step Shift range X : 1 X=–3 to 3 Y : 1 Y=–2 to 3 X : 1 X=–2 to 4... - Page 107 Chapter 6: SHIFT/CHANGE Features The equation of the graph before shift (Solid line graph) Registered equation The directions the (The first equation, “Y = X ”, is graph can be shifted automatically registered.) (When all the four arrows are shown, the graph can be shifted for four directions.) 3.
- Page 108 Chapter 6: SHIFT/CHANGE Features 5. Press ' ' to shift the graph to the right in two increments (for the X direction). The upper right portion of the screen will change as shown on the right, and only the “Y = X 1”...
- Page 109 Chapter 6: SHIFT/CHANGE Features 10. Press E to register the equa- – tion (graph) of “Y = (X ”. • As described above the SHIFT feature can show how the equation changes according to the graph shift. 11. Press A ' to enter the Draw graphs graph regeneration screen.
- Page 110 Chapter 6: SHIFT/CHANGE Features 14. Press A ; to return to the shift screen shown on the right. – Note: In the above example, since the graph for “Y = (X ” has been – selected (3: (X ), that equation becomes a base equation immediately after returning to the graph shift screen.
-
Page 111: Change Feature
Chapter 6: SHIFT/CHANGE Features 3. CHANGE Feature The CHANGE feature shows the relationship between the graph and equation by changing the shape of the graph. Using this function, you may view changes such as “Y = 2X ” and “Y = 3X ”... - Page 112 Chapter 6: SHIFT/CHANGE Features Example Change the graph “Y = X ” using the CHANGE feature. 1. Press @ ] B 1. Set the change mode to “Y = The screen shown to the right will ”. appear. The cursor icon “ ”...
- Page 113 Chapter 6: SHIFT/CHANGE Features 5. Press {. The graph for “Y = 2X ” is changed as shown on the right. 6. Press E. In the same manner as described in the SHIFT feature, the previous graph is displayed by the dotted line and the newly changed graph is displayed by the solid line.
-
Page 114: Chapter 7 List Features
Chapter 7 List Features The list features can be used in equations and calculations. 1. Try it! By analyzing years of data, we found that it takes the driver of a car approximately 0.75 seconds to react to a situation before actually applying the brakes. - Page 115 Chapter 7: List Features 4. Press R @ 1. Store the list in 5. Press E to store the list in L1. 6. Press 1.1 | @ 1 Enter the + 0.06 | @ 1 equation using 7. Press E. 8.
-
Page 116: Creating A List
Chapter 7: List Features 2. Creating a list A list is a series of values enclosed by braces, and is treated as a single value in calculations or equations. The calculator has 6 storage areas for lists from L1 to L6. You can edit or access lists by pressing @ 1 to 6 (numeric keys from 1 to 6). - Page 117 Chapter 7: List Features 1. Press 10 | @ 1 R × Calculate 10 @ 3 E. L1 and store the results in L3 2. Press s @ 3 E. Calculate the sine of L3 “...” shows that results extend beyond the display to the right.
-
Page 118: Special List Operations
Chapter 7: List Features 4. Special List Operations This calculator has three list calculation menus: OPE, MATH and L_DATA. Press @ l to access list calculation menus. Calculations using the OPE menu functions 1 sortA( sortA( list name ) Sorts lists in ascending order. Example •... - Page 119 Chapter 7: List Features 3 dim( dim( list ) Returns the number of items (dimen- sion) in the list. Example • Display the dimension of list L1. natural number ⇒ dim( list name ) Set the number of items (dimension) of specified list to the specified number.
- Page 120 Chapter 7: List Features 5 seq( seq( equation , start value , end value[ , increments] ) target list name Makes a list using the specified equation, range (start value and end value) and increments. Example • Fill the list using the equation y = x –...
-
Page 121: Calculations Using Math Menus
Chapter 7: List Features augment( list 1 , list 2 ) 8 aug…( Returns a list appending the specified lists. Example • Obtain the list appending L1 ({4, 2, 7}) and L2 ({ 4}). Calculations using MATH Menus During the following explanations, the values of lists, L1 and L2 will be assumed to be: L1 = {2, 8, L2 = { 1 min(... - Page 122 Chapter 7: List Features 3 mean( mean( list [, frequency list] ) Returns the mean value of items in the specified list. Example • Calculate the mean value of list L1. 4 median( median( list [, frequency list] ) Returns the median value of items in the specified list. Example •...
-
Page 123: Drawing Multiple Graphs Using The List Function
Chapter 7: List Features 7 stdDv( stdDv( list [, frequency list] ) Returns the standard deviation of the specified list items. Example • Calculate the standard deviation using the list items of list L2. varian( list [, frequency list] ) 8 varian( Returns the variance of the specified list items. -
Page 124: Using L_Data Functions
Chapter 7: List Features 3. Press G. Two graphs are drawn as shown on the right. In this case, the first one represents the equation y = 3x 2 and the second y = You can also use L1 to L6 to enter the equation; 1. -
Page 125: Using List Table To Enter Or Edit Lists
Chapter 7: List Features 2 RclLD RclLD natural number (0-9) Recall the stored group of lists for use. Any current list data (not stored in L_DATA) is overwritten. Example 1. Press @ l and select C 2. 2. Enter the number to recall and press E. -
Page 126: How To Edit The List
Chapter 7: List Features How to edit the list 1. Press S and select A EDIT, then press E. 2. Use the cursor keys to move the cursor to the target cell. 3. Enter the new value and press E. The new value will be stored in the target cell. -
Page 127: Statistics & Regression Calculations
Chapter 8 Statistics & Regression Calculations The following statistical and regression features are available: • Statistical calculations such as means and standard deviations • Graphing statistical data • Plotting regression curves • Obtaining coefficients from regressions 1. Try it! The following table shows the access counts (per hour) of a certain web site from Sunday midnight to Monday midnight. - Page 128 Chapter 8: Statistics & Regression Calculations Entering hours 3. Input 1 for hour. (index value) 4. 1 will be displayed at the bottom line of the display. 5. Press E to input the index value. 6. Continue the procedure to input 2 to 24. 7.
- Page 129 Chapter 8: Statistics & Regression Calculations Setting the 3. The first line shows if the graph graph drawing drawing is on or off. Initially, the “on” graph drawing is off. With the cursor pointer at the “on” position, press E to set the graph drawing on. 4.
- Page 130 Chapter 8: Statistics & Regression Calculations 15. Select 9 Stat and press E. You can directly press 9 at step 14 to select 9 Stat. The histogram will appear on the display. When you draw the graph using the automatic statistics zoom function (9 Stat), the division number is automatically set to –...
-
Page 131: Statistics Features
Chapter 8: Statistics & Regression Calculations 8. Move the cursor to GRAPH and press @ [. 9. Press B 2 (broken line with cross points). 10. Press G. Now you can compare the differ- ence in web site access counts between Sunday and Monday. -
Page 132: Statistical Evaluations Available Under The C Calc Menu
Chapter 8: Statistics & Regression Calculations 2. Statistical evaluations available under the C CALC menu 1_Stats 1-variable (x) statistical a calculations Mean of sample (x) Standard deviation of sample (x) – Σx sx = – Population standard deviation of sample (x) σx –... - Page 133 Chapter 8: Statistics & Regression Calculations The web site access counts example on page 120 will be used again to demonstrate the calculation of statistical values. Hours 01 02 03 04 05 06 07 08 09 10 11 12 13 14 15 16 17 18 19 20 21 22 23 24 Sunday 98 72 55 3 6 24 15 30 59 72 55 43 21 10 150 151 135 108 204 253 232 251 75 30 Monday 32 8 12 2 4 19 32 72 95 91 123 201 184 108 95 72 45 38 75 111 153 90 84 35 * If you did not previously enter the above values in the list table, press S and...
-
Page 134: Graphing The Statistical Data
Chapter 8: Statistics & Regression Calculations Calculating the previous two-variable statistical values can be performed in a single operation. Use a “ , ” (comma) to separate the two variables. 1. Press # C and S to display the statistics menu. 2. -
Page 135: Graph Types
Chapter 8: Statistics & Regression Calculations 1. Graph Types Histogram A bar graph of sample (x) (HIST) The width of the bars is set by the Xscl*. The Y-axis shows the frequency. * The Xscl can be changed to between 1 and 64. - Page 136 Chapter 8: Statistics & Regression Calculations Normal A normal distribution curve of sample(x) distribution plot The x-axis is in the range of Xmin to (N.D.) Xmax. Box plot A box plot graph of sample (x) (Box) A. The minimum value (xmin) of the sample (x) B.
- Page 137 Chapter 8: Statistics & Regression Calculations Pie chart Pie graph of sample (x) (PIE) • Maximum number of division is 8. • Calculation range: 0 ≤ x < 10 • Data can be displayed in two modes: • Value display: 7 digits •...
-
Page 138: Specifying Statistical Graph And Graph Functions
Chapter 8: Statistics & Regression Calculations 2. Specifying statistical graph and graph functions • Up to three graphs can be plotted per sample data. 1. Press @ [. Specifying type of statistics 2. Select from A PLOT1, B PLOT2 or C PLOT3 and press E graphing to set the statistical graphing specifications. -
Page 139: Statistical Plotting On/Off Function
Chapter 8: Statistics & Regression Calculations 3. Statistical plotting on/off function • You can set the statistical plotting of PLOT 1 to 3 at once. 1. Press @ [. 2. Press E. 3. • To set the all plotting ON: Press 1 (1 PlotON). •... -
Page 140: Data List Operations
Chapter 8: Statistics & Regression Calculations 4. Data list operations Descending sort, ascending sort, changing the list order and deleting the lists can be done in the Operation menu. Press S B OPE to access the data list operations. sortA( list ) 1 sortA( Sorts the list in ascending order. -
Page 141: Regression Calculations
Chapter 8: Statistics & Regression Calculations 5. Regression Calculations 1. Press S D (D REG). Accessing the regression menu The Regression menu is displayed. Med_Med (list name for x, list name for y [, frequency list] [, 01 MedMed equation name to store]) Finds the regression line using the median-median method. - Page 142 Chapter 8: Statistics & Regression Calculations 06 log Rg_log (list name for x, list name for y [, frequency list] [, equation name to store]) Finds the regression curve using the common logarithm. (com- mon logarithm regression) Formula: y = a b log x Parameters: a, b, r, r 07 ab...
- Page 143 Chapter 8: Statistics & Regression Calculations 11 x’ value or list x’ Finds the estimated value of x for a given value of y by applying the function determined by the regression. Example When the following is entered as statistical data: Find estimated value of x given y = 140.
- Page 144 Chapter 8: Statistics & Regression Calculations Note: When selecting a regression equation from 02 to 10 and calling to screen, “Rg” is automatically added to the equation to indicate a regression equation. For example “Rg_ax+b” will be displayed when selecting “02 ax+b”. The following table shows the relationship between the time and Using the temperature of water, when heating a beaker filled with water.
- Page 145 Chapter 8: Statistics & Regression Calculations 1. Press # C S D 0 4 (04 x Drawing a 2. Press ( @ 1 , @ 2 , z regression curve using A E A 1 ). quadratic If you enter Y1 as the last variable, the obtained formula will regression automatically be set to the formula Y1.
-
Page 146: Programming Features
Chapter 9 Programming Features The calculator has programming features that enable automatic processing of a series of calculations any number of times. Almost all the calculation and graphing language can be used in programs as well as the control flow statements such as If, Gosub Return and Goto (with Label). While programming, editing mode is set to one-line mode, regardless of the SETUP settings. - Page 147 Chapter 9: Programming Features 4. Press E. 5. The cursor will move to the program input field just under the title. 6. Press P. Starting pro- gramming The program menu will open. The commands and other state- ments are pre-installed in the calculator.
-
Page 148: Programming Hints
Chapter 9: Programming Features 14. Press P A. Execute the program A list of stored programs will appear. 15. Press 0 1 to execute the program 01 “HELLO”. 2. Programming Hints Press P B and then the appropriate numbers to open Editing the program the stored program. -
Page 149: Variables
Chapter 9: Programming Features Press @ p and use C DEL. (See Chapter 10 OPTION Deleting an entire program Menu, page 155). Press P H in the program edit mode. (See page 148 for Copying a line to another details) location Press { to move the cursor to the program name field. -
Page 150: Operands
Chapter 9: Programming Features 4. Operands • Almost all the calculation operands can be used in a program. – ÷ × • Input an operand directly from the keys ( , sin, cos, log and others) or using MATH, STAT, LIST and other menus. Comparison operands •... - Page 151 Chapter 9: Programming Features Input variable 3 Input Enables the user to input a value (list, etc.) for the specified variable during execution. A message “variable = ?” will appear on the screen while the calculator waits for data input. 4 Wait Wait [ natural number (1 to 255)] Interrupts execution for the (natural...
-
Page 152: B Brnch Menu
Chapter 9: Programming Features B BRNCH menu P B See 6. Flow control tools on page 147. C SCRN menu P C C SCRN menu commands are used to display or clear the screen. 1 ClrT ClrT Clears the program text screen without affecting the plotted graph. -
Page 153: E Coord Menu
Chapter 9: Programming Features E COORD menu P E E COORD menu commands are used to set the settings used in graphing. 1 Rect Rect Sets the graph coordinates as X and Y coordinates. 2 Param Param Sets the graph coordinates as parametric coordinates. F FORM menu P F F FORM menu commands are used to set the graph format. -
Page 154: G S_Plot Menu
Chapter 9: Programming Features G S_PLOT menu P G S_PLOT menu commands are used for statistics plotting. 1 Plt 1( Sets the statistical graph settings for plot 1. 2 Plt 2( Sets the statistical graph settings for plot 2. 3 Plt 3( Sets the statistical graph settings for plot 3. -
Page 155: Other Menus Convenient For Programming
Chapter 9: Programming Features 3 If If conditional statements Goto label name Only the Goto command can be used in combination with If clause. Gosub label name 4 Gosub 5 Return ..... [Rem start of the subroutine (label name) ] Label label name Statements Return... -
Page 156: Vars Menu
Chapter 9: Programming Features VARS menu • Functions that control the graph screen can be selected from the VARS menu. • Press z to display the VARS menu (shown to the right). A EQVARS Specifies the graph equation (Y1 to Y9, and Y0, X1T•Y1T to X6T•Y6T). - Page 157 Chapter 9: Programming Features Example Zm_Auto, Zm_x , Zm_sin, etc. • Always enter the argument for functions requiring an argument at the end of the command, such as the CALC function (@ k). An error will be returned for commands not accompa- nied by an argument.
-
Page 158: Debugging
Chapter 9: Programming Features Example The following data are included in list L1. L1: 165, 182.5, 173.8, 166.5, 185.3 A one-variable calculation was executed based on this data. After returning to the calculation screen, average values can be viewed by using the following procedure. •... -
Page 159: Sample Programs
Chapter 9: Programming Features Execution can be interrupted by pressing O. When an infinite loop occurs Use this command if the program enters an infinite loop. Press ; or ' to display the program source with the cursor on the line where interrupted. * Refer to Appendix “Error Codes and Error Messages”... - Page 160 Chapter 9: Programming Features HIST * Creates a histogram based on the entered data. 10 ⇒ dim(L1) Gosub INSCORE Gosub AVGSCORE Plt1(Hist, L1) Zm_Stat Wait Sequentially Label INSCORE input the data in 1 ⇒ I list L1. Print “ENTER SCORE Input A A ⇒...
-
Page 161: Chapter 10 Option Menu
Chapter 10 OPTION Menu The calculator is equipped with OPTION menu for adjusting the display contrast, checking memory usage, deleting stored data, transferring data, and resetting the calculator’s memory. Accessing the OPTION Menu Press @ p. The OPTION Menu will appear. A: Adjusts the display contrast B: Checks the memory usage C: Deletes files... -
Page 162: Deleting Files
Chapter 10: OPTION Menu 3. If you want check the details, press The detailed memory usage window will appear. The total remaining memory will appear on the bottom line of the screen. 4. Press } to scroll the window. List: The amount of memory (bytes) used by lists GraphEq: The amount of memory (bytes) used by graph equations... -
Page 163: Linking To Another El-9450 Or Pc
4. Linking to another EL-9450 or PC Using the optional CE-450L or CE-LK1P, the EL-9450 can be linked to another EL- 9450 or PC, respectively. To transfer data, press @ p D to open the Link option window. Press 1 to send data and press 2 to receive data. - Page 164 Chapter 10: OPTION Menu A SELECT Displays the menu window to send the data specified as follows: 1 ALL Displays a list of all the stored files category by category. 2 List Displays a list of all the stored list files. 3 GraphEq Displays a list of all the stored graph equations.
-
Page 165: Reset Function
Chapter 10: OPTION Menu 3. Press 1. A list of all the data stored will be are displayed and the cursor positioned on the top line. • You can also select 2 List for “L1” and “L2”, and 3 Graph Eqn for “Y2”, for example, and send the data category by category. -
Page 166: Appendix
Appendix 1. Replacing Batteries The calculator uses two different kinds of batteries: manganese (AAA) for unit operation, and lithium (CR2032) for memory backup. Compatible battery types Type (use) Model Quantity Manganese battery (for unit operation) Lithium battery CR2032 (for memory backup) * To prevent loss of stored data, DO NOT remove both the unit operation and memory backup batteries at the same time. - Page 167 Appendix Procedures for When battery power becomes low, a message will show indicating that a replacing unit new set of batteries are needed. operation batteries 1. Turn off the calculator’s power (@ o). 2. Turn over the calculator. Locate the battery compart- ment cover, and open the cover as illustrated.
- Page 168 Appendix 1. Perform procedures 1 and 2, as shown above. Do not remove the unit operation batteries. 2. Remove the the memory backup battery cover, as shown. 3. Use a pen to lift the lithium battery out of the battery compartment.
-
Page 169: Troubleshooting Guide
Appendix 2. Troubleshooting Guide Refer to the list of possible symptoms, and solutions may be found here. The calculator’s power won’t turn on! • The operation batteries may not be installed, may be ex- hausted, or may be inserted incorrectly. Check the operation batteries in the battery compartment. - Page 170 Appendix The screen images cannot be stored (SLIDE SHOW) • The available memory may be too small to store the screen image. Select “B MEMCHK” under @ p menu. Select and delete unnecessary items under “C DEL”. The calculator is not responding; the software appears to have crashed! •...
-
Page 171: Specifications
Appendix 3. Specifications Model EL-9450 Graphing Calculator Product name 96 x 64 dot matrix liquid crystal display Display Number of digits: mantissa 10 digits, exponents 2 digits (standard screen); 7 digit display (including negatives, decimals) for table screen, etc. Display method: Numerical value, calculation equation input (direct algebraic logic input / one-line input method), fraction display method specification. - Page 172 Appendix Option menu Screen contrast adjustment, memory usage check, data delete, data link (between EL-9450 and PC or another EL- 9450) 32 KB (user area: Equation edit mode…approx. 17.9 KB, Memory size One-line edit mode…approx. 20 KB) Operation: 6 V DC... — AAA manganese battery (R03) ×...
-
Page 173: Precedence Of Calculations
Appendix 4. Precedence of Calculations When solving a mathematical expression, this calculator inter- nally looks for the following figures and methods (sorted in the order of evaluation): 1) Fractions (1/4, a/b, , etc.) 2) Single calculation functions where the numerical value occurs before the function (X , !, “... -
Page 174: Error Codes And Error Messages
Appendix 5. Error Codes and Error Messages Error Error Message Description Code Syntax Syntax error found in equation/program Calculate Calculation-related error found (division by 0, calculation beyond range, etc.) Nesting Cannot nest more than 14 numerical values, or 32 functions during execution. Invalid Invalid value error Dimension... - Page 175 Appendix Error Error Message Description Code Line too long Line contains more than 160 characters. Can’t return Return used without jumping from subroutine. Storage full Cannot create more than 99 files. Coord type Invalid coordinate system for command. I/O device Communication error found among devices.
-
Page 176: Calculation Range
Appendix 6. Calculation Range 1. Arithmetic calculation The results for dividend, multiplicand and operand are: × × × × < x ≤ < x ≤ 1 or x = 0 (valid within the range of display capability) × Calculation results and input values less than 1 Note: considered equal to 0. - Page 177 Appendix Function Calculation range Notes × |x| < 1 × 0 ≤ x < 1 n is an integer or 0.5 ≤ n ≤ 69.5 integer When a > 0: × < b log a < 100 When a = 0: ×...
- Page 178 Appendix Function Calculation range Notes × |x| < 1 × |y| < 1 × |Σx| < 1 Statistic × Σx < 1 calcula- × |Σy| < 1 tions × Σy < 1 × |Σxy| < 1 × |n| < 1 n ≠...
- Page 179 Appendix Function Calculation range Notes n > 0 × |Σx| < 1 × |(Σx) (Σy)| < 1 Regression calcula- (Σx) × – 0 < |Σx | < 1 tions excluding 2nd ΣxΣy × – |Σxy | < 1 degree polynomials. ×...
-
Page 180: List Of Menu/Sub-Menu Items
Appendix 7. List of Menu/Sub-menu Items Square brackets indicate that the value or variable is optional. 1. MATH menus Functions Syntax Keystrokes Page Commands M CALC value value fmin( fmin( equation, lower limit of x, upper limit of x ) fmax( fmax( equation, lower limit of x, upper limit of x ) d/dx( equation, value of x [, tolerance] ) -
Page 181: List Menus
Appendix Functions Syntax Keystrokes Page Commands xy→r( xy→r( x-coordinate, y-coordinate ) xy→ θ ( xy→ θ ( x-coordinate, y-coordinate ) r θ →x( r θ →x( r-coordinate, θ -coordinate ) r θ →y( r θ →y( r-coordinate, θ -coordinate ) M ANGLE °... -
Page 182: Stat Menus
Appendix Functions Syntax Keystrokes Page Commands seq( equation, start value, end value [, increment] ) seq( cumul list cumul df_list df_list list aug…( augment( list 1, list 2 ) l MATH min( value A, value B ) or min( min( list ) max( value A, value B ) or max( max( list ) -
Page 183: Stat Plot Menus
Appendix Functions Syntax Keystrokes Page Commands S REG Med_Med ( list name for x, list name for y D 0 1 MedMed [, frequency list ] [ , equation name to store] ) Rg_ax+b ( list name for x, list name for y D 0 2 ax+b [, frequency list ] [ , equation name to store] ) -
Page 184: Draw Menus
Appendix Functions Syntax Keystrokes Page Commands [ (in STAT PLOT mode) HIST/B.L./N.P./N.D./BOX/PIE/S.D./XYLINE Hist No arguments Broken • No arguments Broken + No arguments Broken No arguments Norm •_X No arguments Norm+_X No arguments Norm _X No arguments Norm •_Y No arguments Norm+_Y No arguments Norm _Y... -
Page 185: Zoom Menus
Appendix Functions Syntax Keystrokes Page Commands V_line V_line x-value T_line( T_line( equation, x-value ) Draw Draw equation Shade( equation 1, equation 2 [, begin, end] ) Shade( DrawInv equation DrawInv Circle( Circle( x-coordinate of center, y-coordinate of center, radius ) Text( Text( column, row, "... -
Page 186: Calc Menus
Appendix Functions Syntax Keystrokes Page Commands No arguments Default No arguments Square No arguments No arguments No arguments Stat No arguments Z FACTOR/POWER FACTOR No arguments No arguments No arguments No arguments Z EXP No arguments No arguments log x No arguments ln x No arguments... -
Page 187: Slide Show Menus
Appendix Functions Syntax Keystrokes Page Commands Intsct No arguments Minimum No arguments Maximum No arguments X_Incpt No arguments Y_Incpt No arguments Inflec No arguments 8. SLIDE SHOW menus Functions Syntax Keystrokes Page Commands B-IN Y = x No arguments Y = AX + B No arguments No arguments Y = 1 / x... -
Page 188: Frac Menus
Appendix Functions Syntax Keystrokes Page Commands Y = In x No arguments Y = sin x No arguments Y = tan x No arguments Y = |x| No arguments ] CHANGE Y = x No arguments No arguments Y = |x| No arguments Y = e No arguments... - Page 189 Appendix Functions Syntax Keystrokes Page Commands Rem comments No arguments P (in the Prgramming mode) BRNCH Label Label label name Goto Goto label name If conditional statements GOTO label name Gosub Gosub label name Return No arguments P (in the Prgramming mode) SCRN ClrT No arguments ClrG...
- Page 190 Appendix Functions Syntax Keystrokes Page Commands PlotON PlotON [ number ] PlotOFF PlotOFF [ number ] P (in the Prgramming mode) COPY StoLine No arguments RclLine No arguments...
-
Page 191: Index
Appendix INDEX : (colon) ..............110 Broken line plot, Graph type ........ 128 " (double quote), PRGM ........143 BS key ..............6 ∫, CALC ..............43 Built-in slide show ..........92 →a b/c ..............41 →A.xxx ..............41 →b/c ................ 41 CALC .............. - Page 192 Appendix ENTRY key ............. 38 Eqn, EDITOR ............23 d/dx(, CALC ............43 Equation mode, EDITOR ......14, 23 Data list operation, statistics ........ 133 Equality ..............51 Debugging, program ..........151 EQVARS, VARS ............ 149 Dec, ZOOM ............59 Error codes ............
- Page 193 LINE, DRAW ............76 nCr, PROB .............. 47 LINK, OPTION ............156 Negative value ............32 Linking to another EL-9450 or PC ....... 156 Negative value, entering the ......12 List features ............107 NEW, SLIDE SHOW ........89, 90, 94 LIST key ...............
- Page 194 Appendix Normal probability plot, Graph type ..... 128 Print, PRGM ............143 not, LOGIC ............. 52 PROB, MATH ............46 nPr, PROB .............. 47 Probability ............... 46 NUM, MATH ............44 prod(, MATH ............115 Numbers, entering ..........11 Program, blank line ..........141 Program, changing a name ......
- Page 195 Appendix Regression calculation ........134 SET, SHADE ............78 Regression function, using the ......137 SetList, OPE ............133 Rem, PRGM ............144 SETUP key ............6, 21 remain, NUM ............46 SETUP menu ..........22, 57 Remainder .............. 46 Sexagesimal ............
- Page 196 Appendix STYLE1, FORMAT ..........79 STYLE2, FORMAT ..........79 , REG ..............134 sum(, MATH ............115 X_Incpt, CALC ............65 , REG ..............135 , POWER ............60 T_line(, DRAW ............70 , POWER ............. 60 TAB, SETUP ............22 x', REG ..............
- Page 198 In Europe: This equipment complies with the requirements of Directive 89/336/EEC as amended by 93/68/EEC. Dieses Gerät entspricht den Anforderungen der EG-Richtlinie 89/336/EWG mit Änderung 93/68/EWG. Ce matériel répond aux exigences contenues dans la directive 89/336/CEE modifiée par la directive 93/68/CEE. Dit apparaat voldoet aan de eisen van de richtlijn 89/336/EEG, gewijzigd door 93/68/EEG.
- Page 199 SHARP CORPORATION 02EGK(TINSE0465THZZ) PRINTED IN CHINA/IMPRIMÉ EN CHINE/IMPRESO EN CHINA...
- Page 200 This file has been downloaded from: www.UsersManualGuide.com User Manual and User Guide for many equipments like mobile phones, photo cameras, monther board, monitors, software, tv, dvd, and othes.. Manual users, user manuals, user guide manual, owners manual, instruction manual, manual owner, manual owner's, manual guide, manual operation, operating manual, user's manual, operating instructions, manual operators, manual operator, manual product, documentation manual, user maintenance, brochure, user reference, pdf manual Downloaded from:...
Need help?
Do you have a question about the EL-9450 and is the answer not in the manual?
Questions and answers