Table of Contents
Advertisement
Quick Links
Advertisement
Table of Contents

Subscribe to Our Youtube Channel
Related Manuals for RWD 410


Summary of Contents for RWD 410
- Page 1 Dual Color Multi-Channel Fiber Photometry (410&470) User Manual...
- Page 2 RWD’s registered trademark or mark, these trademarks and the related security mark belong to RWD’s intangible property. The use of non RWD’s trademark or mark in this user manual are only for editing purposes, without other purposes, the rights belong to their respective rights owners.
-
Page 3: Table Of Contents
Contents PRODUCT INTRODUCTION ......................... 1 1.1..............................1 VERVIEW 1.2................................1 AFETY 1.3..............................1 ESCRIPTION 1.4............................2 RODUCT EATURES 1.5........................2 NVIRONMENT EQUIREMENTS 1.6..........................3 RODUCT ARAMETERS 1.7............................... 3 RODUCT SYSTEM SAFETY ............................4 2.1. - Page 4 6.7..........................18 TART DATA COLLECTION DATA ANALYSIS ............................20 7.1............................. 20 ENERAL ANALYSIS 7.1.1. Overview ............................20 7.1.2. Data clip ............................21 7.1.3. Pre-Processing ........................... 22 7.1.4. Event analysis ............................ 28 7.1.5. Behavior video ........................... 32 7.2..........................33 LUORESCENT HEAT MAP 7.3.
-
Page 5: Product Introduction
This Dual Color Multi-Channel Fiber Photometry (410&470) is designed, developed and produced by RWD Life Science Co., Ltd. It is a low fluorescence signal detection and the system based on multi-mode fibers, can excite fluorescence stably for a long time and detect the weak change of fluorescence signal. -
Page 6: Product Features
Two LED excitation light sources: 470 nm is used for the fluorescence excitation of green calcium indicator, and 410 nm is used to eliminate the influence of motion noise. Up to 9 channels of fluorescence signal recording can be supported for simultaneous experiments. -
Page 7: Product Parameters
1.6. Product Parameters Parameter Description Dimension 315mm× 290mm× 111mm Weight 3.9 kg Frame rate of the fiber 10~300 fps photometry camera Depends on the frame rate of the fiber photometry camera. If the frame rate is 10 fps, the exposure time range can be set to Exposure time range 1~30 ms;... -
Page 8: System Safety
Keep the optical fiber interface clean and cover it using a dust cap when the device is not in use. RWD is not responsible for any device failure caused by improper cleaning, maintenance and operation. If the equipment is not in use for a long time, it is recommended to turn off the host and computer. -
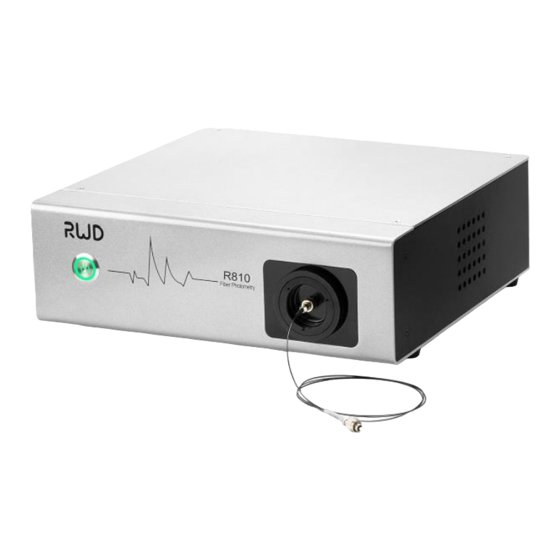
Page 9: Product Structure And System Connection
3- Product Structure and System Connection Figure 3-1 Figure 3-2 Interface Name Description Power switch Turns on/off the device. Connects the optical box and multi-mode fiber Optical fiber interface 1 bundles. Focusing knob Focus on fiber end faces. Downloads software, controls the main board, USB 3.0 interface marks external enhancement. - Page 10 System connection 1) First, connect one end of the power adapter to the power supply and the other end to the 12V power interface of the host. 2) Connect the USB cables to your computer Note: be sure to use a USB 3.0 cable to connect the USB 3.0 interface on the host to the USB 3.0 interface with power supply mark on the computer.
-
Page 11: Software Introduction
4- Software Introduction 4.1. Environmental requirements of the software A 64-bit operating system of Windows 10 Home 4.2. Summary of main functions of the software 4.2.1. Data collection 1) Continuous collection and sequential collection 2) Synchronous collection of behavior video 3) Automatic marking, manual marking, ROI marking 4) Triggered collection, delayed collection and collection duration setting 4.2.2. -
Page 12: Operation Example
11) Connect the optical fiber to the optical fiber needle on the animal head through a sleeve. 12) Adjust the power of the 410 nm light source to make the fluorescence value of 410 nm close to that of 470 nm. -
Page 13: Data Collection
6- Data Collection 6.1. Initialization Install the multi-channel fiber photometry software, and double-click the desktop software icon to enter the operation interface. Figure 6-1 Click [Photometry] or [Analysis] to enter the data collection or analysis interface. When [Photometry] is selected, the software will automatically detect whether the Host, the fiber photometry camera, and the behavior camera are connected normally. -
Page 14: Light Setting
If the connection of the Host, the fiber photometry camera, and the behavior video is identified as normal, the system will automatically go to the main interface. The system will enter the [Photometry] page by default, as shown in Figure 6-3. From left to right are the parameter setting area, the trace area, and the behavior video area. -
Page 15: Channel/Camera Parameter Setting
but the excitation light will be turned off. At the end of the interval, the excitation light will be sent for the next 20 seconds. Such a cycle repeats itself. If it is not checked, the excitation light will be output continuously according to the selected light mode. -
Page 16: Adjusting The Fiber End Face
the box or clicking and selecting the green ROI to adjust. Camera field of view Fiber end face Figure 6-6 6.3.1. Adjusting the fiber end face The fiber end face shall be clearly visible and located in the center of the view. If the fiber end face is not visible, not clear, or deviated, please select the following methods to adjust. -
Page 17: Behavior Video
6.4. Behavior video Adjust the behavior camera and aim it at the observed animal. The video parameters can be set and the behavior trace can be tracked in real time, as shown in Figure 6-7. If "Behavior Recording" is checked, the behavior video file can be obtained synchronously in the process of fluorescence data collection. -
Page 18: Output Setting
Figure 6-8 Adjust the corresponding value of [Tracking Setting] to adjust the grayscale threshold of target recognition, with a setting range: 0-255. Check [Preview] to view the tracking status in real time. 6.4.1. Output setting Click [Output Setting] to enter the output setting interface, where you can set the frequency and pulse width of TTL signal at the corresponding output terminal, and apply the setting of TTL signal to the output port selected by the corresponding fluorescence signal "automatic output"... -
Page 19: Marker Parameter Setting
6.5. Marker parameter setting Figure 6-10 Check [Hardware]: turn on the external signal marker. During signal collection, if the system recognizes that there is a signal input at the input port, it will identify the automatic marker signal function on the fluorescent signal. It is necessary to connect the interface of the external device with the input port of the fiber photometry system through the BNC line. - Page 20 [Manual] Marker name and marker hotkeys can be customized. When the manual marker is triggered, it will take effect in the corresponding [Channel]. Figure 6-12 When the marking event is triggered, the diagram of the event on the fluorescence signal trace is as follows: Figure 6-13...
-
Page 21: Preview
[Auto Output] Figure 6-14 Select [Start]: There will be signal output when fluorescence data are being collected, also can customize the delay after the start of collection, that is, the TTL signal will be output when the set delay time is reached. The frequency, pulse width and duration of the output signal can be adjusted through the [Output Setting] below. -
Page 22: Start Data Collection
Figure 6-15 It is advisable to keep the preview for 5-10 minutes before the formal experiment, which can make the fluorescence baseline more stable. 6.7. Start data collection After preview, click [Photometry] to start data collection, and click the icon to enter the [Start/Stop Setting] page. - Page 23 [Start/Stop Setting] page Figure 6-17 1) On the [Start/Stop Setting] page, when check [Immediately Start] and [Immediately Stop], click to start data collection immediately. Click to stop the collection immediately. 2) If is selected in [Start] and the waiting time is set, after clicking , the system will automatically start data collection after the waiting time.
-
Page 24: 7- Data Analysis
7- Data Analysis After data collection, click [Analysis] on the data collection page to switch to the data analysis page, as shown in Figure 7-1. There are three subtags at the bottom of the data analysis page. Click them to switch to the [General] page, the [Fluorescent Heat Map] page, and the [Trajectory] page respectively, and the [General] analysis page will be displayed by default. -
Page 25: Data Clip
Figure 7-2 7.1.2. Data clip Clip and select the collected data. Enter the start time on the x-axis in Figure 7-3, which corresponds to the "start time" in Figure 7-4. The "end time" is "experiment duration" by default, that is, the clipped and selected duration range. Figure 7-3 Figure 7-4 If there are multiple channels, you can click... -
Page 26: Pre-Processing
β setting range: 5-12. [Motion Correction] Only in the 410&470 mode, when select 410 as the control, the motion correction shall be used, and it will be used by default. Click [Draw], and the trace will jump to the △F/F trace display by default, as shown in Figure 7-6. - Page 27 Figure 7-6 Click to open the drop-down list , in which there are a variety of traces to display.
- Page 28 Z-score Figure 7-7 BaselineFitted (display the original data and baseline correction fitting curve) Figure 7-8...
- Page 29 BaselineCorrected (display the data curve after baseline correction) Figure 7-9 MotionFitted (display fitted410 data curve) Figure 7-10...
- Page 30 If 410 is selected as the control: F1 = fitted410, F0 = median (raw data) If 410 is not selected as the control: F1 is the baseline correction curve value, F0 = median (Baseline) If the data does not go through baseline correction:...
- Page 31 Threshold Setting Figure 7-12 Click [Threshold Setting] and check the channel to adjust the threshold setting in the input box. The software will display the threshold dotted line of the set color in the trace display area. Figure 7-13...
-
Page 32: Event Analysis
7.1.4. Event analysis Switch to [Event Analysis] for viewing all the markers and details. The markers checked by is displayed with a small triangle marked in the trace area. Click drop-down arrow of to change the marker color. [New maker] Right-click in the trace area then click [New Marker]→(Edit) [New Event]/(Manaul) Marker1, if (Edit) [New Event] is selected, [New Event] will appear in the maker list, edit its name as you need. - Page 33 [Delete maker] Click the right mouse on any marker in the trace area [Delete marker] will appear for choosing. Figure 7-15 Light up the icon to show all markers in trace area. [Marker] Instruction: Checked by in the maker list: Only the checked marks can be used to draw the heat map of △F/F&Z-score.
- Page 34 Marker list Figure 7-16 [Peri-event heatmap] Figure 7-17 Note: Maker start time will be set as the “0” point for Fluorescence Heatmap and/or Data.CSV Pre-Post: Maker start time was taken as “0” point to set the pre and post time. The data within this window (peri-even) is used to output the heat map and mean±...
- Page 35 If the data go through baseline correction: If 410 is selected as the control: F1=fitted410 If 410 is not selected as the control: F1 is the baseline correction curve value If the data does not go through baseline correction: If 410 is selected as the control: F1=fitted410...
-
Page 36: Behavior Video
Notes: 1) Motion correction uses Robust Least Square to fit data 410 in the peri-event to 470 to get fitted410. 2) Baseline correction uses the Iterative Weighted Least Square algorithm to get the baseline correction curve. 7.1.5. Behavior video Figure 7-19 Video files in the data can be imported synchronously with the data. -
Page 37: Fluorescent Heat Map
Real-Time Refresh Line Figure 7-20 7.2. Fluorescent heat map Click at the bottom of the interface to switch to [Fluorescent Heat Map]. Click [+] in the for addition, and select the fluorescence data file of XX Fluorescence_Ttrail.CSV to import. Click [Draw], and the analysis results are shown in Figure 7-21. Drag the mouse down to browse the right drawing area. - Page 38 Description of △F/F fluorescent heat map (same as Z-score fluorescent heat map) Figure 7-22 Bin value setting: change rendering fineness of the heat map by setting bin value. Bin setting range: 1px ~ 100px; Fluorescence thermal value scale: Upper limit input range: -999.000 ~ 1000.000 Lower limit input range: -1000.000 ~ 999.000 Description of △F/F mean±...
-
Page 39: Trajectory
7.3. Trajectory Click to switch to the [Trajectory] interface, as shown in Figure 7-24. You can view the animal trajectory and corresponding ROI in this interface. The ROI list displays the ROI outline thumbnail and ROI name, as well as the trajectory duration of the animal in the ROI area. Click [Select] to import the stored track.csv file. -
Page 40: 8- System Setting
8- System Setting Click System Setting on the Photometry or Analysis tab. In the window displayed, you can set the color of trace, tracking set and languages. 8.1. Trace Color On the Trace Color tab, choose a color block to set the color of trace displayed on the Photometry or Analysis tab. -
Page 41: Languages
Figure 8-2 8.3. Languages Choose Chinese( ) or English as the system language. -
Page 42: 9- Other Functions
On the Analysis tab, click File to Open Files or Video. Figure 9-2 9.2. Device Click Device to check the device status, as shown in Figure 6-2. 9.3. Help You can download the instructions and visit the official website of RWD. Figure 9-3... -
Page 43: 10- Maintenance
10- Maintenance Do not use hard or sharp objects that may scratch the device. Do not use chemical reagents to clean the surface of the device. Instead, use water. Avoid shaking and collision when you move the device. ... -
Page 44: 11- Troubleshooting
11- Troubleshooting This section describes the frequently encountered problems (faults) when using the device, their possible causes and countermeasures. Problems Solution Check that the USB 3.0 cable is connected to Abnormal data collection the correct interfaces. If the aperture image is blurred, turn the focusing knob to focus. -
Page 45: 12- Warranty
After the device to be repaired is returned to the factory and inspected, if it is found that the device has been disassembled without authorization from RWD, the company does not provide customer service such as warranty, free maintenance and parts replacement. The warranty statement (including its restrictions) is exclusively issued by RWD and covers all other warranty conditions. - Page 46 RWD Life Science Web: www.rwdstco.com Add: 850 New Burton Road, Suite 201, Dover, DE 19904, Kent, Delaware, USA Add: 19/20F, Building 9A, Vanke Cloud City III, Liuxin 4 Street, Nanshan District, Shenzhen518000, Guangdong, P.R. China Tel: +001-858-900-6602 +86-755-86111286 After-sales Service: +86-755-86111281...
Need help?
Do you have a question about the 410 and is the answer not in the manual?
Questions and answers