Table of Contents
Advertisement
Advertisement
Table of Contents

Related Manuals for Optics11 Life PAVONE

Summary of Contents for Optics11 Life PAVONE
- Page 1 USER MANUAL PAVONE...
- Page 2 CONTACT INFORMATION Please website +31 20 598 7917 more information info@optics11life.com about our products. support@optics11life.com www.optics11life.com www.optics11life.com VISITING ADDRESS VU University Campus W&N Building room O-236 De Boelelaan 1081 1081 HV Amsterdam The Netherlands SHIPPING ADDRESS De Boelelaan 1081 1081 HV Amsterdam The Netherlands COMPANY INFORMATION Optics11 B.V.
-
Page 3: Table Of Contents
CONTENTS Revision history Safety Introduction Installation Preparing the setup for measurement Using the Pavone Additional system calibration and settings Optimizing instrument stability and sample mounting The OP1550 interferometer... -
Page 4: Revision History
REVISION HISTORY Version 1.0 New document V1. March 4, 2019 Ernst Breel Version 1.5 Update for V1.5.2 February 18, 2021 Nelda Antonovaite Version 1.6 Update for V1.6.0 October 20, 2021 Ali Paknahad optics11life.com... -
Page 5: Safety
SAFETY The OP1550 interferometer, part of the Pavone instrument, is equipped with a class 1M laser. The laser light is coupled out via a fiber connector on the front panel and has a terminator on the back panel. Do not view directly into the beam with optical instruments. -
Page 6: Introduction
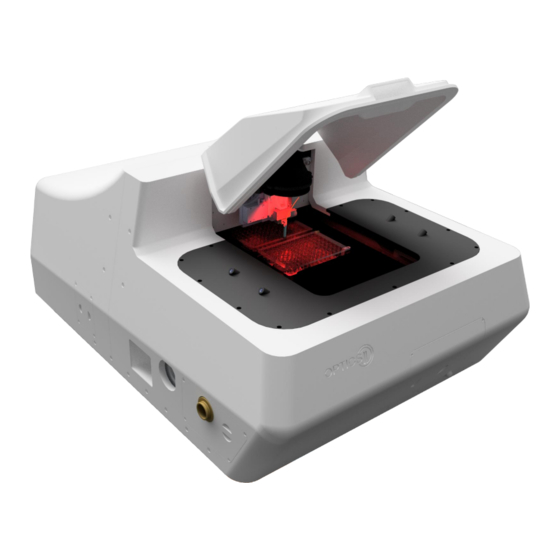
This document describes the installation and operation of the Pavone instrument, as developed by Optics11 Life (see Figure 1). Details of the installation of the Pavone are provided in Chapter 1. Chapter 2 describes the preparation of the Pavone and probes for experiments. How to perform the measurements and operate the instrument is described in detail in Chapter 3. -
Page 7: Installation
1. INSTALLATION This section describes the general installation of the Pavone by providing an overview of its components, the considerations for finding a location to set up the system, the wiring scheme for connecting the individual components, and the actions required to start up the Pavone instrument. Please use a detailed installation manual that was delivered with the system as there might be some system version- dependent differences. - Page 8 Figure 4: From left to right: patch cord and BNC cable connected to the interferometer, patch cord connection to Pavone, mounted CCD camera and Pavone body connections.
-
Page 9: Preparing The Setup For Measurement
The power supply unit automatically powers the Pavone unit. Starting the software Ensure that stage locks are removed, nothing can obstruct sample stage movement. Start the Pavone measurement software by double-clicking the Pavone software icon on the desktop. The software is loading all devices while checking the hardware connection status, which should all be ‘Idle’... - Page 10 the sample while optical fiber reads out cantilever bending during indentation. The cantilever acts as a spring to measure the stiffness of the deformed material. Figure 6: Force sensor (probe) design. Selecting the right probe Although a specific probe can measure a wide range of Young’s moduli, selecting a probe with suitable parameters that match with the specific sample properties can enhance the quality of the measurement.
- Page 11 Cantilever with tip Figure 7: Probe and fiber inside the probe box (left), probe mounting to the Pavone, fiber is connected to the adapter (right). After powering the Pavone instrument, starting the software and homing the stages, a probe can be mounted.
- Page 12 100 µm piezo probe plate 1 Y stage plate 2 X stage Cantilever with tip objective stage Figure 8: Main Pavone components. X stage Y stage Piezo signal in V Non-linearized cantilever signal in V Figure 9: Main software window. optics11life.com...
- Page 13 Short description of main window controls (see Figure 8 and Figure 9): 1. Top window selection: Find Probe – allows calibration of probe tip position in respect to the camera image. Wellplates – allows moving to selected well in the plate. Calibration –...
- Page 14 Stop – stops experiment or any other function. Run experiment – runs experiment set in “ Config. exp” 8. Move to point: Speed (µm/s) – approach speed that Z stage moves down during “Find Surface”. Z above surf. (µm) – the distance that the probe is retracted after the surface is found. Find Surface –...
- Page 15 2.4 Calibration sequence When starting to work with the Pavone, three steps are required to calibrate the system: Find probe Wellplates Calibration In the software these three steps are indicated in the top menu: Each button opens a menu enabling specific actions. In general, the sequence to follow is from left to right.
- Page 16 confirming the tip location, press save. Keep in mind that tip position in the camera view will deviate depending on the Z-stage position (>10µm along 2000 µm change in Z-stage) 9. Before commencing with the next steps, click ‘Home stages’ in the ‘Controls’ tab once, to move all stages to a safe position for sample plate mounting.
- Page 17 Figure 11: Locate tip menu. The red circle marks the tip position (top 25 µm radius tip and bottom 3 µm radius tip). You can use the zoom function for smaller tips. 2.6 Configuring sample plates Find probe Wellplates Calibration After the probe is aligned, the sample plates can be mounted and configured in the software.
- Page 18 Caution: The probe is sensitive to the refractive index of the medium and temperature, thus, the probe needs to be calibrated in the same medium as the sample and at a stable temperature. 2. Open the “Wellplates” menu which will show the two sample docks (see Figure 12). To configure your sample plates, select the right sample plate format from the drop-down menu.
- Page 19 Figure 13: Probe is entering at the top left corner of the well (left image), and probe is being preweted by pipetting liquid down the probe front-face (right image). 2.7 Initialize probe Find probe Wellplates Calibration Before the use of the probe, the laser inside the interferometer and geometrical factor of the probe must be calibrated as it is unique for each probe and medium.
- Page 20 Figure 14: Probe calibration menu. 2. Move the probe to the calibration well using ‘Wellplates’ window. 3. Make sure that the probe is prewetted. 4. Now you should move down the probe in “Incr. (µm)” steps of 5000 µm until the probe is clearly below the liquid level “Z(µm)”~15 000 µm.
- Page 21 Zoom buttons Figure 15: a) Working principle of interferometer. b) Live wavelength scan signal, use buttons on the right bottom corner to zoom in and out. c) Good wavelength scan and d) failed one. Principle: Laser light (~1550nm) is coupled to the single-mode fiber. The light is reflected back from the two interfaces: the end of the fiber and the cantilever.
- Page 22 Reasons for an error during wavelength scan: • Noise – get rid of any noise sources close to the instrument; • No connection – check the fiber connections (unplug-plug); • No cantilever – exchange probe; • Dirty cantilever – clean the probe with demi water & Isopropanol & water again; •...
- Page 23 Figure 17: a) Schematic drawing of the meaning of geometrical factor. b) Live piezo and cantilever signals during calibration when probe is in contact with the hard surface (left) and when it is out of contact (right). c) Successful (top) and failed (bottom) calibration messages.
- Page 24 13. Next, check whether the demodulation circle was calibrated correctly. Either tap on the body of Pavone to induce a sufficient amount of noise to see the whole white signal around the red demodulation circle or move down the probe at small steps e.g. 1 µm. In both cases, the white signal should overlap with the red circle.
- Page 25 Pavone to induce one circle of noise and press the “calibrate” button on the interferometer, 2) go in contact with the sample and press calibrate from the “Initialize” menu, do not save calibration factor. However, if the signal is not just slightly displaced from the demodulation circle but rather became very small, it means that the cantilever got stuck to the fiber.
-
Page 26: Using The Pavone
This section describes the use of the Pavone instrument after having prepared the instrument. 3.1 The Find Surface procedure The Pavone instrument allows bringing the probe into contact with the sample surface. The automated find-surface function can be used by clicking the ‘Find Surface’ button on the main screen once the probe is submerged in the medium. - Page 27 Figure 19: Find Surface options window. Piezo and cantilever signals during the “Find Surface” step. Out of contact Contact In contact Adhesion Starts in contact Figure 20: Find Surface procedure. a) Successful measurement resulting in d) load-indentation curve with out of contact part of the curve needed for contact point determination.
- Page 28 Find Surface settings need to be tuned for the specific sample and probe combination. For many samples, the standard settings of Find-Surface will be suitable and, thus, tuning won’t be needed. However, for very soft or adhesive samples tuning will be required. When tuning Find Surface settings follow these steps: 1.
- Page 29 Figure 21: Probe tip and sample in focus. 3.3 Moving within the well 3.3.1 Stage movement The X and Y stages allow one to move the sample stages within the well. The ‘XY stage travel (µm)’ field in the bottom-right of the camera feed allows the user to set a displacement (in µm) which can be used by pressing the arrows in the camera feed window.
- Page 30 3.4 Configure experiment Configure experiment window can be opened from the main window. It allows to set up an indentation profile and automatize experimental procedure. Experimental procedures can be saved as .dat files and reloaded at a later time. The left side of the window in Figure 23 shows steps in the experimental procedure which can be added, deleted, copied, cleared, or moved (arrows up and down).
- Page 31 Figure 24: Move option windows: a) Move to well; b) Move absolute; c) Move relative. 3.4.2 Find Surface After the probe is positioned above the well and lowered to the transit height where it is submerged in the medium, the “Find Surface” step is used to bring the probe closer to the sample. Similarly to the settings in the main software window, one can select the speed at which the probe moves down “Speed (µm/s)”, distance to which the probe is retracted after the surface is found “Z above surf(µm)”...
- Page 32 (0.025N/m, E<1kPa) or when the temperature of the medium is not stable, i.e. warming or cooling to room temperature or the temperature set in Pavone. If one would start immediately with the matrix scan, the initial several indentations might be failed or distorted.
- Page 33 ‘Load – indentation’ and ‘Time data’ tabs of the home screen. Modes of operation The Pavone can operate in four different indentation modes. The modes differ in the controlled parameter as shown in the following table Hoorn, H.
- Page 34 Table 3: Comparison of the three modes of operation. D-mode P-mode I-mode PLP-mode Controlled Piezo speed & max Piezo displacement Load Indentation depth parameter load Sample Circuit Open-loop Closed-loop Closed-loop Open-loop • Displacement control operates in an open-loop, meaning that only piezo displacement is controlled but not load or indentation-depth.
- Page 35 Figure 28 a) Measured signals of piezo movement and cantilever bending and calculated ones, indentation-depth and load, as a function of time. b) Options menu to set fitting parameters for the preliminary Young’s modulus values. c) Displacement control measurement where the set piezo speed is 20 µm/s and resulting indentation speed is 12 µm/s. d) Indentation control measurement where set indentation speed is 5 µm/s, approach speed is 6 µm/s and resulting piezo speed is 9 µm/s e) Load- indentation curve and Hertz fit in red.
- Page 36 determined as piezo speed which is equal to the displacement divided by the time. See Figure 28-c where piezo speed is defined by the user and indentation-speed is a free variable. Load control – P-mode The P-mode of operation allows you to set a specific load and speed at which it is reached and also the load can be kept constant over a certain time interval for a creep experiment.
- Page 37 3.4.6. Dynamic mechanical analysis - DMA The Pavone features, besides the quasi-static operation, oscillatory indentations also called dynamic mechanical analysis (DMA). DMA mode allows mechanical oscillations in all three modes of operation while indenting in a sample and can be switched ‘On’...
- Page 38 differ depending on PID settings set in the ‘Maintenance’. Therefore, initial tests need to be performed to evaluate system performance for the specific sample/probe combination. Get in contact with support@optics11life.com to get more information and training. The number of periods should be chosen so that oscillations take at least 1s, for instance when using 0.5 to 5Hz, the number of periods should be 5 while for higher frequencies, the number of periods should match the frequency, e.g., 75Hz - 75 periods.
- Page 39 �� (1 − �� ��′′(��) = sin(��) ℎ √ ℎ�� where δ is the phase lag between oscillations of indentation and load (see right side of Figure 31. tan(δ) is the dissipation (damping) factor which is the ratio between loss and storage modulus. Materials with a higher damping ratio than 1 are considered to be viscoelastic fluids and below 1, viscoelastic solids.
- Page 40 Using the find-surface again for each point in a grid scan allows the Pavone to scan samples that have a higher degree of surface topography. For very flat samples this ‘Auto find surface’ feature, can also be switched off so that the probe remains a few microns above the surface when moving between coordinates in a grid scan (see Figure 33-a).
- Page 41 Figure 33: Matrix scan settings and example of matrix scan result on a swelling hydrogel. 3.4.8 Run Coordinate List (Config exp.) and Coordinates (main window) In order to measure multiple individual objects or regions of interest in a semi-automatic manner, one can record the coordinates of these objects in the “Coordinates”...
- Page 42 Figure 34: Setting up the coordinate list. Coordlist.json file is loaded with four coordinates: X position of stages, Y position of stages, Z position of stages, and Objective position (see Figure 35). At first, all the stages are moved to the selected coordinate followed by an Automatic find surface (if it is ticked) and then a single indentation is performed.
- Page 43 Figure 35: Setting up indentations on a list of selected coordinates. 3.4.9 Environment control The temperature setpoint (from 15 to 50°C) during the experiment can be set in “Environment control” menu (see Figure 36). One should wait 30 min to let the system and the sample plate to warm up to the desired temperature.
- Page 44 3.4.10 Configure experiment sequence for microplates For automatic measurements in wellplates also a sequence can be programmed in the ‘Configure experiment’ menu. When opening the menu an empty table can be configured to include the steps required in an experiment from six pre-configured actions. To do so, click the ‘Add’ button, and couple an action type to the step by clicking on it from the drop-down menu on the right (see Figure 37).
- Page 45 • Go to step – here you choose from which step the "repeating” process should start. Note that always the selected step should be the step where the “Move to well” action is defined (usually step number “1”), from which, all steps of programmed experiments will be repeated for a new well.
- Page 46 3.5 Camera settings and Microscopy To have a good image of your sample or probe, camera settings need to be adjusted by the user in the “Camera” option in the main window (see Figure 39). One can select parameters to be adjusted automatically by ticking ‘Automatic’...
- Page 47 Figure 39: Camera settings and image saving options. 3.6 Data processing and analysis For every single indentation and matrix scan, all the load-displacement data is stored in a tab-separated text file (see Figure 40). By using this text file, Time, Load, Indentation, Cantilever, Piezo and Auxillary data can be imported into any program for post-processing.
-
Page 48: Additional System Calibration And Settings
all essential information about the measurement. Please read the DataViewer manual regarding data analysis. Figure 40: Typical indentation file showing the header lines and the start of the five data columns. 4 ADDITIONAL SYSTEM CALIBRATION AND SETTINGS 4.1 Wellplate calibration - adjusting the safety areas Each wellplate has safety areas, which are determined by the dimensions of the well plate (see Figure 41) and calibrated by the user. - Page 49 Figure 41: Example of the safe areas for different wellplates. Follow these steps: 1. Mount two same wellplates or custom plates on Pavone, open the “Wellplates” menu from the main window and select the “calibrate” option (see Figure 42-a). Make sure that the probe is aligned with the objective (“Find Probe”...
- Page 50 Figure 42: Different stages of wellplate calibration process. optics11life.com...
- Page 51 4.2 Camera calibration The camera must be aligned properly to the stage movement to ensure the precision of move-to-point function. This guide will enable one to set up the camera to ensure smooth operation. The camera is affixed with three set screws that must be loosened to adjust the rotation of the camera (see Figure 43).
- Page 52 Figure 44: Camera alignment (top to bottom): choose a point with a green cursor, Y coordinate 106676.7. Move up the Y stage and press on the same object, Y coordinate 106677.2. Rotate the camera clockwise. Move stage down again, Y coordinate 106674.6.
- Page 53 Maintenance settings are not intended to be changed by the user unless they are specially trained to do it by one of the application specialists of Optics11 Life (see Figure 45). The default maintenance settings are saved in the desktop folder ‘settings’.
-
Page 54: Optimizing Instrument Stability And Sample Mounting
Preferably this bench is not shared with other vibrating machines such as vortexes, pumps, or large fans. Optionally the Pavone can be bolted to the top of a third-party stabilization platform, such as an air table. Make sure that the air table is inflated when using Pavone. - Page 55 When using temperature control of Pavone, wait until the set temperature is reached. Also, when submerged the probe into the medium, wait at least 5 minutes before calibration to make sure that the probe “gets wet”.
- Page 56 porous material, select a tip size several times larger than the largest pore. For examining local features within one pore, select a tip size that is several times smaller than the pore diameter. There are a few other considerations regarding the tip radius: 1.
- Page 57 When attempting to measure samples that come fresh out of the incubator please allow some time for readjustment to the Pavone temperature. This applies even more so to larger temperature gradients: if medium or samples come out of a refrigerator, let the sample temperature stabilize to room temperature before initiating the measurement.
-
Page 58: The Op1550 Interferometer
6. THE OP1550 INTERFEROMETER The interferometer operates as a stand-alone device and can be switched on or off at any time. The OP1550 interferometer contains a tunable laser source, modulation options, a high-speed photodiode, and data acquisition electronics (see Figure 48). The OP1550 interferometer is configured using the five buttons on the front panel that allows you to walk through the menus and select and alter menu items. - Page 59 Using the OP1550 interferometer The measurement, wavelength, demodulation and settings menu Figure 49: Measurement (a), Wavelength scan (b), Demodulation (c) and Settings menu (d) of the OP1550 interferometer. The ‘Measure’ tab displays the actual intensity that reaches the photodiode, which converts this intensity into a voltage.
- Page 60 Figure 50: Datapoint changing its position after the tip is getting in contact with a surface: probe out of contact (a), noise caused by probe moving during automated find surface procedure or by manually moving the Z-stage (b), probe in contact with surface resulting in datapoint position change (c).
- Page 61 This modulation is required for the Pavone to function properly and should always be turned on when performing indentations. The modulation is active when the mode is set to ‘On’; the menu will now show the controls to change the frequency, amplitude and offset of the modulation signal.
- Page 62 Figure 52: Tilted wavelength scan. “Live calibration” should be enabled before starting the calibration procedure. Furthermore, calibration should be done to no more than 3um piezo displacement (you can change that in Options). Do not use “live calibration” if the samples are sticky as it will cause a reset of scaling factors to the over- bended position.
- Page 63 For troubleshooting, support or questions, while working with the Pavone, please contact Optics11 Life Tel.: +31 20 5987917 E-mail: support@optics11life.com Office hours are between 9h and 18h, CET.
Need help?
Do you have a question about the PAVONE and is the answer not in the manual?
Questions and answers