Table of Contents
Advertisement
Quick Links
Advertisement
Table of Contents

Related Manuals for B+K precision RFM3000 Series


Summary of Contents for B+K precision RFM3000 Series
- Page 2 Safety Summary The following safety precautions apply to both operating and maintenance personnel and must be followed during all phases of operation, service, and repair of this instrument. Before applying power to this instrument: • Read and understand the safety and operational information in this manual. •...
- Page 3 Electrical Power This instrument is intended to be powered from a CATEGORY II mains power environment. The mains power should be 115 V RMS or 230 V RMS. Use only the power cord supplied with the instrument and ensure it is appropriate for your country of use.
- Page 4 Do not operate instrument if damaged If the instrument is damaged, appears to be damaged, or if any liquid, chemical, or other material gets on or inside the instrument, remove the instrument’s power cord, remove the instrument from service, label it as not to be operated, and return the instrument to B&K Precision for repair.
- Page 5 Do not substitute parts that are not approved by B&K Precision or modify this instrument. Return the instrument to B&K Precision for service and repair to ensure that safety and performance features are maintained. For continued safe use of the instrument •...
- Page 6 Safety Symbols Symbol Description indicates a hazardous situation which, if not avoided, will result in death or serious injury. indicates a hazardous situation which, if not avoided, could result in death or serious injury indicates a hazardous situation which, if not avoided, will result in minor or moderate injury Refer to the text near the symbol.
-
Page 7: Table Of Contents
Contents General Information Organization Description Features Front Panel Rear Panel Touch Screen Display Installation Contents Input Power & Fuse Requirements Connections Preliminary Check Getting Started Initialization Taking Measurements 3.2.1 Continuous Mode 3.2.2 Pulse Mode 3.2.3 Statistical Mode Operation Control Menus Parameter Date Entry and Selection 4.2.1 Numerical Data Entry &... - Page 8 Maintenance Safety Cleaning Inspection Lithium Battery Software Upgrade Service Information LIMITED THREE-YEAR WARRANTY...
-
Page 9: General Information
General Information This instruction manual provides you with the information you need to install, operate, and maintain the RFM3000 RF Power Meter. Section 1 is an introduction to the manual and the instrument. 1.1 Organization The manual is organized into five sections and two Appendices, as follows: General Information presents summary descriptions of the instrument and its principal features, acces- Section 1 sories, and options. -
Page 10: Description
General Information 1.2 Description The RFM3000 provides design engineers and technicians the utility of traditional benchtop instruments, the flexibility and performance of modern USB RF power sensors, and the simplicity of a multi-touch display built with advanced technology. As a benchtop meter, the RFM3000 provides a standalone solution for capturing, displaying, and analyzing peak and average RF power in both the time and statistical domains through an intuitive, touch screen display. -
Page 11: Front Panel
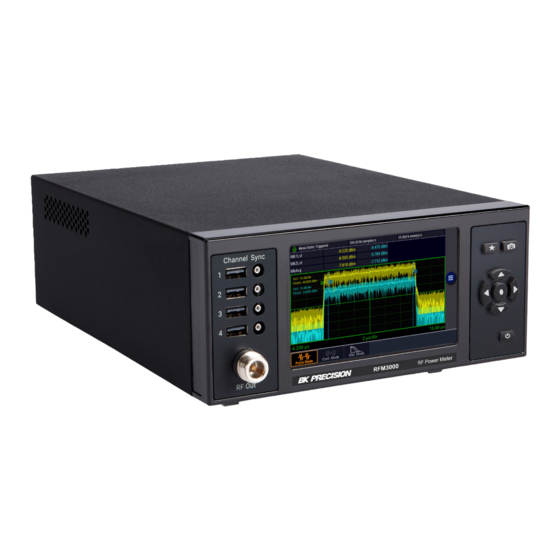
General Information 1.4 Front Panel Refer to table for a description of each of the illustrated items. The function and operation of all controls, indicators, and connectors are the same on the standard and optional models. Figure 1.1 Front Panel... - Page 12 General Information Item Description Four sensor inputs are located on the front and rear panels of the instrument. These are stan- USB Host dard USB 2.0 Type A receptacles designed to accept only RFP3000 Series Sensors or standard USB keyboards, mice, and flash drives. Four sensor trigger inputs are located on the front and rear panels of the instrument.
-
Page 13: Rear Panel
General Information 1.5 Rear Panel Refer to table for a description of each of the illustrated items. The function and operation of all controls, indicators, and connectors are the same on the standard and optional models. Figure 1.2 Rear Panel... -
Page 14: Touch Screen Display
General Information Item Description Four sensor inputs are located on the front and rear panels of the instrument. These are stan- USB Host dard USB 2.0 Type A receptacles designed to accept only RFP3000 Series Sensors or standard USB keyboards, mice, and flash drives. Four sensor trigger inputs are located on the front and rear panels of the instrument. - Page 15 General Information menus hidden. The Text Display mode of the instrument provides a table view of measured parameters. Parameters depend on the Measure mode selected. See Section Menu Referencefor more information on the display format. Figure 1.3 Display Figure 1.4 Display Hidden Menu...
- Page 16 General Information Item Description Indicates the measurement acquisition status of the unit. In Pulse mode, the sample rate and Status Bar number of sweeps per second are also shown. In Statistical mode, it indicates the gating set- ting in use, run time, and number of points. Displays a table of measurements for each channel that is enabled on the meter.
-
Page 17: Installation
Installation This section contains unpacking and repacking instructions, power requirements, connection descriptions, and preliminary checkout procedures. 2.1 Contents Please inspect the instrument mechanically and electrically upon receiving it. Unpack all items from the shipping carton, and check for any obvious signs of physical damage that may have occurred during transportation. Report any damage to the shipping agent immediately. -
Page 18: Connections
Installation 2.3 Connections Compatible sensors can be connected to any of the USB ports on the front or rear panel. The base Sensor(s) RFM3000 model only permits two sensors to be active at any one time. With the RFM3000-4CH model, four sensors can be active at any one time. Sensors become active when plugged into a USB port or immediately if already plugged in when the RFM3000 powers up. - Page 19 Installation Figure 2.1 Power-On Display 6. On the front panel, press the select key to bring up the on-screen menu. From the Main menu, use the touch screen or the navigation keys on the front panel to browse to System > Reports > Configuration and select Show. A display similar to figure will appear.
-
Page 20: Getting Started
Getting Started This chapter will introduce the user to the RFM3000 RF Power Meter. The chapter will identify display organization, list the configuration of the instrument after initializing, and provide practice exercises for front panel operation. For additional information, see Section 4 Operation. 3.1 Initialization The steps below initialize the RFM3000 and prepare it for normal operations. - Page 21 Getting Started Parameter Default Measure Mode Select Graph Parameters Related to the Measure Menu Measurement Measurement Parameters Related to the Display Menu View Graph Parameters Related to the Channel > Channel # > Menus Channel1 Channel2 Channel3 On(4 CH option) Channel4 On(4 CH option) Vertical Scale...
-
Page 22: Taking Measurements
Getting Started 3.2 Taking Measurements To perform accurate measurements, the following is a minimum list of things you should know about the signal that you wish to measure. Signal Frequency The center frequency of the carrier must be known to allow sensor frequency response compensation. Modulation Bandwidth If the signal is modulated, know the type of modulation and its bandwidth. -
Page 23: Pulse Mode
For periodic or pulsed signals, it is often necessary to analyze the power for a portion of the waveform, or a certain region of a pulse or pulse burst. For these applications, the RFM3000 Series has a triggered Pulse mode. -
Page 24: Statistical Mode
Getting Started Pulse mode is best for the following types of measurements: • Moderate signal level (above about -40 dBm except when modulation is off). • The signal is periodic. • A time snapshot of a single event is needed (minimum single-shot time is 200 nanoseconds). •... - Page 25 Getting Started CCDF CCDF with Cursor Menu Figure 3.3 CCDF In a non-statistical peak power measurement, the peak-to-average ratio is the parameter that describes the headroom required in linear amplifiers to prevent clipping or compressing the modulated carrier. The meaning of this ratio is easy to visualize in the case of simple modulation in which there is close correspondence between the modulating waveform and the carrier envelope.
-
Page 26: Operation
Operation This section presents the control menus and procedures for operating the RFM3000 in the manual mode. All the display menus that control the instrument are illustrated and accompanied by instructions for using each menu item. 4.1 Control Menus The menus that control the RFM3000 RF are accessed from the top-level MAIN menu. Display the MAIN menu by selecting the icon on the display. -
Page 27: Menu Reference
Operation 4.3 Menu Reference 4.3.1 Main Menu To open the Main menu press the icon. The Main Menu shown in figure is the top most menu level from which all other menus originate. Measure > Display > Stat. Mode > Channel >... -
Page 28: Measure
Operation 4.3.2 Measure > To enter the Measure menu: Press the icon then select the Measure menu. The available setting vary depending on the mode selected. See figure to view the available settings in each menu. Measurement Toogle the state of the data acquisition mode for taking measurements. If Measurement is set to Run, the RFM3000 immediately begins taking measurements (Continuous and Statistical modes), or arms its trigger and takes a measurement each time a trigger occurs (Pulse Mode). -
Page 29: Display
Operation 4.3.3 Display > To enter the Display menu press the icon then select the Display menu. View Toogle between Text and Graph view. Text view displays a table of measurements for the current measurement mode. In Continuous mode, selecting Text displays the enabled channel power as shown in figure 3.1. -
Page 30: Channel
Operation Stat. Gating Select Freerun or Markers gating for statistical acquisition. If Freerun is selected, all the samples are acquired without regard of sweep acquisition. If Markers are selected, then only samples within the time marker interval on the Pulse mode triggered sweep will be included in the statistical sample population. -
Page 31: Channel Settings
Operation 4.3.6 Channel Settings To enter the Channel menu press the icon then select the Channel > Channel # menu. Chan Enabled Toggle the display of the trace and measurements for the selected channel. The chan- nel may still be used as a trigger source when set to Off. Vert Scale Set the power or voltage vertical axis level for the trace display based on the untis as shown in table... - Page 32 Operation Units Select the channel units. The trace may be shown in units of dBm, Watts, or Volts. The Units selection determines the range of the scale values and also affects displayed text and measurement values. Freq. Corr Sets the measurement frequency for the RF signal that is applied to the sensor for the current measurement. The appropriate frequency calibration factor from the sensor’s calibration table will be interpolated and applied automatically.
- Page 33 Operation Peak Hold Set the operating mode of the selected channel’s peak hold function. When set to OFF, peak values are not held. When set to instantaneous (INST) instantaneous peak readings are held until reset by a new acquisition or cleared manually.
-
Page 34: Time
Operation 4.3.7 Time > To enter the Time menu press the icon then select the Time tab. Timebase Controls the timebase, horizontal scale, of the Trace View. The Timebase pulldown menu permits selection of fixed timebase ranges from 5 ns/div to 50 ms/div (sensor series dependent) in a 1-2-5 progression. - Page 35 Operation from 0 to 20 dB, then the offset-adjusted trigger level will be displayed to the user as 30 dBm. Likewise, the maximum trigger level range will be extended to 40 dBm. The trigger level set point and setting range are both shifted upward by 20 dB.
-
Page 36: Pulse Def
Operation Markers > To enter the Markers menu press the icon then select the Markers > tab. Marker # Set the time position of marker 1 or 2 relative to the trigger. Note that time markers must be positioned within the time limits of the trace window in the graph display. If a time outside of the display limits is entered, the marker will be placed at the first or last time position as appropriate. - Page 37 Operation Distal Sets the pulse amplitude percentage that defines the end of a rising edge or beginning of a falling edge transition. Typically, this is 90% voltage or 81% power relative to the top level of the pulse. This setting is used when making automatic pulse risetime and falltime calculations.
-
Page 38: Favorites
Operation 4.3.11 Favorites > To enter the Favorites menu press the icon then select the Favorites > tab. This function is not fully implemented at this time). Enables the user to setup a customized menu to allow grouping frequently used menu items into one convenient menu. 4.3.12 System >... - Page 39 Operation I/O Config > To enter the I/O Config menu press the icon then select the System > I/O Config > tab. The RFM3000 supports remote communication over LAN and GPIB (optional). GPIB Address Set and View the current GPIB address in use for instruments equipped with GPIB option.
- Page 40 Operation Calibration > To enter the Calibrator menu press the icon then select the System > Calibrator > tab. Cal Output Enable/disable the output of the built-in 0 dBm 50 MHz test source. Note: The built-in test source of the RFM3000 is not a sufficiently calibrated source for per- forming a fixed calibration.
- Page 41 Operation Update Software To view the Update Sofware option press the icon then select the System > tab. Update Software Select Go to search the connected USB drive for the *.tar software update file and up- date or re-install the version found. If no valid file is found, the dialog in figure 4.27 appears.
-
Page 42: Application Notes
Application Notes This section provides supplementary material to enhance your knowledge of the RFM3000 operation, advanced fea- tures, and measurement accuracy. Topics covered in this section include pulse measurement fundamentals, automatic measurement principles, and an analysis of measurement accuracy. 5.1 Introduction to Pulse Measurements 5.1.1 Measurement Fundamentals The following is a brief reaview of the power measurement fundamentals. - Page 43 Application Notes Figure 5.1 Pulsed RF Signal Figure 5.2 Distorted Pulsed Signal Peak Power The RFM3000 makes power measurements in a manner that overcomes the limitations of the pulse power method and provides both peak power and average power readings for all types of modulated carriers. The fast-responding diode sensors detect the RF signal to produce a wideband video signal, which is sampled with a narrow sampling gate.
-
Page 44: Diode Detection
Application Notes 5.1.2 Diode Detection Wideband diode detectors are the dominant power sensing device used to measure pulsed RF signals. Several diode characteristics must be compensated to make meaningful measurements. These include the detector’s nonlinear ampli- tude response, temperature sensitivity, and frequency response characteristic. Additional potential error sources include detector mismatch, signal harmonics, and noise. - Page 45 Application Notes Temperature Effects The sensitivity of microwave diode detectors (normally Low Barrier Schottky diodes) varies with temperature. However, ordinary circuit design procedures that compensate for temperature-induced errors adversely affect detector bandwidth. A more effective approach involves sensing the ambient temperature during calibration and recalibrating the sensor when the temperature drifts outside the calibrated range.
-
Page 46: Pulse Definitions
Application Notes 5.1.3 Pulse Definitions IEEE Std 194™-1977 Standard Pulse Terms and Definitions “provides fundamental definitions for general use in time domain pulse technology.” Several key terms defined in the standard are reproduced in this subsection, which also defines the terms appearing in the RFM3000 text mode display of automatic measurement results. 5.1.4 Standard IEEE Pulse The key terms defined by the IEEE standard are abstracted and summarized below. -
Page 47: Automatic Measurements
Application Notes Term Definition Base Line The two portions of a pulse waveform which represent the first nominal state from which a pulse departs and to which it ultimately returns. Top Line The portion of a pulse waveform which represents the second nominal state of a pulse. First Transition The major transition of a pulse waveform between the base line and the top line (com- monly called the rising edge). -
Page 48: Automatic Measurement Terms
Application Notes 5.1.7 Automatic Measurement Terms The following terms appear in the RFM3000 Text display in Pulse mode. The Text column lists the abbreviated forms that appear on the display screen. Text TERM DEFINITION Width Pulse Width The interval between the first and second signal crossings of the mesial line. Rise Risetime The interval between the first signal crossing of the proximal line to the first... -
Page 49: Automatic Measurement Sequence
Application Notes 5.1.8 Automatic Measurement Sequence The automatic measurement process analyzes the captured signal data in the following sequence: 1. Approximately 500 samples of the waveform (equivalent to one screen width) are scanned to determine the maximum and minimum sample amplitudes. 2. - Page 50 Application Notes 6. If the signal is Type 0, (No crossings detected) no measurements can be performed and the routine is terminated, pending the next reload of the data buffers. 7. The process locates the bottom amplitude (baseline) using the IEEE histogram method. A histogram is generated for all samples in the lowest 12.8 dB range of sample values.
- Page 51 Application Notes Item Mesial value 10.0 10.0 Sample n Sample n+1 11.0 12.6 Table 5.4 Interpolation Crossing The interpolated crossing time, �� , is calculated from: �� �� − �� ������ �� �� = �� �� �� �� − �� ��+1 ��...
-
Page 52: Average Power Over An Interval
Application Notes 5.1.9 Average Power Over an Interval 13. The average power of the signal over a time interval is computed by: summing the sample powers in the interval dividing the sum by the number of samples This process calculates Pulse Power, Average Power, and the average power between markers. Since each sample represents the power in a finite time interval, the endpoints are handled separately to avoid spreading the interval by one-half pixel at each end of the interval (see figure ??). -
Page 53: Statistical Mode Automatic Measurements
Application Notes 5.1.10 Statistical Mode Automatic Measurements When operating in Statistical mode, the RFM3000 has a unique text format display that is available when the TEXT/GRAPH system key is pressed. A sample of the text display is shown in figure 5.8. Figure 5.8 Statistical Mode Text Display In the Statistical mode the following five automatic measurements are displayed in the RFM3000 Text display for both input channels and both trigger channels. -
Page 54: Measurement Accuracy
Application Notes The following six cursor measurements display the set position (independent variable) and measured value (dependent variables) where the movable cursor intersects the measurement trace. The position or value measurement text for each dependent variable is displayed in the color of its channel. The independent variable is white. -
Page 55: Maintenance
Maintenance This section presents procedures for maintaining the RFM3000. 6.1 Safety The RFM3000 has been designed in accordance with international safety standards, general safety precautions must be observed during all phases of operation and maintenance. Failure to comply with the precautions listed in the Safety Summary located in the front of this manual could result in serious injury or death. -
Page 56: Lithium Battery
Maintenance 6.4 Lithium Battery The RFM3000 contains one Lithium “coin cell” battery to provide for non-volatile storage of the instrument state. This is located on the Main Printed Circuit assembly. It should have a life of 5-10 years. When replacement is necessary, the battery must be disposed of in strict compliance with local environmental regulations. -
Page 57: Service Information
Service Information Warranty Service: Please go to the support and service section on our website at bkprecision.com to obtain an RMA #. Return the product in the original packaging with proof of purchase to the address below. Clearly state on the RMA the performance problem and return any leads, probes, connectors and accessories that you are using with the device. -
Page 58: Limited Three-Year Warranty
LIMITED THREE-YEAR WARRANTY B&K Precision Corp. warrants to the original purchaser that its products and the component parts thereof, will be free from defects in workmanship and materials for a period of three years from date of purchase. B&K Precision Corp. will, without charge, repair or replace, at its option, defective product or component parts. Returned product must be accompanied by proof of the purchase date in the form of a sales receipt.
Need help?
Do you have a question about the RFM3000 Series and is the answer not in the manual?
Questions and answers