
Related Manuals for Spectradyne nCS1


Summary of Contents for Spectradyne nCS1
- Page 1 Spectradyne nCS1 Operation Manual © Spectradyne LLC www.NanoparticleAnalyzer.com...
-
Page 2: Table Of Contents
Contents The nCS1 Instrument: Overview & Specifications ....................5 Specifications ................................5 Instrument Setup and Sample Prep ......................... 6 Setting up the nCS1 ..............................6 Cleaning Cartridge ..............................6 Calibration Sample and First Run ......................... 6 Loading the Cartridge ............................... 7 Load the Analyte into the Cartridge ....................... - Page 3 Prepare the Next Cartridge for Analysis (if continuing with measurements)....... 20 Remove the Used Cartridge ..........................20 Insert the Next Analysis Cartridge (if continuing with measurements) .......... 20 nCS1 Shutdown Procedure ..........................20 Run Instrument Shutdown Routine......................20 Turn Off Power to the Instrument ........................ 20 Buffer Maintenance ..............................
- Page 4 Combine multiple Stats files into a single Combined file ............34 Compare Multiple Analyses ......................34 Data Export ................................36 Cartridge Size and Concentration Coverage ..................... 38 More Information and Technical Support ......................38 © Spectradyne LLC, All rights reserved Version 2.5.0 Revision 3, July 2020...
-
Page 5: The Ncs1 Instrument: Overview & Specifications
The nCS1 is a powerful tool for obtaining detailed size and concentration information about particle distributions in liquids. The core technology utilized in the nCS1 is called Resistive Pulse Sensing (RPS), also referred to as the Coulter Principle, and is a truly orthogonal method to both light scattering methods such as dynamic light scattering (DLS) or nanoparticle tracking analysis (NTA) as well as to resonant mass measurement (RMM) techniques. -
Page 6: Instrument Setup And Sample Prep
Unpack: Remove all packaging from the instrument and position it on the benchtop. Power supply: Use the power cable provided with the instrument to connect the nCS1 to a source of electrical power (North America: 110V, 5A, 60 Hz; Europe: 230V, 16 A, 50 Hz). The power input connection is located on the back panel. -
Page 7: Loading The Cartridge
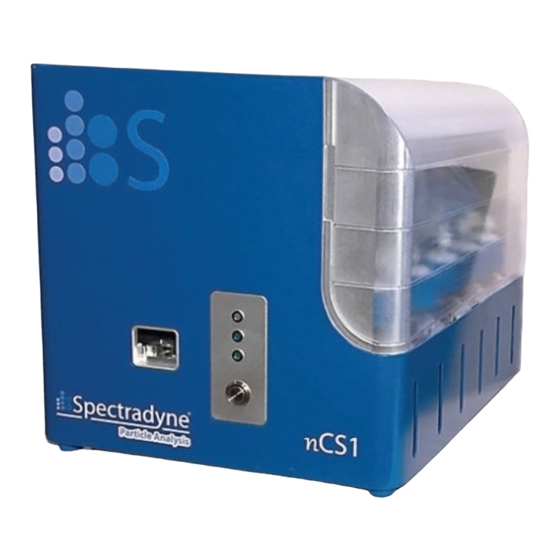
Figure 3. Left: The sample pipetted into the analysis cartridge. Right: The front panel of the Spectradyne nCS1: On the left side is the cartridge insertion socket (Hardware Version 1), and on the right are the cartridge engage button and indicator lights. - Page 8 ➢ The middle indicator light (blue), and the button ring light (blue) on the front panel of the instrument must be illuminated before proceeding. ➢ Press the cartridge engage button on the front of the nCS1 to raise the cartridge into the instrument. The top indicator light (white) will illuminate to indicate that the stage has reached the top of its range of motion and that the cartridge is ready for priming.
-
Page 9: Ncs1 Control And Data Acquisition Software
Control and Data Acquisition Software Software Startup Starting up the software after the instrument is powered on. The ‘nCS1 Status’ bar displays important messages and running processes during a measurement run. Enter Run Details Description of fields (see Figure 5): ➢... -
Page 10: Initializing The Cartridge
Is there insufficient conductivity and/or surfactant in the ▪ sample? Is the sample too highly concentrated? ▪ ❖ There may be an issue with the cartridge: Try measuring the sample in a new cartridge. ▪ © Spectradyne LLC, All rights reserved Version 2.5.0 Revision 3, July 2020... -
Page 11: Acquisition Control
➢ Raw data files are saved to the folder specified by the user in the Run Details frame. ➢ Raw data file names have the following format: ❖ <prefix>_YYYYMMDD_NNNN.h5 ➢ Record significant acquisition numbers in your notes for future reference. © Spectradyne LLC, All rights reserved Version 2.5.0 Revision 3, July 2020... -
Page 12: Balance Monitor
➢ Flagged acquisitions are highlighted blue in the Viewer software for rapid identification (refer to the Data Analysis and Viewer Software section on page 22 of this guide). © Spectradyne LLC, All rights reserved Version 2.5.0 Revision 3, July 2020... -
Page 13: Utilities
➢ Press the “Clear Constriction” button (Figure 9) and wait for the routine to complete. ➢ Continue acquisitions as normal (press “Continuous” on Acquisition panel). © Spectradyne LLC, All rights reserved Version 2.5.0 Revision 3, July 2020... -
Page 14: Instrument Shutdown
Instrument Shutdown This automatic sequence flushes the internal fluid lines of the nCS1 and subsequently prepares the instrument for shutdown. It requires a reusable cleaning cartridge and deionized water. ➢ Press the “Instrument Shutdown” button (Figure 9) to begin the automated process. -
Page 15: Manual Pressure Control
The Manual Pressure Control Frame allows individual pressure setting at each port on the cartridge. ➢ IMPORTANT: ❖ These controls should only be used after consultation with a Spectradyne technician ❖ P1 IN port must always have the higher pressure setting than the rest of the ports ➢... -
Page 16: Bias Setting
Figure 11. Bias and Sensors frames. Bias Setting ➢ IMPORTANT: ❖ These controls should only be used after consultation with a Spectradyne technician ➢ Negative and positive voltage bias can be changed by entering values (-6.0 V to +6.0 V) in their corresponding boxes (see Figure 11). -
Page 17: Finish Priming Manually
➢ This is an advanced user feature and special training is required—please contact Spectradyne’s support team for more details (support@spectradynellc.com) Run Cleaning Cartridge Only This automatic sequence flushes the internal fluid lines of the nCS1 and requires a reusable cleaning cartridge. ➢ Click the “Run Cleaning Cartridge” button and follow the prompts. -
Page 18: The Auto-Analysis Engine
Automatic Processing of Raw Data ➢ Flagged acquisitions (of raw data, see Figure 8) are placed in the Auto-analysis Engine queue for automatic processing into Spectradyne Stats files. ➢ Raw data is processed using standard parameters (refer to page 25 for details): o Peak Detection Threshold: 3.0 x the standard deviation of the baseline noise. -
Page 19: Live Csd - Quantitative Real-Time Data Analysis
No peak filtering is applied if the ‘Auto-filter’ box is not checked—false positive detection events may be included. For more in-depth data analysis use the Data Viewer (page 22). © Spectradyne LLC, All rights reserved Version 2.5.0 Revision 3, July 2020... -
Page 20: After Data Acquisition
➢ After completion of the End Run routine, lower the stage by pressing the button on the front panel of the instrument and remove the cartridge. ➢ The nCS1 is now ready for the next measurement run—load a new cartridge for analysis. Insert the Next Analysis Cartridge (if continuing with measurements) ➢... -
Page 21: Buffer Maintenance
Once the best sample prep for the analyte in question is determined, that procedure can be used for future analyses of that analyte and its variations. The parameters below are suggested targets for first-run samples. For further details on method development, please contact Spectradyne’s support team at support@spectradynellc.com. Optimal sample parameters:... -
Page 22: Data Analysis And Viewer Software
➢ This step yields the final CSD for the collection of measurements. 3. Combine & Compare: ➢ The collection of refined Spectradyne Stats files is saved as a single combined file. ➢ The CSDs of different samples are quantitatively compared at the combined file level. -
Page 23: Data Viewer Software User Interface
Data Viewer Software User Interface Figure 15. Overview of the Spectradyne Viewer software user interface. © Spectradyne LLC, All rights reserved Version 2.5.0 Revision 3, July 2020... -
Page 24: Select & Process Raw Data
In a typical workflow, data to be used in analysis will have been flagged at the time of acquisition and processed into Spectradyne Stats files by the Auto-analysis Engine (see page 18). In such a scenario, the user may skip to the section, “Viewing the Results of Raw Data Processing” on page 26, below. -
Page 25: Processing Raw Data
Each raw data file is analyzed to count and measure particles detected during acquisition. The result of this analysis is a Spectradyne Stats file that contains detailed information about all particles detected during the acquisition as well as the acquisition itself. -
Page 26: Viewing The Results Of Raw Data Processing
Ensure that the Stats files of interest are loaded into the Currently Loaded files list. Concentration Spectral Density (CSD): ➢ The nCS1 is capable of very high resolution size and concentration measurements of particles in a liquid, and is well suited for characterizing and comparing subpopulations of particles in polydisperse mixtures. - Page 27 ❖ Clicking on the peak (at sufficiently high zoom) displays the details of the peak measurement (Figure 16). ❖ Ctrl + Click selection allows concurrent display of multiple peak measurements. © Spectradyne LLC, All rights reserved Version 2.5.0 Revision 3, July 2020...
- Page 28 ➢ CSDs corresponding to measurements of the same sample should be consistent with each other—any outliers should be removed from the Currently Loaded list using the red “X” button below the list. © Spectradyne LLC, All rights reserved Version 2.5.0 Revision 3, July 2020...
-
Page 29: Refine & Filter
The Spectradyne Viewer provides efficient tools for working with multiple Stats files as a group, and after the ©... -
Page 30: 2.1 Refine The Diameter And Concentration Scaling Of The Csd
Note: Treating multiple datasets as one for Refine and Filter ➢ In the QuickView Processed Data frame of the Spectradyne Viewer, use the Combined plot mode to display data from all the loaded Stats files as a single dataset. - Page 31 Note: The loaded values displayed for a saved calibration state need to be applied to be effective! o Under ‘Entire State’, click ‘Selected’ or ‘All’ to apply the loaded values to a single selected file or to all files. © Spectradyne LLC, All rights reserved Version 2.5.0 Revision 3, July 2020...
-
Page 32: 2.2 Filter The Set Of Detected Particles To Exclude False Positives
750 us. A red point highlights the peak value, and the red line shows the fit for each peak. Peak-filtering tools are available in the Viewer for identifying and removing false positives in the data. © Spectradyne LLC, All rights reserved Version 2.5.0 Revision 3, July 2020... - Page 33 (blue). False positive detection events are characterized in part by having diameter close to the minimum detectable size for the cartridge (here approx. 130 nm) and a broad distribution of transit times. © Spectradyne LLC, All rights reserved Version 2.5.0 Revision 3, July 2020...
-
Page 34: Combine Multiple Stats Files Into A Single Combined File
➢ Load the desired Stats files into the Currently Loaded files list ➢ Navigate to the Peak Filtering tab of the Spectradyne Viewer ➢ Use the appropriate action buttons in the Filters frame of the Peak Filtering tab to apply and remove existing filters as desired from files in the Currently Loaded file list. -
Page 35: Combine And Compare
➢ Load the analyses of interest into the Currently Loaded file list. ➢ In the QuickView Processed Data frame of the Spectradyne Viewer, select Plot Mode Multi. ➢ Use the tools in the Data Visualization and Quantification tabs of the Viewer to make quantitative comparisons of the analyses. - Page 36 Subtract CSDs ➢ View and export the subtraction of one CSD from another (e.g., subtract a ‘blank’) ➢ See the Data Export section on page 36 for more details. © Spectradyne LLC, All rights reserved Version 2.5.0 Revision 3, July 2020...
-
Page 37: Data Export
➢ Click the “Integration Range Report” button in the export frame. ➢ Specify the desired export options. ➢ Click “Export” and specify a file name and save location for the report. © Spectradyne LLC, All rights reserved Version 2.5.0 Revision 3, July 2020... - Page 38 ➢ For CSV format, the selected file is exported to a single sheet in a file named <original stats filename>.csv. CSD data is placed below the metadata in the sheet. © Spectradyne LLC, All rights reserved Version 2.5.0 Revision 3, July 2020...
-
Page 39: Cartridge Size And Concentration Coverage
Cartridge Size and Concentration Coverage A more up-to-date cartridge size coverage may be found on our website. © Spectradyne LLC, All rights reserved Version 2.5.0 Revision 3, July 2020... -
Page 40: More Information And Technical Support
More Information and Technical Support More detailed information on the operation of the nCS1 and its software can be obtained by sending email to support@spectradynellc.com. At Spectradyne we are eager to help with your particle analysis. Please contact us for help with specific measurement challenges and for help with the analysis of specific particle populations.
Need help?
Do you have a question about the nCS1 and is the answer not in the manual?
Questions and answers