
Related Manuals for AEA Technology Liberator Series


Summary of Contents for AEA Technology Liberator Series
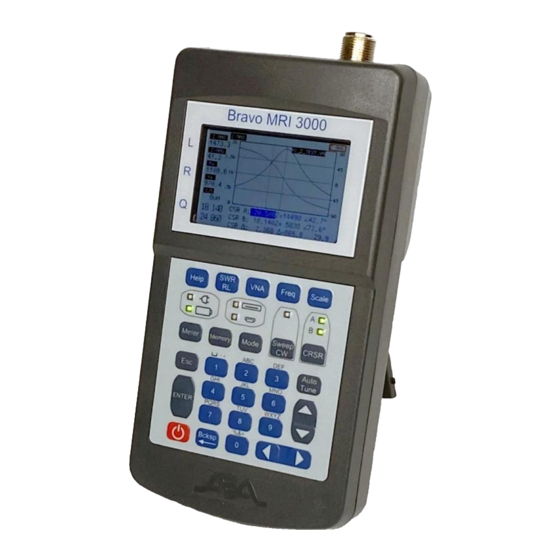
- Page 1 Operation Manual Liberator Series Bravo EX2 Analyzer Testing Made Simple! Technology, Inc.
-
Page 2: Proprietary Information
© 2021 by AEA Technology, Inc. All rights reserved. This document and all software or firmware designed by AEA Technology, Inc. is copyrighted and may not be copied or altered in any way without the written consent from AEA Technology, Inc. -
Page 3: Warnings
Use in such applications is not recommended If you have any questions concerning the use of the EX2 Analyzer or other AEA Technology, Inc. instruments please contact us at:... -
Page 4: Battery Precautions
The SWR Site Analyzer is designed to be safely operated in normal testing environments. If you have any questions concerning the use of the Site Analyzer or other AEA Technology, Inc. instruments please contact us Tel: 1-800-258-7805 or +1-760-931-8969 or Fax: +1-760-931-8969... -
Page 5: Bravo Ex2 Literature Introduction
BRAVO EX2 Literature Introduction There are two literature items available for the EX2 Analyzer: Quick Start Guide is a laminated tri-fold held in the Belt Case’s inside pocket. This provides a light- weight condensed guide to calibration, measurement functions and menus Operator Manual instructional guide which has three purposes: Gives a concise description of the instrument, keypad, menus and measurement screens. -
Page 6: Table Of Contents
Table of Contents Proprietary Information ............................i WARNINGS ................................ii DC Port and A/C Adapter ..........................ii Coax Test Ports ............................... ii Operating Precautions ............................. ii Batteries ................................ii Cleaning ................................ii Battery Precautions ............................iii Electrostatic Discharge (ESD) Precautions ....................iii If this instrument does become subject to ESD, be advised that the instrument may reset itself in this event, and re-entry of the sweep parameters may be necessary. - Page 7 Mode Menu..............................10 . 11 VNA MODE ............................11 CALIBRATIONS ............................ 11 BROADBAND CAL ..........................11 SYSTEM Z0 ............................12 GRID LINES ............................12 MORE OPTIONS ........................... 12 OTHER OPTIONS Menu ..........................13 RLC MODEL ............................13 SWEEP ENABLE ..........................13 MEMORY OPERATIONS ..........................
- Page 8 Saving Traces ............................33 Exporting .s1p and .s2p Trace Data ...................... 34 Check Connection ..........................34 Instrument File Management ......................... 34 Warranty, Maintenance, and Troubleshooting Guides ..................37 Limited Warranty ............................37 Maintenance ..............................37 Battery Replacement Instructions........................37 Cleaning ................................ 38 Instrument Troubleshooting Guide ........................
-
Page 9: Ex2 Analyzer Description
EX2 Analyzer Description General The BRAVO EX2 analyzer measures complex impedances of electrical components. The results of the measurements are displayed graphically, with some numeric detail. You may choose to display the impedance from among several formats. The BRAVO EX2 sweeps across a range of frequencies, or operates at CW, either way the display is continuously updated with new measurement results. -
Page 10: Screen Layouts
Instrument Top Panel Layout Screen Layouts General The BRAVO EX2 has three operating modes, VNA, SWR/RL and S21 (two-port). The elements of these screens will be described here. Shown below is the VNA screen layout: VNA Screen Features of interest are as follows: Left &... -
Page 11: Swr & Return Loss Screen
Displayed Frequency Range: Displayed in the lower left of the screen, they indicate the frequency endpoints displayed on the chart. When there are no cursors enabled, the upper frequency is displayed near the lower right corner of the chart. Cursor Frequency: For each cursor enabled, the cursor's frequency is displayed as shown. In the above illustration, the cursor frequency is displayed highlighted-- indicating that it is selected, and that its cursor can be moved using the LEFT &... -
Page 12: Keypad Operations
POWER ON – Press the ON/OFF key for one second. A splash screen with AEA Technology’s logo and Version information will appear for several seconds. It will then open to the test screen in use at the time it was normally or automatically powered down. -
Page 13: Menu Keys
Menu Keys These keys bring up the Meter Settings, Options settings, and Memory Operations menus, respectively. For details, please refer to the Menus section, on page 8. Function Keys Help Key The Help key has two modes of operation; First, if no function keys are active (CRSR, FREQ, etc.) and no menus are open, pressing Help will open the help information for the displayed Measurement Screen. -
Page 14: Scale Key
SCALE Key The Scale key is used to cycle through preset vertical scales on the measurement screens. SWR and RL have only one scale on the left side of the plot. Repeated presses will present the next scale range in the cycle. See Section 3 Measurement screens for more information on selecting and changing Scales. - Page 15 The Auto Tune key works slightly differently in SWR/RL and in VNA mode, but in both cases it will only function if at least one cursor is enabled. In SWR and RL, pressing Auto Tune will cause the selected cursor to seek to the LOWEST point on the graph. In VNA Mode, the cursor will seek to the highest impedance point on the graph.
-
Page 16: Menus
Menus Menu Navigation The Bravo EX2 uses two types of menus; The first is simply a list of items to select. The second uses two columns: A list of options, settings, etc. in the left column, each with a selection or setting in the right column. -
Page 17: Keypad Beep
This allows you to adjust the color of the various items on the BRAVO EX2's screen. When any item on this menu is selected, you can use the (left and right arrow) buttons to select the color for that item from a palette of 16 colors. Color-settable items are: TRACE A –... -
Page 18: Date/Time
In addition to the above settings, are three indicators: ERT: This is the estimated run time remaining for the remaining charge on the batteries. When the unit is plugged in, the percent charge is displayed here. BATTERY STATUS: Cells total voltage and Current draw are displayed. As the battery voltage decreases, the current draw will increase. -
Page 19: Vna Mode
The items on this menu are: VNA MODE This option will allow you to select the operating mode for the VNA function of the instrument. There are two possible selections (use the button): S11 - This enables single-port impedance analysis, including impedance magnitude and impedance phase. -
Page 20: System Z0
SYSTEM Z0 Allows the setting of the BRAVO EX2's reference impedance (Z0) to something other than 50Ω (which is the default). This is to be used on systems that do not use a Z0 of 50Ω. Reasonable values can range from (but are not limited to) 15Ω to 300Ω. GRID LINES Pressing <ENTER>... -
Page 21: Other Options Menu
OTHER OPTIONS Menu This menu is accessed via the BRAVO EX2's OPTIONS menu. It allows the setting of some of the less frequently used settings. RLC MODEL This sets the circuit configuration to use when calculating the equivalent inductance or capacitance of the circuit under test. -
Page 22: Recall Settings
RECALL SETTINGS Press ENTER to open a list of saved instrument setting files. NOTE: When SAVE SETTINGS is invoked, the entire instrument state is saved-- This INCLUDES the current calibration, if FREQUENCY-SPECIFIC calibrations are in use! These appear as files with the .SET extension. -
Page 23: Swr Screen
Cursors can be used to get measurements anywhere on the displayed trace. Cursors are enabled by pressing the CRSR key. It is possible to have one or two cursors on the screen at once. Pressing the CRSR key the first time will enable the first cursor (CRSR A), pressing CRSR again will enable the second (CRSR B). -
Page 24: Cw - Continuous Wave Screen
CW – Continuous Wave Screen Sweep/CW key opens this mode Center Frequency is at the top Use FREQ screen to change frequency UP/DOWN arrow keys scroll through 2 pages of results Press Sweep/CW key again to exit to last testing mode (Sweep mode will be restored upon exiting). -
Page 25: Bravo Ex2 Vna Measurements
Pressing ENTER after the Load is attached completes the calibration process for single-port measurements, and will return the BRAVO EX2 to the previously selected measurement screen. For two-port (S21) measurements, a fourth prompt screen will prompt you to attach a through cable from S11 to S21 before finishing. -
Page 26: S21 (Two-Port) Vna Screen
S21 (Two-Port) VNA Screen The S21 VNA Screen shown above illustrates how the BRAVO EX2's Two-port capabilities can be used to analyze a two-port device; in this case, a low pass filter. Unlike for a single-port measurement, the parameters measured cannot be changed: This always displays GAIN and PHASE (although, the phase trace can be turned off). -
Page 27: Broadband Calibration Process
Frequency Specific Calibration is performed with any frequency selection or adjustment of the Start, Stop, Center Frequency or Span. The advantage of Frequency Specific Calibration is it provides the maximum accuracy possible by the BRAVO EX2. The disadvantage is that it requires a recalibration process with any frequency change. - Page 28 Press ESC to exit to the Frequency Specific Calibration Screens First prompt will be to attach: OPEN. As said previously the open N connector, adapter, or test lead will generally suffice, although using the OPEN cal standard will yield the most consistent results.
-
Page 29: Swr (Standing Wave Ratio A.k.a. Voltage Standing Wave Ratio-Vswr)
SWR (Standing Wave Ratio a.k.a. Voltage Standing Wave Ratio-VSWR) SWR is a measurement of impedance matching of loads to the characteristic impedance of a transmission line or waveguide. Impedance mismatches result in standing waves along the transmission line. SWR is defined as the partial standing waves’ amplitude at an antinode (maximum) to the amplitude at a node (minimum) along the transmission path. -
Page 30: Swr And Return Loss Measurement Steps
The above equation will return a positive dB value. Historically, most instruments are designed to show Return Loss as a negative dB value. This requires taking the ratio of reflected to incident power as in the modified equation shown below: RL’(dB) will be a negative value. -
Page 31: Pc Vision
PC Vision™ Abstract PC Vision™ is the companion windows application for your Bravo EX2 Analyzer. Besides allowing for remote operation of your BRAVO EX2, it also contains tools and utilities to help you get the most out of your instrument. Installing PC Vision PC Vision™... - Page 32 Under certain circumstances, the PC-Vision application may not be successful in connecting to your instrument. This is most likely to happen when there are USB to RS232 adapter cables, or similar devices already attached to your PC. In this case, the status indicator will remain red: If this occurs, you may have to attach the instrument manually.
-
Page 33: Display Screen
Display Screen There are two main areas of the PC-Vision display: The control/settings area, and the measurement/display areas. The control/settings area fills the upper portion of the screen. This is where you specify test conditions such as frequency and span, and test options such as sweep speed. The measurement/display area takes up the rest of the screen. -
Page 34: S11 Single-Port Operation
With the frequency information entered, and the sweep rate selected, it’s time to calibrate the instrument. To do this, requires three reference standards: An OPEN, a SHORT, and a reference LOAD. For most applications, especially for frequencies of less than 200MHz or so, the OPEN is not too critical and many users do not use anything for this. - Page 35 (if calibration has not already been completed you will be prompted to do so) ...and the measured results of the UUT (unit under test) will be drawn on the graphs as shown here:...
-
Page 36: Graphs In Detail
Graphs in Detail Now that we have a ‘live’ measurement display running, we can examine the displayed charts in detail. When first started, the cursors (one on each chart) may or may not be present. The cursor will appear by clicking your mouse anywhere on the chart. The cursor will appear wherever you click on the chart. -
Page 37: Z-Plot
Another right-click on the chart will cause all charts to be displayed once again. Z-Plot Shown here is the Z-Plot, it graphs the UUT's S11 impedance, and phase angle, resistance or reactance. The scales on both sides can be adjusted for best viewing. Smith Chart The Smith Chart display allows you to easily visualize the UUT's S-Parameter characteristics. -
Page 38: Limit Lines
Limit Lines The Limit Line feature allows the user to perform quick go/no-go testing on tunable resonators. The Limit lines can be enabled independently of each other by checking the appropriate box, and entering the desired test limit as shown here: Note that limit lines only apply to the SWR and RL charts. -
Page 39: S21 (Two-Port) Operation
S21 (Two-port) Operation Two port or S21 operation is used if you are testing a two-port device, such as a filter or an attenuator. Calibration is also required in this case, and it is very similar to the procedure used for the single-port measurement. -
Page 40: Naming Your Chart
Naming Your Chart Each chart displayed on the screen has a default header, describing the measurement displayed. The default heading for the SWR chart is “SWR Plot”, for example. Any chart can be renamed by simply double-clicking on the title you wish to change, and this dialog will pop up, allowing you to make whatever changes you want. -
Page 41: Saving Traces
Saving Traces Now that we have ‘live’ traces on-screen, perhaps we would like to save these for future reference or further evaluation. PC Vision will allow you to save live traces in AEA's PC-Vision (.pcv) format, which includes the test data used to create the trace. Alternately, a graphic of the trace may be saved in any one of a number of graphic file formats, such as .jpg, .gif, or .pdf. -
Page 42: Exporting .S1P And .S2P Trace Data
Exporting .s1p and .s2p Trace Data Actual trace data mal also be exported (in standard .s1p and .s2p format) by selecting PC-Visions File menu, then selecting Export Trace Data: A save file dialog will appear as while saving a .pcv file, where you can name it, and write it to the directory of your choice. - Page 43 Any of these trace files can be loaded and displayed by PC Vision. Select the files you wish to download (holding down Ctrl, Shift or both will allow you to select multiple files), and click “DOWNLOAD”. PC Vision will then download your trace files to the AEA Technology folder in your Documents folder.
- Page 44 Select the file you want to display, click “Open” to view. Once downloaded from the instrument, you may decide you no longer need the trace file to remain on the instrument. From the file management window (shown earlier), select the file(s) you wish to delete, and click “Delete”.
-
Page 45: Warranty, Maintenance, And Troubleshooting Guides
ANY OTHER LEGAL THEORY. Remedies for any breach of warranty, either expressed or implied, are limited to repair, replacement, or return of the instrument, at the option of AEA Technology, Inc. Any warranty is valid for the original purchaser only. -
Page 46: Cleaning
5. Inspect the battery case for any signs of out-gassing (causing white or blue/green corrosion) on the contacts or in the battery case. If any is found use a cotton tipped swab and alcohol to clean the battery compartment and contacts thoroughly and dry before installing any new cells. Instrument damage due to out-gassing cells is NOT a manufacturer defect and repair is NOT covered under our warranty. -
Page 47: Instrument Troubleshooting Guide
Instrument Troubleshooting Guide Symptom Possible Issue Corrective Action No display, but “ON” Battery voltage too low Plug in AC adapter to operate on AC power LED is lit or install fresh batteries. Display is incorrect, or Firmware has faulted Force power down by holding down the menu highlight will not ON/OFF key for 10 seconds. -
Page 48: Specifications
Appendix A Specifications EX2 Analyzer Specifications 100KHz – 525MHz Frequency Range Tuning/Display Resolution 1Hz (100 KHz - 180MHz), 200Hz > 180MHz Refresh Rate 2.5 times/second 251 points Frequency Display 1.6ms / data point Measurement Speed Output Power -15 dBm @ 50 Ohms Ranges 2:1, 5:1, 10:1, 20:1, 40:1 &... -
Page 49: Ex2 Analyzer Model And Accessories
Appendix B EX2 Analyzer Model and Accessories Included items Part Number Bravo EX2 Analyzer 6053-1000 0070-1135 N Male Shorting Cap N Male 50 Ω Load 0070-1138 5001-0202CE AC Power Adapter 0070-1208 USB Cable A-to-mini B 5001-1002 Belt Case CD includes: Operating Manual, Training PPT and EX2 6053-1220 PC-Vision™... - Page 50 User’s Notes...
- Page 51 5933 Sea Lion Place, Suite 112 Carlsbad, California 92010 Tel: 1-800-258-7805 or +1-760-931-8979 Fax: +1-760-931-8969 www.aeatechnology.com...
Need help?
Do you have a question about the Liberator Series and is the answer not in the manual?
Questions and answers