Table of Contents
Advertisement
Advertisement
Table of Contents

Related Manuals for Optigene Genie III

Summary of Contents for Optigene Genie III
- Page 1 User Manual (Instrument Software Version v3.18.2)
- Page 2 In no event shall OptiGene Ltd. be liable for incidental, multiple, or consequential damages in connection with or arising from use of this document. Genie® III and its design is a registered trademark of OptiGene Ltd. or its subsidiaries in the UK and other countries.
-
Page 3: Table Of Contents
Table of Contents Run ........... 23 Quick Start ........23 SAFETY NOTICES ........ 3 Profile Screen ....... 23 To create a new profile ....24 SUPPORT ..........6 To load a saved profile ....25 How to obtain support....... 6 Active .......... -
Page 4: Safety Notices
Notices Using the instrument in a manner not specified by OptiGene may result in personal injury or damage to the instrument and the protection provided by the equipment may be impaired. - Page 5 The instrument is electrically powered. Please ensure that the correct voltage settings have been applied before applying power to the instrument. If in doubt consult a qualified electrician. The instrument has a rating label affixed to the rear. Please consult this if needed. Always disconnect the equipment before moving or removing any guards or covers.
- Page 6 Cleaning Method The Genie® III can be disinfected using the following procedure which can be used as a safety measure if this equipment is routinely exposed to bio-hazardous materials. 1. Wipe all outside surfaces of the Genie® III with a 10% bleach solution. 2.
-
Page 7: Support
For the latest services and support information go to http://www.optigene.co.uk/support.htm IMPORTANT! When directed to do so, contact OptiGene Ltd. to schedule maintenance or calibration of a Genie® III instrument. IMPORTANT! If a Genie® III instrument is kept in a very cold environment, the battery will not begin charging until the internal temperature has reached 15°C. -
Page 8: Box Contents
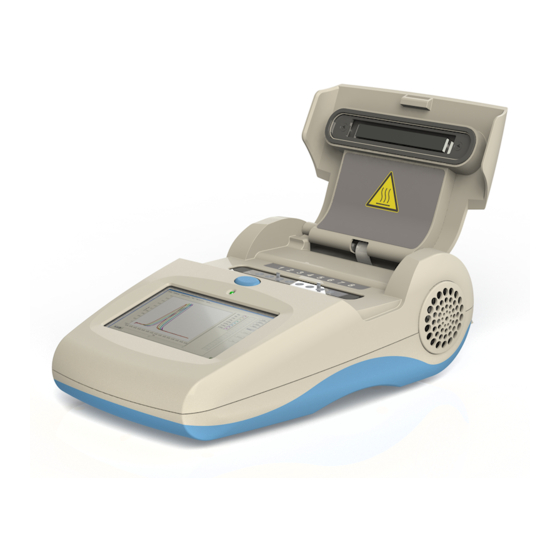
Chapter Chapter BOX CONTENTS The following is a list of contents in the box for Genie® III: Genie® III instrument Power supply Power lead USB connection lead Stylus USB memory stick containing Genie® Explorer and this manual as a ‘.PDF’ file Version 1.11... -
Page 9: Site Preparation
Chapter Chapter SITE PREPARATION HOW TO SET UP GENIE® III Genie® III has been designed to be used at point-of-care, and so not necessarily in a laboratory. When it is being used, the instrument should be placed on a level and stable surface and the surfaces surrounding the instrument must be clear of obstructions at all times. -
Page 10: Connections
CONNECTIONS Genie® III is ready to use straight out of the box without any external connections. It can be operated standalone, taking power from its internal battery. In order to charge the battery or to use Genie® III with a computer, some connections must be made. Connect the power supply plug into the back of the instrument and then attach the power cable to the supply. -
Page 11: Battery
BATTERY Genie® III has an internal rechargeable battery. When Genie® III is delivered the battery should be fully charged by the user. The battery monitor is on the status bar next to the block temperature reading. To see more details on the battery, press the battery icon and the monitor will appear as a pop- up in the bottom right hand corner of the screen. -
Page 12: Battery Monitor
BATTERY MONITOR The battery status can be seen but there is no pop-up. Here the pop-up shows that the battery is currently charging. Here the pop-up shows that the battery is fully charged. Here the pop-up shows that the instrument is discharging. Version 1.11... -
Page 13: Screen Brightness Control
SCREEN BRIGHTNESS CONTROL Next to the battery icon is the brightness control. Touch the icon and a slider will appear on the right hand side of the screen. Move the slider to the desired position. Press the icon again to remove the slider. It is not recommended to set the brightness at 100% for long periods of time, as this will significantly... -
Page 14: User Interface
Chapter Chapter USER INTERFACE Genie® III uses a touchscreen for viewing and inputting data. Touch the screen gently and press the appropriate keys when required. The touch screen can be operated while wearing protective gloves or by using the stylus included with the instrument. -
Page 15: Main Menu
MAIN MENU To start a predefined run, touch the name of the assay and it will begin. Alternatively, touch ‘Other…’ to create a new profile, or open a saved profile. To view profiles or data from previous runs touch the folder icon on the status bar. -
Page 16: Power
POWER These settings only apply when battery powered. Display dim time: how long the instrument waits without input before dimming the display. Display dim level: the brightness level the instrument will use after the specified idle time. Standby time: how long the instrument waits before turning off the display. -
Page 17: Wireless
WIRELESS GPS, WiFi & Bluetooth: Ticking the corresponding box will turn this feature on.* Click the View button next to GPS and the status will be shown, giving universal identities of time, latitude, longitude and the current satellites being used. How to use the WiFi is explained in chapter 7. -
Page 18: Touchscreen Calibration
Please contact OptiGene Ltd. if so on what to do next. Replay: This will replay a run file as if it were running in real-time Update: Allows updating of the instrument software (See Chapter 7). Admin: This allows Administrators to set up different levels of user access as well as language. -
Page 19: Lid Sensors
LID SENSORS Touching ‘Start’ on the screen will start the calibration. Follow the instructions at the top of the screen. Place Genie on a flat, level table, close the lid and press ‘continue’. Follow the instructions at the top of the screen. -
Page 20: Date And Time
The calibration is complete. The calibration can be tested by tilting the Genie in different directions. If done correctly, the green circle should remain inside the red circle as it moves around. Press ‘Okay’ to save the calibration or Cancel to disregard changes. DATE AND TIME Date: click in the white box for date and enter in the format DD/MM/YY. - Page 21 At end: At the end of a run, if the boxes are ticked, the Genie will automatically create a PDF report, a CSV (comma separated value) file, and print the result table to the connected printer (accessory). The separator of the CSV file can be set between a tab and a comma, depending on what is required, and the CSV data can be the results...
-
Page 22: Copy & Paste
calling and can change the buttons Administrator: The user will have full unrestricted access to all the instruments settings and can add users and set language. In order to log in to a certain level that may be above the default access level, the user can log in on the User tab in Settings. - Page 23 To paste: Touch the text box you wish to paste into, and then hold down on the box until a pop-up appears and select ‘Paste’. Version 1.11...
-
Page 24: Run
On Genie® III, there are two ways to start a run: either quick start, by touching one of the predefined profiles saved on the instrument (or an attached USB pendrive) or by creating a new profile. Predefined profiles that are saved on the instruments internal memory can be selected for quick start. -
Page 25: To Create A New Profile
TO CREATE A NEW PROFILE Press the ‘New’ button on the profile screen. Click the graph to adjust the profile by touching the appropriate temperature or time box. Once the required changes have been made, pressing the tick button will accept the changes. -
Page 26: To Load A Saved Profile
TO LOAD A SAVED PROFILE Pressing one of the quick start buttons on the main menu will pop-up a preview of the profile and give the user the choice to start, edit or cancel the run. Alternatively, press the ‘Other…’ button and a file browser will be displayed. - Page 27 Pressing the Result Calling Options button will display more options. This is further explained in Chapter 6. If no result calling is set up then the instrument will use pre-set defaults. WELL NAMES To assign names to the block wells, click on the well names area.
- Page 28 To change a well name, press on the text box and type a name and abbreviation if desired. ‘Next’ switches to the next name and saves the current well name. Pressing the return button on the keyboard or the green arrow returns to the run screen with changes saved.
-
Page 29: Active
ACTIVE Once a run is started, the software will go to the ‘Temperature’ screen initially. The other screens can be accessed using the tabs. PROFILE This shows the temperature profile that is running. At the top of this screen, there is a text box to edit the run description, a button to add notes about the run and a button to save the profile. -
Page 30: Amplification
STOP The ‘Stop’ button will abort a run in progress. A confirmation pop up box will prompt ‘Yes’ or ‘No’. AMPLIFICATION This shows the fluorescence data that is being acquired during the amplification phase of the experiment. ANNEAL This shows the fluorescence derivative data that is being acquired during the anneal phase of the experiment. -
Page 31: Results
SELECTION OF GRAPHS Pressing the well name on either the ‘Amplification’ or the ‘Anneal’ page cycles the state of the related curve on the graph between normal, highlighted and off. RESULTS This shows the results of the experiment. Each sample name is shown as well as amplification time and annealing temperature. - Page 32 An example of a generated report file. EXPORT TO CSV Pressing the button shown on the results page will generate a CSV (comma separated values) file with the results in and save it in the ‘Reports’ directory on the Genie instrument.
- Page 33 An example of a generated CSV file opening in Microsoft Excel. Any graph can have its data exported to a CSV file also by clicking on Export data in the Graph Options menu. PRINT RESULTS TABLE Pressing the button shown on the results table will print the table onto a label if the correct printer is attached to the Genie®...
-
Page 34: Additional Options
ADDITIONAL OPTIONS Touching the button shown on the amplification or anneal plots will show a drop down menu with some additional options. GRAPH OPTIONS Select Graph options Show grid: This will enable/disable the grid behind the plots Show points of interest: Enable/disable any dots on the plots that have been generated by the result calling. - Page 35 RESULT CALLING Result calling is explained in further detail in Chapter 6. BY WELL Selecting ‘By well’ will show all fluorescence plots by well rather than by fluorescence channel. This allows comparison of both channels at the same time. This can be reversed by the same process.
- Page 36 Step The data after step removal Slope The data after slope correction Normalised The data after normalisation The log of the normalised data. Ratio The ratio (dF/F) of adjacent points (after step removal). This plot is smoothed with an averaging filter. Derivative The gradient of the data (generated with a differentiating filter) 2nd Derivative...
-
Page 37: View
VIEW To view previous runs press the folder icon on the status bar. This will display a file browser window. All Genie® III runs are saved in the ‘LOG’ folder. To open, click on ‘LOG’ and then tick icon, or double press on the folder name. - Page 38 Each run is stored in a folder by date order: Year/Month/Day. The default filename for the each run is the instrument serial number followed by a sequential number. Select a file, then touch the tick button to load the file. To copy a file, touch the copy icon, shown with the green arrow.
- Page 39 To zoom out, touch on the plot area and drag to the left and/or up. A double press on the screen will zoom out to the full extent of the graphs. Version 1.11...
-
Page 40: Genie Result Calling
Chapter Chapter GENIE RESULT CALLING OVERVIEW Genie instruments can generate results according to detected amplification times, anneal peaks and other features. Due to the varying requirements of differing applications, setting up the parameters is highly flexible. Analysis is based on targets, where each target has its own set of parameters and possible results. -
Page 41: Target Parameters
This screen shows an overview of the ‘Detection targets’, showing the number of regions of interest, the number of results, and which targets are assigned to which well. From here new targets can be added, imported from other runs or profiles, edited or deleted. - Page 42 Spike removal Enable/disable spike removal. Spike removal identifies single-point spikes in fluorescence and replaces them with the average of the two adjacent points. Spike removal analyses the data to remove rogue spikes from the fluorescence data. Spikes can be caused by particles or bubbles in the well and by external environmental factors.
-
Page 43: Regions Of Interest
CONTROL TARGETS Control targets allow easy configuration of two control types (positive & negative). A control has a scope which indicates which other targets / wells can be affected. Control scope is relative to the part of the strip that the sample well is in. The state of the control is determined by the final result call. - Page 44 Regions of interest define which features to examine to generate a result. Name The region name appears in the results set-up. Type Selects the feature type to examine (explained further below in the section titled Features). Phase Selects the measurement phase to examine. Plot The graph to examine.
- Page 45 Additional parameters will be displayed depending on the feature type selected. These are explained further later. Regions (other than Threshold type) are independent unless they explicitly use relative ranges; in which case the region is undefined until the region(s) it is dependent on is/are fully determined. Be careful not to create circular references as all regions will remain undefined.
- Page 46 Feature type: Min Positive if: A minimum width in X range falls within Y range Negative if: No group of points in window cover width. Complete when: Minimum width found or X position passes window. Point identified: The point where the minimum width is satisfied (i.e. width after crossing point) Additional parameters: Width: in the same units as the X axis...
- Page 47 Feature type: Threshold All thresholds required or prohibited by a result are considered together. A threshold that is prohibited has its Y range inverted. If peaks (or dips) are required, each peak is checked against all required thresholds. Positive if: There is a point/peak where all thresholds that are in X range are also in Y range or there is a peak where no thresholds are in X range.
- Page 48 Feature type: Reference This is an advanced calling feature to allow results from one well to affect others. Positive if: The referenced target result is positive Negative if: The referenced target result is negative Invalid if: The referenced target result is invalid Complete when: The referenced target produces a result Point identified:...
-
Page 49: Result Definitions
RELATIVE REGIONS Relative regions allow features to be aligned to other features. Example 1: Find the first peak ratio after normalised fluorescence has passed a threshold. 1. Create an 'any' region, testing normalised fluorescence 2. Create a 'peak' region, testing smoothed ratio; X range 0-0, relative to region 1 Example 2: Test the fluorescence at a peak ratio location. -
Page 50: Overall Result
Result checking waits for all dependant regions to complete, or until no pending regions can affect the result (e.g. if a prohibited region is positive, the state of other regions is irrelevant). Text This is the result message seen by the user on the results table and recorded in reports. Colour/ on These are the foreground and background colour of the displayed result. - Page 51 OVERALL RESULT DEFINITIONS The result definition set up screen. The explanation of the different parameters is below. Overall result definitions specify which wells are required or prohibited for each possible result. Result checking waits for all dependant wells to complete, or until no pending wells can affect the result (e.g.
- Page 52 WELL COMPARE Values calculated for wells can be compared and included in the overall result. The compare set up screen. The explanation of the different parameters is below. Name The compare name appears in the results set-up. Phase Select the phase to compare (e.g. isothermal or anneal) Plot Select which data step to compare (e.g.
-
Page 53: Connecting To External Devices
Chapter CONNECTING TO EXTERNAL DEVICES Genie® III is a standalone instrument; however, it can be connected to external devices for software updates, data upload and further analysis. Files can be transferred to a PC running Microsoft Windows (XP, Vista,7, 10) via the USB connection on the back of the instrument or via WiFi to a phone/mobile device with a network connection or via a pendrive to the USB socket on the rear of the instrument. - Page 54 Open the USB drive in ‘My Computer’. Run the file ‘GenieInstall.msi’. Follow the onscreen instructions. *A prompt may appear requesting installation of .NET Framework 4.0. This must be installed prior to installation. Follow the link to the Microsoft download page. http://www.microsoft.com/en- gb/download/details.aspx?id=17718 Choose a location for the installed program.
-
Page 55: Wireless Connection
The installer will copy all necessary files to the computer. Once the installation is complete, exit by clicking ‘Close’. A Genie® instrument can now be connected to the computer. When connected via USB and switched on, the Genie® instrument will appear as a USB drive and will be accessible from Genie®... - Page 56 CONNECTING GENIE® TO A WIRELESS NETWORK To enable the WiFi, touch the Settings button, the Wireless tab and click the tick box next to WiFi. Touch ‘Set up’ to set up a connection. Touch the ‘Scan’ button to search for wireless networks nearby.
- Page 57 Type in the wireless network key/password and touch ‘Connect’ to join the network. When connected to a network the Genie® will display the word ‘Connected’ and display the name of the network and an IP Address. Once connected to a network the files on the Genie® III can be accessed and downloaded from either a web browser on the same network or via the ‘Genie’...
- Page 58 To create an Access Point, to allow direct communications between Genie and a wireless device without the need for an existing network, touch ‘Create access point’. This will create an open network which can be accessed from another wireless device. ACCESSING GENIE®...
- Page 59 The following screen will be displayed: Log Files: This will give access to the LOG folder on the instrument. The file structure is as it is on the instrument and is sorted by date. Clicking on a .gen file will download it to your device. Report Files:* This will give access to the Report folder on the instrument.
- Page 60 ACCESSING GENIE® VIA GENIE® III APP (ANDROID) The Genie® III app on Android allows quick access to files on a Genie device that is connected via a mobile hotspot, which is ideal for use when there is no wireless network available or the instrument is being used outdoors.
- Page 61 It will detect if a mobile hotspot is enabled and if not ask the user to create one using the phone’s settings (follow instructions in app by pressing the ‘?’ button). No mobile data connection is required to do this. Once a hotspot is created and the Genie®...
- Page 62 Navigate to the log file that is required and touch the file name to download to the device. It is possible to see what files are currently already on the device as well by clicking on the button. Every Genie that has been accessed will be displayed as its own folder.
-
Page 63: Genie® Iii Software Updates
Once downloaded the user can send the files via other applications by navigating to the file on the local storage and touching the tick box next to the file (multiple can be selected) and then pressing the button to share with other applications (email/instant messengers). - Page 64 To download the latest firmware, visit the OptiGene website (http://www.optigene.co.uk). Click on ‘Support’ and click on the appropriate link on the right hand side of the page and download the ‘.zip’ file. Open the ‘.zip’ file and extract the contents to a new folder. The contents of the folder will include the latest firmware, FPGA software and this manual.
- Page 65 Touch on the file, and touch the tick button. The Genie® III will then install the updated software. Please wait for it to finish before trying to do anything else. If the update was a firmware update, Genie® III will restart when completed. If an FPGA software update was performed, Genie®...
-
Page 66: Genie® Iii Technical Specification
Chapter Chapter GENIE® III TECHNICAL SPECIFICATION Sample Number 8 wells Sample Volume 10 µl to 150 µl Touchscreen High-brightness TFT / LCD module (480x272) Heater technology Ceramic substrate with resistive coating with peltier devices Cooling method Forced convection Temperature sensor High-precision thermistor Temperature control type Multi-zone independent digital PID... - Page 67 In no event shall OptiGene Ltd. be liable for incidental, multiple, or consequential damages in connection with or arising from use of this document. Genie® III and its design is a registered trademark of OptiGene Ltd. or its subsidiaries in the UK and other countries.
Need help?
Do you have a question about the Genie III and is the answer not in the manual?
Questions and answers