Table of Contents
Advertisement
Quick Links
Advertisement
Table of Contents

Related Manuals for Optigene Genie II


Summary of Contents for Optigene Genie II
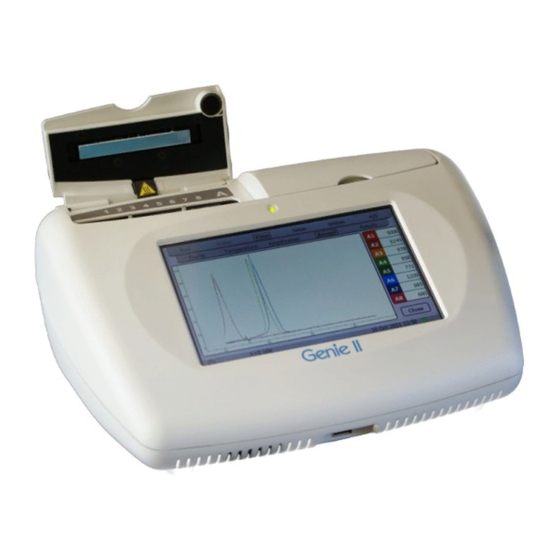
- Page 1 User Manual (Instrument Software Version v2.34.3)
- Page 2 In no event shall OptiGene Ltd. be liable for incidental, multiple, or consequential damages in connection with or arising from use of this document. Genie® II and its design is a registered trademark of OptiGene Ltd. or its subsidiaries in the UK and other countries...
-
Page 3: Table Of Contents
Table of Contents Active ..........28 Profile .......... 28 SAFETY NOTICES ........ 3 Temperature ........ 28 Amplification ....... 29 SUPPORT ..........6 Anneal .......... 29 Results ......... 30 How to obtain support....... 6 Additional Options ....... 33 Supported consumables ....6 View .......... -
Page 4: Safety Notices
If there is any doubt as to the correct use of the equipment contact the vendor. Notices Using the instrument in a manner not specified by OptiGene may result in personal injury or damage to the instrument and the protection provided by the equipment may be impaired. - Page 5 The instrument is electrically powered. Please ensure that the correct voltage settings have been applied before applying power to the instrument. If in doubt consult a qualified electrician. The instrument has a rating label affixed to the rear. Please consult this if needed.
- Page 6 Cleaning Method The Genie® II can be disinfected using the following procedure. This same procedure can be used as a safety measure if this equipment is routinely exposed to bio-hazardous materials. 1. Wipe all outside surfaces of the Genie® II with a 10% bleach solution. 2.
-
Page 7: Support
For the latest services and support information go to http://www.optigene.co.uk/support.htm IMPORTANT! When directed to do so, contact OptiGene Ltd. to schedule maintenance or calibration of a Genie® II instrument. IMPORTANT! If a Genie® II instrument is kept in a very cold environment, the battery will not begin charging until the internal temperature has reached 15°C. -
Page 8: Box Contents
Chapter Chapter BOX CONTENTS The following is a list of contents in the box for Genie® II: Genie® II instrument Power supply Power lead USB connection lead Stylus USB memory stick containing Genie® Explorer and this manual as a ‘.PDF’ file Version 1.07... -
Page 9: Site Preparation
Chapter Chapter SITE PREPARATION HOW TO SET UP GENIE® II The laboratory bench should be level and stable. The instrument should be placed centrally on the lab bench and the surfaces surrounding the instrument must be clear of obstructions at all times. Care must be taken not to unduly restrict the air at the front of the instrument and the outlet vents at the rear. -
Page 10: Connections
CONNECTIONS Genie® II is ready to use straight out of the box without any external connections. It can be operated standalone, taking power from its internal battery. In order to charge the battery or to use Genie® II with a computer or external devices, such as a printer, barcode scanner or pendrive, some connections must be made. -
Page 11: Opening & Closing The Lids
OPENING & CLOSING THE LIDS Gently lift the lids upwards. Close the lids by lowering gently. Care must be taken to ensure that objects are not obstructing the lids when trying to close it and under no circumstances should the lids be forced open or closed. INSERTING TUBES IMPORTANT! Genie®... -
Page 12: Battery Monitor
Note: If this button is pressed during a run, Genie® II will not enter standby. When in standby, normal operation can be resumed by pressing anywhere on the screen. BATTERY MONITOR The battery status can be seen but there is no pop-up. Here the pop-up shows that the battery is currently charging. -
Page 13: Screen Brightness Control
SCREEN BRIGHTNESS CONTROL Next to the battery icon is the brightness control. Touch the icon and a slider will appear on the right hand side of the screen. Move the slider to the desired position. Press the icon again to remove the slider. It is not recommended to set the brightness at 100% for long periods of time, as this will significantly... -
Page 14: User Interface
Chapter Chapter USER INTERFACE Genie® II uses a touchscreen for viewing and inputting data. Touch the screen gently and press the appropriate keys when required. The touch screen can be operated while wearing protective gloves or by using the stylus included with the instrument. IMPORTANT! Do not use a pen or any other sharp implements to touch the screen. -
Page 15: Main Menu
MAIN MENU To start a predefined run, touch the name of the assay and it will begin. Alternatively, touch ‘Other…’ to create a new profile, or open a saved profile. To view profiles or data from previous runs touch the folder icon on the status bar. -
Page 16: Buttons
BUTTONS Set up the quick start buttons on the main screen. Touching ‘…’ will allow the user to browse the saved profiles on the instrument and assign that profile to the corresponding quick start button on the main screen. To remove the buttons, untick the box next to the profile name. -
Page 17: Utilities
UTILITIES Date & Time: Set the time and date within the instrument. Screenshot: A small yellow, moveable icon will appear on the screen, which, when pressed, will take a screenshot of the current screen. This will be saved into the CAPTURE directory on the instrument’s internal memory. - Page 18 Calibrate the touchscreen by touching the target points shown on the screen (the stylus should be used for this). It is also possible to run the touchscreen calibration when the instrument first starts. Press and hold down on the welcome screen for 5 seconds to initiate. LID SENSORS Touching ‘Start’...
- Page 19 Follow the instructions at the top of the screen. Tilt the whole Genie back, keeping the rear feet on the table and press ‘continue’ The calibration is complete. The calibration can be tested by tilting the Genie in different directions. If done correctly, the green and blue circles should remain inside the red circle as it moves around.
- Page 20 Genie® to check that it is fully working correctly and check for any faults, and if so report them to the user who should send the result back to OptiGene Ltd for analysis. Part of this procedure includes allowing checking of the calibration which can be run with additional kits from OptiGene (contact us for more information).
- Page 21 On the Users tab, users can be added or removed with different levels of access. To create a new user, click on the Add button, and then enter the details for the user and select an access level. The levels of access are as follows: No access: The user is disabled (can be used to temporarily revoke access to a user).
- Page 22 COPY & PASTE Users are able to copy and paste in any text box which can save time in entering well names or run names. To copy: In a text box, if text is not highlighted, highlight the text by holding down on the text box until a pop-up appears, and select ‘Select All’...
- Page 23 To paste: Touch the text box you wish to paste into, and then hold down on the box until a pop-up appears and select ‘Paste’. Version 1.07...
-
Page 24: Run
On Genie® II, there are two ways to start a run: either quick start, by touching one of the predefined profiles saved on the instrument or by creating a new profile. Predefined profiles can only be selected for quick start if they are saved anywhere on the instrument file system. -
Page 25: To Load A Saved Profile
Click the graph to adjust the profile by touching the appropriate temperature or time box. Once the required changes have been made, pressing the tick button will accept the changes. Clicking the cross in the top corner will cancel any changes. - Page 26 Pressing one of the quick start buttons on the main menu will pop-up a preview of the profile and give the user the choice to start, edit or cancel the run. Alternatively, press the ‘Other…’ button and a file browser will be displayed. Choose the profile to be loaded and press the ‘Open’...
- Page 27 Pressing the Result Calling Options button will display more options. This is further explained in Chapter 6. If no result calling is set up then the instrument will use pre-set defaults. To assign names to the block wells, click on the well names area. To change a well name, press on the text box and type a name and abbreviation if desired.
- Page 28 If the profile is saved at this point the well names, abbreviations and all result calling will also be saved as part of the profile. The well names screen can be accessed at any time the instrument is running by clicking on the ‘Results’ tab and clicking anywhere on the well names column.
-
Page 29: Active
ACTIVE Once a run is started, the software will go to the ‘Temperature’ screen initially. The other screens can be accessed using the tabs. PROFILE This shows the temperature profile that is running. At the top of this screen, there is a text box to edit the run description, a button to add notes about the run and a button to save the profile. -
Page 30: Amplification
STOP The ‘Stop’ button will abort a run in progress. A confirmation pop up box will prompt ‘Yes’ or ‘No’. AMPLIFICATION This shows the fluorescence data that is being acquired during the amplification phase of the experiment. ANNEAL This shows the fluorescence derivative data that is being acquired during the anneal phase of the experiment. -
Page 31: Results
RESULTS This shows the results of the experiment. Each sample name is shown along with amplification time and anneal temperature and any results that have been defined (see chapter 6). REPORT GENERATION Pressing the button shown on the results page will generate a PDF report. This will be a single page report showing the amplification graph, the anneal graph and the results table. - Page 32 An example of a generated report file. EXPORT TO CSV Pressing the button shown on the results page will generate a CSV (comma separated values) file with the results in and save it in the ‘Reports’ directory on the Genie instrument. The formatting can be switched between tab or comma separated using the...
- Page 33 Pressing the button shown on the results table will print the table onto a label if the correct printer is attached to the Genie® instrument via the USB port on the front or rear (contact OptiGene for more information regarding a printer). Version 1.07...
-
Page 34: Additional Options
ADDITIONAL OPTIONS Touching the button shown on the amplification or anneal plots will show a drop down menu with some additional options. GRAPH OPTIONS Select Graph options Show grid: This will enable/disable the grid behind the plots Show points of interest: Enable/disable any dots on the plots that have been generated by the result calling. - Page 35 RESULT CALLING Result calling is explained in further detail in Chapter 6. BY WELL Selecting ‘By well’ will show all fluorescence plots by well rather than by fluorescence channel. This allows comparison of both channels at the same time. This can be reversed by the same process.
- Page 36 SHOW PLOT Selecting ‘Show plot’ will produce a second menu to select which plot to display on the screen depending on which signal processing step is wanting to be viewed. These are explained below and further in Chapter 6. Raw unprocessed fluorescence Spike The data after spike removal Step...
-
Page 37: View
VIEW To view previous runs press the folder icon on the status bar. This will display a file browser window. All Genie® II runs are saved in the ‘LOG’ folder. To open, click on ‘LOG’ and then tick icon, or double press on the folder name. - Page 38 Each run is stored in a folder by date order: Year/Month/Day. The default filename for the each run is the instrument serial number followed by a sequential number. Select a file, a preview will appear in the right hand pane, then touch the tick button to load it.
- Page 39 To zoom out, touch on the plot area and drag to the left and/or up. A double press on the screen will zoom out to the full extent of the graphs. Version 1.07...
-
Page 40: Genie Result Calling
Chapter GENIE RESULT CALLING OVERVIEW Genie instruments can generate results according to detected amplification times, anneal peaks and other features. Due to the varying requirements of differing applications, setting up the parameters is highly flexible. Analysis is based on targets, where each target has its own set of parameters and possible results. Each well can have up to three targets assigned for multiplex applications. -
Page 41: Target Parameters
This screen shows an overview of the ‘Detection targets’, showing the number of regions of interest, the number of results, and which targets are assigned to which well. From here new targets can be added, imported from other runs or profiles, edited or deleted. - Page 42 Chan The fluorescence channel / colour to examine. All regions for a target use the same channel. Quenching Indicates that amplification causes a decrease in signal. Ratios and derivatives are inverted for quenching. Spike removal Enable/disable spike removal. Spike removal identifies single-point spikes in fluorescence and replaces them with the average of the two adjacent points.
-
Page 43: Regions Of Interest
CONTROL TARGETS Control targets allow easy configuration of two control types (positive & negative). A control has a scope which indicates which other targets / wells can be affected. Control scope is relative to the part of the strip that the sample well is in. The state of the control is determined by the final result call. - Page 44 This is the set up screen for the region. The explanation of the different parameters is below. Regions of interest define which features to examine to generate a result. Name The region name appears in the results set-up. Type Selects the feature type to examine (explained further below in the section titled Features). Phase Selects the measurement phase to examine.
- Page 45 Additional parameters will be displayed depending on the feature type selected. These are explained further later. Regions (other than Threshold type) are independent unless they explicitly use relative ranges; in which case the region is undefined until the region(s) it is dependent on is/are fully determined. Be careful not to create circular references as all regions will remain undefined.
- Page 46 Feature type: Min Positive if: A minimum width in X range falls within Y range Negative if: No group of points in window cover width. Complete when: Minimum width found or X position passes window. Point identified: The point where the minimum width is satisfied (i.e. width after crossing point) Additional parameters: Width: in the same units as the X axis Uses:...
- Page 47 Feature type: Threshold All thresholds required or prohibited by a result are considered together. A threshold that is prohibited has its Y range inverted. If peaks (or dips) are required, each peak is checked against all required thresholds. Positive if: There is a point/peak where all thresholds that are in X range are also in Y range or there is a peak where no thresholds are in X range.
- Page 48 Feature type: Reference This is an advanced calling feature to allow results from one well to affect others. Positive if: The referenced target result is positive Negative if: The referenced target result is negative Invalid if: The referenced target result is invalid Complete when: The referenced target produces a result Point identified:...
-
Page 49: Result Definitions
RESULT DEFINITIONS This screen shows an overview of the target results. The type and how many regions are required are shown. The order of which the results are called is important. This can be changed by selecting a result and using the up and down arrows. - Page 50 Unselected regions and controls have no effect on the result. Regions that are both required and prohibited should be avoided – this combination may be given a special meaning in the future. All positive control targets whose scope includes a particular well are collected together in one pair of required/prohibited tick boxes (likewise for negative control targets).
- Page 51 All wells have met the criteria defined in the ‘Anneal peak’ region. The points at which the criteria are met are marked by a dot on the graph line. The result defined is shown in the Results table. Version 1.07...
-
Page 52: Overall Result
OVERALL RESULT Overall result calling takes the results for each well and combines then to give a result for the whole strip. This screen shows the defined overall results. Result definitions are tested in order. The first matching result is displayed. This order can be changed using the up and down arrow buttons. - Page 53 A well is negative if any target produces a negative result type. An overall result is displayed at the top of the results table, as shown in the screenshot. WELL COMPARE Values calculated for wells can be compared and included in the overall result. The compare set up screen.
-
Page 54: Connecting To External Devices
USB connection on the back of the instrument to a PC or via a pendrive to the USB socket on the front or the rear of the instrument. Genie® can also be connected to a barcode scanner and a printer for text input and output (contact OptiGene Ltd for more information). PENDRIVE A pendrive can be plugged into the USB A socket in the rear or the front of the unit. - Page 55 Choose a location for the installed program. Confirm to start the installation. The installer will copy all necessary files to the computer. Version 1.07...
- Page 56 Once the installation is complete, exit by clicking ‘Close’. A Genie® instrument can now be connected to the computer. When connected via USB and switched on, the Genie® instrument will appear as a USB drive and will be accessible from Genie®...
-
Page 57: Genie® Ii Software Updates
FPGA software that are installed on Genie® II are displayed in the bottom left hand corner of the main menu screen. To download the latest firmware, visit the OptiGene website (http://www.optigene.co.uk). Click on ‘Support’ and click on the appropriate link on the right hand side of the page and download the ‘.zip’ file. ... - Page 58 To install the updates, connect Genie® II to a computer. Navigate to ‘My Computer’ and open the Genie® II drive. The drive is named with the instrument serial number, e.g. GEN2-2001. Copy and paste (or drag) the firmware or FPGA software files onto the Genie®...
-
Page 59: Genie® Ii Technical Specification
Chapter GENIE® II TECHNICAL SPECIFICATION Sample Number 16 wells (2x8 strips) Sample Volume 10 µl to 150 µl Touchscreen High-brightness TFT / LCD module (800x480) Heater technology Ceramic substrate with resistive coating Cooling method Forced convection Temperature sensor High-precision thermistor Temperature control type Multi-zone independent digital PID Temperature control range... - Page 60 In no event shall OptiGene Ltd. be liable for incidental, multiple, or consequential damages in connection with or arising from use of this document. Genie® II and its design is a registered trademark of OptiGene Ltd. or its subsidiaries in the UK and other countries. Version...
Need help?
Do you have a question about the Genie II and is the answer not in the manual?
Questions and answers