
Related Manuals for FISCHER FISCHERSCOPE X-RAY 5000 Series

Summary of Contents for FISCHER FISCHERSCOPE X-RAY 5000 Series
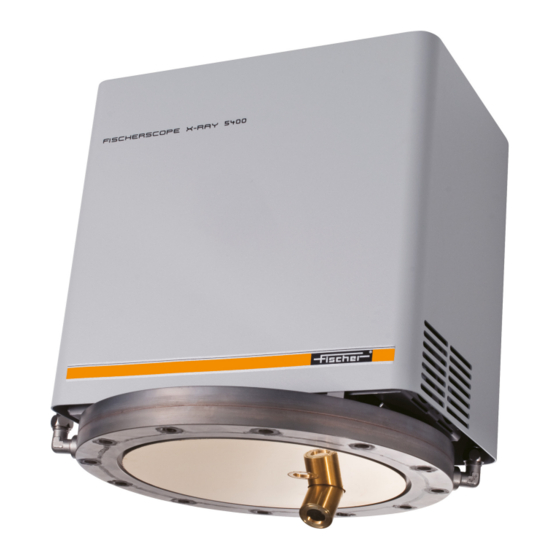
- Page 1 OPERATOR’S MANUAL FISCHERSCOPE X-RAY 5000 Series ® Coating Thickness Material Analysis Microhardness Material Testing...
- Page 2 Industriestraße 21 www.helmut-fischer.com D-71069 Sindelfingen mail@helmut-fischer.de On our home page www.helmut-fischer.com you will find the addresses of our sole agen- cies and subsidiary companies around the globe. Quality Assurance System of the Helmut Fischer GmbH DIN EN ISO 9001:2008 Management system certified by Germanischer Lloyd...
-
Page 3: Table Of Contents
Table of Contents Table of Contents Safety Information ........7 Intended Use . - Page 4 Table of Contents WinFTM File Structure ........37 Def.MA .
- Page 5 Correlation between mass per unit area and coating thickness ... .88 13.2 Calibration standards from FISCHER ....... 90 13.3 Setting the density in the Def.MA .
- Page 6 Table of Contents 14.7 Practical monitoring of the measurement devices ..... 101 14.8 When and how to carry out corrections? ......103 14.9 Wouldn’t it be better to re-calibrate? .
-
Page 7: Safety Information
The specifications of the instrument and of the accessories are described in the data sheet in the Attachment to this Operators Manual. Only accessories recommended and approved by FISCHER may be connected to this instrument. Modifications, repairs, maintenance and service work on the FISCHERSCOPE X-RAY and its accessories must be performed by authorized FISCHER service personnel only. -
Page 8: X-Radiation Safety
FISCHER for this purpose. 1.4.1 Repeat Inspection FISCHER recommends to check the instrument by an expert in intervals of no longer than five years. Observe the laws and regulations of the country where the instrument is oper- ated. -
Page 9: Requirements For The Operating Personnel
Requirements for the Operating Personnel Safety Information No Alterations to the Instrument! Only specialized service personnel, as a rule the Service of FISCHER, is authorized to carry out alterations to the measuring instrument. DANGER X-radiation and high voltage Carrying out alterations to the instrument can lead to death or serious inju- ries and legal consequences. - Page 10 Safety Information Requirements for the Operating Personnel physical fundamentals of x-ray fluorescence and prepare users for their work with the measuring instruments are conducted at various locations. Seminar dates can be found on our website www.helmut-fischer.com. FISCHERSCOPE ® X-RAY...
-
Page 11: Instrument Overview
X-RAY is a high performance energy dispersive x-ray fluores- ® cence (EDXRF) spectrometer. The WinFTM ® (Fischer Thickness Management Software for Windows ® ) software controls the instrument and handles the evaluation of the signals supplied by the instrument. The measured values (coating thickness, material compositions, mass per unit area) are stored and displayed on the monitor. -
Page 12: X-Ray Fluorescence
Instrument Overview X-Ray Fluorescence X-Ray Fluorescence The specimen is excited with the primary x-radiation. In the process electrons from the inner electron shells are knocked. Electrons from outer electron shells fill the resultant voids emitting a fluorescence radiation that is characteristic in its energy distribution for a particular material. -
Page 13: Functional Principle Of The Instrument
Functional Principle of the Instrument Instrument Overview Functional Principle of the Instrument The following figure shows the principle structure of the instrument: X-ray tube Anode Cathode WinFTM Shutter main window Primary x-radiation Spectrum Detector Aperture X-ray fluorescence radiation Coating layer Base material Fig. - Page 14 Instrument Overview Functional Principle of the Instrument 3. The aperture (collimator) limits the cross-section of the primary beam in order to excite a measurement spot of a defined size. 4. The primary x-radiation impacts the atoms on the sample surface (coating layer and base material) and in the process knocks electrons from the inner electron shell.
-
Page 15: Switching The Instrument On And Off
1. Switch on the instrument by using the Off/On rocker switch at the rear of the instru- ment. Off/On rocker switch 2. Plug the FISIM (Fischer Software Identification Module) into an USB port of the computer. 3. Switch on the PC and the monitor. -
Page 16: Switching Off The Instrument
Switching the Instrument on and off Switching off the Instrument 6. In the WinFTM start window click OK. The software will open in the ready-to-measure mode (Communication on). The product that had been selected prior to powering off will be called automatically. What you can do next You can now perform measurements. -
Page 17: Communication Between Instrument And Winftm
Communication between Instrument and WinFTM Switching the Instrument on and off Communication between Instrument and WinFTM Communication between instrument and WinFTM is necessary to obtain measurements with the instrument. Determining the current communication condition If the communication is enabled, the measurement distance appears in the status bar. ... - Page 18 Switching the Instrument on and off Communication between Instrument and WinFTM FISCHERSCOPE ® X-RAY...
-
Page 19: Performing Manual Measurements
With these products you can perform measurements immediately. If you need new measurement tasks, you can request products from FISCHER. The products are then send to you by email or on a data carrier. Before you can use the new products, you need to import and calibrate them. -
Page 20: Deleting Measurement Readings
Performing Manual Measurements Deleting Measurement Readings Procedure 1. In the WinFTM main window click Select. 2. Choose the product from the list. You can sort the list by name, number, date etc. 3. Click OK. 4. To start the measure- ment, click Start. - Page 21 Deleting Measurement Readings Performing Manual Measurements 3. Click Delete Block. To delete individual measurement readings of blocks, already closed 1. In the WinFTM main window select Evaluation > Evaluate Single Block..The window Block Result appears. 2. Click Readings. The window Readings appears. 3.
- Page 22 Performing Manual Measurements Deleting Measurement Readings FISCHERSCOPE ® X-RAY...
-
Page 23: User Interface Of The Winftm Software
WinFTM Main Window User Interface of the WinFTM Software User Interface of the WinFTM Software The WinFTM (Fischer Thickness Management Software for Windows ) software ® ® controls the instrument and handles the evaluation of the signals supplied by the instrument. - Page 24 User Interface of the WinFTM Software WinFTM Main Window Item Function Tool bar The tool bar offers quick access to the most frequently used func- tions. You can adapt the tool bar according to your needs. Product bar Here you can select a product by clicking the button Select. In the center the number and name of the current product are displayed, here No.
-
Page 25: Video Image
Video Image User Interface of the WinFTM Software Video Image With the help of the video image you can position and focus the specimen exactly. If you don‘t see the video image, it is switched off. To switch on the video image ►... - Page 26 User Interface of the WinFTM Software Video Image Item Function Z-axis slide Moves the Z-axis up or down. The more the slider is scrolled, the faster the Z-axis moves. control Button for Changes the color of the crosshairs in order to optimize the contrast changing the between specimen and crosshairs.
-
Page 27: Statistics Field
Statistics Field User Interface of the WinFTM Software Statistics Field The statistical results of the last block are displayed in this field (see Fig. 5-1 on Page 23). A block is a test series. The test series has a first and a last value. The last value marks the end of the block. - Page 28 User Interface of the WinFTM Software Measurement Value Field If you have set up tolerance limits, the measurement value is displayed with colored back- ground. If the measurement value is within the tolerance limits, the measurement value is displayed on green background, otherwise on red background. 5.4.3 SPC Chart Presentation In this display mode the SPC chart (Statistical Process Control chart) is displayed in the...
- Page 29 Measurement Value Field User Interface of the WinFTM Software You can display or hide the result channels defined within the DefMA according to your needs. 1. In the WinFTM main menu, click The window Modify product appears. 2. Select the tab Presentation. 3.
-
Page 30: Status Bar
User Interface of the WinFTM Software Status Bar Status Bar The status bar is located at the bottom of the WinFTM window and displays the following: Help text mq value Operator‘s name XYZ coordinates Measurement distance Display Explanation Help text If you hover with the mouse pointer over a command button, addi- tional help text will be displayed here. - Page 31 mq Value User Interface of the WinFTM Software 5.6.1 Upper Limit of the mq Value The factory default for the upper limit of the mq value is set to 5. You do have the option to change this upper limit. When the upper limit of the mq value is exceeded during a measurement, the measure- ment will be terminated and the error message ERROR: Spectrum not suitable! will be issued.
-
Page 32: Limited Operating Mode - Short Menu
► Select in the WinFTM main menu General > short Menu. To activate the full menu 1. Select in the WinFTM main menu General > full Menu. The window Input Password appears. 2. Enter the password ?Fischer? The password is case sensitive. FISCHERSCOPE ® X-RAY... -
Page 33: The Spectrum Window
The Spectrum Window User Interface of the WinFTM Software The Spectrum Window X-ray fluorescence radiation is emitted from the irradiated sample. The detector receives this radiation, the instrument amplifies it and presents it as a spectrum. You can evaluate the measured spectrum in the spectrum window. With unknown samples you can analyze, which components comprise the sample. - Page 34 User Interface of the WinFTM Software The Spectrum Window 5.8.1 Performing Measurements in the Spectrum Window Before you start ► Position the specimen. You can display and change the measurement parameters for this particular measure- ment. If you change parameters, the change is valid for this particular measurement only. The parameters of the current product are not influenced by your change.
- Page 35 The Spectrum Window User Interface of the WinFTM Software The higher the X-ray fluorescence energy of an element, the further to the right the corre- sponding line will be in the spectrum. According to Moseley’s Law, the energy increases as the atomic number of the respective element increases, i.e., the lines of the “heavier”...
- Page 36 User Interface of the WinFTM Software The Spectrum Window FISCHERSCOPE ® X-RAY...
-
Page 37: Winftm File Structure
WinFTM File Structure WinFTM File Structure To ensure correct measurements, a set of specific files needs to be set up. The process flow for setting up the files needed for measurements, is the same on all FISCHERSCOPE X-RAY instruments: Def.MA: Definition of the measurement settings of the application Fig. -
Page 38: Def.ma
If you don’t have the knowledge, do not use the SUPER software, but request a new measurement application from FISCHER instead. FISCHER offers a professional service for the creation of customer’s Def.MA. Measurement Application... - Page 39 Product WinFTM File Structure 6.3.1 Dual Function of a Product A product consists of two parts that function independent of one another: Product Product part for the cali- Product part for the specimen bration standard set The parts have the following function: The product part for the specimen is used to measure the specimens.
- Page 40 WinFTM File Structure Product FISCHERSCOPE ® X-RAY...
-
Page 41: Product Administration
Product Product Administration Product Administration Product The instrument needs certain basic information to make Product measurements. This information is contained in the product file. For this reason, an appropriate product file must be selected or set up before measurements can be made. Setting up a new product An appropriate Def.MA must already be present before a new product can be set up. -
Page 42: Importing A Product
(see 7.13 ‘Reference samples’, beginning on Page 46). Importing a product If you have received a new product file from FISCHER, you need to import it. The file name has the extension *.sav, *.sv1 or *.sv3. Procedure 1. -
Page 43: Modifying Products
Modifying products Product Administration File..The window Copy from/to file appears. 4. Select the tab File >>> Product. 5. Click Select. The window Select file appears. 6. Select the product file and click Select. The selected path appears in the field File. 7. -
Page 44: Assigning A New Measurement Application To A Product
Product Administration Assigning a new measurement application to a product Assigning a new measurement application to a product A new measurement application can be assigned to an existing product only if it has the same measurement mode as the existing measurement function. -
Page 45: Delete Measurement Application
7.11 Importing a Def.MA If you have received a new Def.MA file from FISCHER, you need to import it. The file name has the extension *.pb0. After this you create a new measurement application and a product based on the imported Def.MA. -
Page 46: Backing Up Product Or Def.ma Files
Product Administration Backing up product or Def.MA files 3. In the WinFTM main window select Product > Copy to/from File..The window Copy from/to file appears. 4. Select the tab File >>> Def.MA. 5. Click Select. The window Select file appears. 6. -
Page 47: Base Material In Def.ma
7.14 Base material in Def.MA Def.MA files may be created Definition of the base material either by FISCHER, from where they may be forwarded to the user for example as email attachment - the user may copy them to WinFTM using the menus "Product ->... - Page 48 Product Administration Base material in Def.MA Such features are substantial for WinFTM. They characterize this program as a leading evaluation tool among other programs in the X-ray fluorescence business. Those arguments do not hold if the base material structure is defined as "composition unknown".
-
Page 49: Monitoring The Measurement Devices
Monitoring the measurement devices Product Administration excitation. Any combination of substrates not allowed in this context will be rejected. In any cases where a component of a layer is secondarily excited by a component of the base material fluorescence the definition "composition unknown" must not be used but the substrate has to be defined explicitly. - Page 50 Product Administration Monitoring the measurement devices Technical background: With the X-ray fluorescence method, as with any non-destructive measurement method, the measurement data are calculated indirectly. The source signal is the spectrum of the X-ray fluorescence. From this signal, the program computes the thickness of the respective coatings and the concentrations of the alloy elements.
-
Page 51: Handling Of Measurement Data And Statistical Evaluations
Saving / not saving measurement data Handling of Measurement Data and Statistical Evaluations Handling of Measurement Data and Statistical Evaluations Saving / not saving measurement data In general, WinFTM saves all readings automatically in blocks within product files without the need for the user to expressly instruct the instrument to do so. -
Page 52: Overwriting Measurement Data
Handling of Measurement Data and Statistical Evaluations Overwriting Measurement Data Overwriting Measurement Data For various reasons, it can be useful to measure a specimen again and to overwrite the old reading with the new one. To do this, click (select) a reading, even a deleted one, from the list display mode and then click the [Start] command button. - Page 53 Closing a Block (Order no. / Operator) Handling of Measurement Data and Statistical Evaluations To open the dialog window “Order no. / Operator” Menu command “Evaluation > Order no. / Operator”, or The two upper entry fields “Order no.” and “Batch no.” are linked to the block and their contents are stored together with the block data.
-
Page 54: Block Evaluation (Statistics)
Handling of Measurement Data and Statistical Evaluations Block evaluation (statistics) Only with the PDM software add-on module is it possible to subsequently change any block-related field contents in the dialog window “Block evaluation” from the sub menu “Evaluate All Blocks” (Menu “Evaluation”) You can cause the program to prompt you automatically to fill in these fields for each new block. -
Page 55: Variable And Fixed Block Size
Variable and fixed block size Handling of Measurement Data and Statistical Evaluations Choose the command button [Readings] to open the window “Single readings”. In this window, you can delete values by selecting the respective line with the right mouse button and clicking the command button [Delete single reading]. -
Page 56: Statistics
Handling of Measurement Data and Statistical Evaluations Statistics As described under “Evaluate block” above, you can select and then delete a desired block. However, you can also delete a block in the list display mode: To do this, select the block title “Block no. N” (where N is the block number) and click the icon [DEL] or the command “Delete reading Del.”... -
Page 57: Setting Up The Print Form Using Pdm
Statistical Evaluation and Documentation Using the Supplementary Software PDM Setting Up the Print Form Using PDM Setting Up the Print Form Using PDM Statistical Evaluation and Documentation Using the Supplementary Software PDM The optional supplementary software PDM (product data management) allows for a more convenient evaluation of the measurement data than the basic version of WinFTM. -
Page 58: Editing Print Form Templates Using Pdm
Setting Up the Print Form Using PDM Editing Print Form Templates Using PDM Editing Print Form Templates Using PDM Starting the Print Form Template Editor Select from two menu commands: “Evaluation > Print Form > new” “Evaluation > Print Form > modify” ... -
Page 59: Inserting Variables For Print Form Templates
Inserting Variables for Print Form Templates Setting Up the Print Form Using PDM Example of a print form template for block evaluation: Inserting Variables for Print Form Templates How to insert variables into print form templates: 1. You will find a list of all variables that can be inserted into the print form template to the right of the editing field. - Page 60 Setting Up the Print Form Using PDM Variables Available for Block Evaluation Example “Dual coating measurement” Top coating thickness = 1 and intermediate coating thickness = 2 List of variables for block evaluation: @ANBOrder number of the selected block or the information that has been entered into the first entry field of the dialog window “Order No./ Operator”.
- Page 61 Variables Available for Block Evaluation Setting Up the Print Form Using PDM @DATCurrent date for the print form Default format: DD/MM/YYYY, e.g., 24.05.1998) @DF1Density of the coating that has been entered into the current product. This applies only to coatings with a fixed composition.
- Page 62 Setting Up the Print Form Using PDM Variables Available for Block Evaluation @NB1Number of readings present in the block that contribute to the statistical block result @NCALNumber of single readings that are taken on the calibration standard during the calibration of the current measurement application (the current meas.
- Page 63 Variables Available for Block Evaluation Setting Up the Print Form Using PDM The standard deviation s is a measure for the distribution of Regarding the numerals 1; 2; 3 ... after certain the single readings of the measurement series around their variables: common mean value.
-
Page 64: Variables Available For The Final Evaluation
(1,2,3). Example: @VIF[40,Fischer.bmp] -> the image that is saved Example “Dual coating in the file “Fischer.bmp” appears in the print form. measurement” Top coating thickness = 1 Image height = 40 mm. Intermediate coating... - Page 65 Variables Available for the final Evaluation Setting Up the Print Form Using PDM @ANBOrder number of the last block of the selected blocks or the information that has been entered into the first entry field of the dialog window “Order No./ Operator”. @BM1Lot number of the last block of the selected blocks or the information that has been entered into the second entry field of the dialog window “Order No./ Operator”.
- Page 66 Setting Up the Print Form Using PDM Variables Available for the final Evaluation of the current product. @SA1Standard deviation s_a. This standard deviation expresses the additional distribution of the mean values of fixed blocks that cannot be explained by the standard deviation s of the single readings within the blocks.
-
Page 67: Products With A Variable Or Fixed Block Size
Products with a variable or fixed block size Setting Up the Print Form Using PDM presentation and computation of the violations of the lower limit in the selected block of the current product. @VK1Coefficient of variation of the single readings of the selected block. - Page 68 Setting Up the Print Form Using PDM Products with a variable or fixed block size All variables and parameters that otherwise refer to single readings refer, in this case, to the mean values of the individual blocks (except for histogram and normal probability chart, which continue to refer to single readings).
-
Page 69: Special Features For Spc Charts
Special Features for SPC Charts Setting Up the Print Form Using PDM window “Measurement quantity selection”, the variable “@MW2” will appear in the print form template. NOTE: Note: The variables must always be entered in upper case letters! NOTE: Note: The character @ is part of the variable, i.e., it must be entered, must not be deleted and it must not be followed by space! NOTE:... -
Page 70: Printing The Print Form Using The Supplementary Software Pdm
Setting Up the Print Form Using PDM Printing the Print Form Using the Supplementary Software PDM (e.g., @SP1[150,90]). NOTE: Note: You can only enter numbers in these fields if the option box “Size user-defined” is checked. Printing the Print Form Using the Supplementary Software PDM Print forms can be printed very easily when using the supplementary software PDM. -
Page 71: Measurement Uncertainty And Measuring Ranges
Printing the Print Form Using the Supplementary Software PDM Measurement Uncertainty and Measuring Ranges Measurement Uncertainty and Measuring Ranges The program is able to display for each measurement result a corresponding measurement uncertainty. To estimate the Measuring range In the WinFTM main menu select Calibrate > Estimate meas. -
Page 72: Meaning Of The Measurement Uncertainty
Measurement Uncertainty and Measuring Ranges Meaning of the measurement uncertainty Definition "Measuring range" Range, where the precision does not exceed a specified limit value. Precision: random measurement uncertainty due to distribution of the spectral channel contents of the instrument. 10.1 Meaning of the measurement uncertainty Measurement uncertainty refers to the unknown difference to the true value. -
Page 73: Random Error
Random Error Measurement Uncertainty and Measuring Ranges 10.2 Random Error If a measurement is repeated N times, the single readings will deviate around a mean value. The cause for this is the random distribution of the channel contents of the spectrum, whose law of formation (Poisson distribution) we know. -
Page 74: Systematic Error
Measurement Uncertainty and Measuring Ranges Systematic Error Calibration standard set. Input of the nominal values of the standards. The uncertainties (errors) must be entered as well. If the pre-set Zero is not changed then the program will automatically use 1% of the nominal values for coating thicknesses and area masses, and 1 mass % for concentrations as the uncertainty, referenced to k=1 (68% confidence interval). -
Page 75: Display Of The Measurement Uncertainty
Display of the measurement uncertainty Measurement Uncertainty and Measuring Ranges standard set, cf. figure below. For the confidence interval, the general provision according to Section 1 applies here as well. For program-technology reasons, the systematic portion of the error is available only via On-line-Export. Setting of the error display for screen output and export in the "Calibration standard set". - Page 76 Measurement Uncertainty and Measuring Ranges Display of the measurement uncertainty Systematic portion Computed from the Uses the error value of random error of the the last measurement calibration measure- of the block ment and the uncer- tainties of the nominal values of the stan- dards, according to the input in the "Calibra-...
- Page 77 Display of the measurement uncertainty Measurement Uncertainty and Measuring Ranges Example for the export of single readings and block results Online export to text file. Export template "Single reading" por- @NBR. @VA1 +/- @ER1@CRX@LFX@END tion: "Block evaluation" por- Evaluation Block No. @BLK @ANB @PRF tion: @LOT@CRX@LFX@MW1+/- @VB1 s=@S_1 (N=@NM1)@CRX@LFX@CRX@LFX@END...
-
Page 78: Task Programming
Task programming Starting a Task Task programming A Task is a sequence of predefined commands which can be used for programming WinFTM procedures. 11.1 Starting a Task The menu command “Task > Task start” starts a task. Use the F3 function key to interrupt the program run. 11.2 Programming Tool The commands are similar (or in some cases equal to) the import commands. -
Page 79: Getting Started With Task Programming
Getting started with task programming Task programming 11.3 Getting started with task programming There are some predefined examples which are helpful for testing. The user should start his task programming by a modification of these examples. The "Save as .." option can be used to create new task files. - Page 80 Task programming List of Task Commands f11 A,XLoads - from of directory A - product no. X f12 B Loads - from current directory - product with designation B f13 A,BLoads - from directory A - product with designation B f15 N Loads Stabi Test product no.
- Page 81 List of Task Commands Task programming p62V2Sets variable 2 = V3 p63V3Sets variable 3 = V3 p71L V1 = V1 -1, if V1 > 0 GOTO label L p72L V2 = V2 -1, if V2 > 0 GOTO label L p73L V3 = V3 -1, if V3 >...
-
Page 82: Example Specification Limit Commands
Task programming Example Specification Limit Commands ?KX minimum 1 reading is not measurable (in the following sub-chapter, the commands of S are explained using a practical example) 11.6 Example Specification Limit Commands The following example clarifies the terms used on the previous pages at “S”: Task: The values of the “current measurement data set”... -
Page 83: Data Back-Up
Extent of the data back-up Data back-up Data back-up Regularly back-up at least the following folders or files in order to Protect your data - back be able to return to the previous status in case of a hard disk crash them up! or accidental erasure of important files: Folder “Data”... -
Page 84: Back-Up Cycle
Data back-up Back-up cycle 12.3 Back-up cycle Data back-up prompt You can set the back-up cycle, that is, the waiting time until the prompt for the data back-up appears in the entry box “Waiting time ...”. The actual operating time of the instrument is counted in days. If you enter “0”, the prompt for data back-up will occur after about 1 min. - Page 85 Back-up cycle Data back-up Use the menu command “Product > copy from ... to...” from within the WinFTM Software to copy individual product files, for example, onto a diskette and transfer them, for example, to an instrument of the same type. FISCHERSCOPE ®...
-
Page 86: Mass Per Unit Area And Geometric Coating Thickness
Mass per unit area and geometric coating thickness Back-up cycle Mass per unit area and geometric coating thickness The natural unit of measurement for X-ray fluorescence is mass per unit area. Definition "Mass per unit area": Mass per area The number of atoms or the mass per unit area can be determined from the fluorescence spectrum. - Page 87 Back-up cycle Mass per unit area and geometric coating thickness of the characteristic radiation of the coating material is determined from the number of atoms within the excited sample volume. The intensity of this radiation is higher as more atoms of the sample volume are excited by the primary radiation and emit their radiation to the detector.
-
Page 88: Correlation Between Mass Per Unit Area And Coating Thickness
Mass per unit area and geometric coating thickness Correlation between mass per unit area and coating thickness Essentially, the measurement of the x-ray fluorescence is an indirect count of the excited atoms under a surface with a precisely defined size, the so-called “measurement spot”. 13.1 Correlation between mass per unit area and coating thickness If a coating is comprised of several elements, the instrument initially... - Page 89 Correlation between mass per unit area and coating thickness Mass per unit area and geometric coating thickness coating thickness if the measurement application that is used in process 1 uses a lower density for converting the mass per unit area into coating thickness according to equation 1 than the one of process 2.
-
Page 90: Calibration Standards From Fischer
No data have been obtained using the cross-cut method. By default, WinFTM uses the density values of the Heräus table. The calibration lab of FISCHER has been accredited by the Deutsche Akkreditierungsrat [German Accrediting Council] for the measurement unit “mass per area unit”. - Page 91 Setting the density in the Def.MA Mass per unit area and geometric coating thickness Dialog window “Definition of elements“. The density of the current element can be entered or edited in the entry box “g/cmˆ3”. To open the dialog window "Definition of elements" 4.
-
Page 92: Measurement Device Monitoring For The Fischerscope X-Ray
According to quality management guidelines, all measuring instruments are subject to measurement device monitoring. FISCHER, as a manufacturer of measurement instruments, accounts for this and sees to it that customers who require advice and support are able to properly use their measurement instruments. - Page 93 (documentation is required; see Fischer Application Report vr 9812). Strictly speaking, a ”correct” measurement is secure only for such samples that correspond to the calibration standards in their coating structure and composition.
-
Page 94: Why Monitor Measurement Devices
Measurement device monitoring for the Fischerscope X-RAY Why monitor measurement devices? 14.2 Why monitor measurement devices? Stability In the course of time, each coating thickness measuring instrument changes due to wear and drift. Long-term, this also changes the measurement applications and calibrations, and thus, the measurement readings. -
Page 95: Variation Of Measurement Readings
Variation of measurement readings Measurement device monitoring for the Fischerscope X-RAY 14.3 Variation of measurement readings The displayed value of any measuring instrument will not be exactly Repeatability the same when repeating a measurement, instead it will vary, even Conditions under otherwise equal measurement conditions (repeatability conditions), due to random influences of the instrument. -
Page 96: Trueness Of Measurement Readings
Measurement device monitoring for the Fischerscope X-RAY Trueness of measurement readings Variations The variations of an X-ray fluorescence instrument depend on the measurement parameters measurement time, distance between the detector and the specimen, intensity of the primary beam and other characteristics of the instrument as well as on the physics of the X-ray fluorescence with regard to the measurement application. -
Page 97: Random And Systematic Deviations
Random and systematic deviations Measurement device monitoring for the Fischerscope X-RAY Please note that we expressly speak of the trueness as a property of the measurement readings. However, many believe the trueness to be a property of the instrument! Unprofessionally, this is expressed in the question for the ”accuracy of the instrument”. - Page 98 Measurement device monitoring for the Fischerscope X-RAY Random and systematic deviations standard: In such a case, the user need not be surprised by the deviation. Statistics teaches: Only when a mean value of a test series of at least 7 single readings misses the nominal value of a calibration standard by more than one standard deviation can one assert that the deviation is a systematic one.
-
Page 99: Trueness And Precision
Trueness and precision Measurement device monitoring for the Fischerscope X-RAY explained by the lacking precision of the instruments involved and does not need to cause a dispute. In such cases, one can no longer speak of different measurement results. However, if one wishes to prove that the difference is systematic, then the precision of the involved instruments must be increased (e.g., by increasing the measurement time or by decreasing the measurement distance or... - Page 100 Measurement device monitoring for the Fischerscope X-RAY Trueness and precision This can be observed, for example, with round robin tests on the same sample with a marked reference area, even if each instrument is correctly calibrated and checked. The reasons are the random deviations of each single reading, and thus of each mean value of a test series, the random deviations at each calibration, and also the fact that each calibration standard is labeled with a...
-
Page 101: Practical Monitoring Of The Measurement Devices
Practical monitoring of the measurement devices Measurement device monitoring for the Fischerscope X-RAY reading differences. It is not without reason that the X-ray fluorescence method is considered the most accurate measurement method for coating thicknesses due to its high comparative precision. Because the most common and grave deviations are of a systematic nature, they must be found and corrected. - Page 102 Measurement device monitoring for the Fischerscope X-RAY Practical monitoring of the measurement devices samples can also be used to compare the measurement results of two parties (e.g., supplier and customer) when calibration standards are not available at one of the parties and one tries to avoid shipping of relatively expensive calibration standards.
-
Page 103: When And How To Carry Out Corrections
When and how to carry out corrections? Measurement device monitoring for the Fischerscope X-RAY performs a calibration service, for example, because no calibration standards are available, the user only has the option to monitor the measurement device using reference standards. Thus, establishing reference samples is an obligatory consequence of using a calibration service, because continued access to standards by the user is not possible. - Page 104 Measurement device monitoring for the Fischerscope X-RAY When and how to carry out corrections? and of the substrate material) of the measurement application, testing of the spectra library (see below). With a Fischerscope XRAY with WinFTM software, the spectra of the ”pure elements”...
-
Page 105: Wouldn't It Be Better To Re-Calibrate
Wouldn’t it be better to re-calibrate? Measurement device monitoring for the Fischerscope X-RAY ment device monitoring is not recommended directly after power-up of the instrument, even though regular measurements can be made. 14.9 Wouldn’t it be better to re-calibrate? To correct a measurement application that does no longer ”fit” according to the control chart, a reference measurement and a normalization or the verification and possibly but very rarely, a re- measurement of the spectra library are generally sufficient. -
Page 106: Pre-Run For Determining The Control Limits
Measurement device monitoring for the Fischerscope X-RAY Pre-run for determining the control limits retain a once secured measurement application essentially without changes than to overwrite it through re-calibration, often done for no reason. Thus, please only follow the corrective measures recommended by us. - Page 107 Pre-run for determining the control limits Measurement device monitoring for the Fischerscope X-RAY The standard deviations s of groups 1 to 10 are used to build the arithmetic mean value s = (1/m) · s The index i runs across the number m of the groups. The estimated value s serves as the ”current”...
- Page 108 (mean values Ni. and Cu. per group, standard deviation s per group), the final result, the control limits as well as the control charts for the nickel coating and for the copper coating: Helmut Fischer GmbH Office West Danziger Straße 1050374 Erftstadt Tel.: 02235 41447Fax: 02235 922990 Fischerscope ®...
- Page 109 Pre-run for determining the control limits Measurement device monitoring for the Fischerscope X-RAY Operation.:5 x 10 measurements Final evaluation fromGroup No. 1 measured 12:22:09 toGroup No. 10 measured 12:39:55 nbl= 1 Ni.= 7.54 μm Cu.= 7.79 μm 0.085 μm s = 0.098 μm nbl= 2 Ni.= 7.45 μm Cu.=...
- Page 110 Measurement device monitoring for the Fischerscope X-RAY Pre-run for determining the control limits All printed values are available in the print form of WinFTM PDM as variables (including the control charts). They can re-calculate the printed control limits by using the original values (mean value x. and standard deviations s) and the equations specified in the previous section.
-
Page 111: Long-Term Monitoring
In such cases, the user should entrust his problem and help to the support and service personnel of FISCHER. FISCHERSCOPE ® X-RAY... - Page 112 Measurement device monitoring for the Fischerscope X-RAY Long-term monitoring FISCHERSCOPE ® X-RAY...
-
Page 113: Def.ma
The usage of the SUPER software requires deep knowledge of the physics of x-ray fluo- rescence and the functionality of the instrument. Alternatively, you can request a new measurement application from FISCHER. FISCHER offers a professional service for the creation of customer’s Def.MA. -
Page 114: Creating A New Def.ma
Def.MA Creating a new Def.MA Tab. 15-1: Def.MA Modes Mode Application Component For the analysis of specimens, which are not only composed of pure mode elements, but also contain chemical compounds (e. g. oxides). WinFTM offers a list of components, which can be used like ele- ments. -
Page 115: Entering Compensation Spectra
Entering Compensation Spectra Def.MA The window Periodic system appears. 8. In the window Periodic system click the element that the layer is composed of. The element, the percentage and the density are displayed in the lower area of the window Definition of Elements New Layer. In case of a complex layer (mixture of materials or alloy) enter more elements and their percentages. - Page 116 Def.MA Entering Compensation Spectra Compensation Elements In the area Compensation Elements you can enter up to four elements. The entered compensation elements are filtered out of the spectrum. If the relevant ele- ment area not shown in the list field, check full Element list. Example tin on glass: The glass contains Strontium (Sr) in variable concentration.
-
Page 117: Display The Measurement Mode
Display the Measurement Mode Def.MA 15.4 Display the Measurement Mode In the window Def.MA there is a field that displays the measurement mode. Depending on the used Def.MA mode (see Table 15-1 on Page 113), this field has the name Mode, Analysis Mode, Thickness Mode, Mass per unit area (relative/absolute), Components‘s Mode or Solution Analysis. - Page 118 Def.MA Display the Measurement Mode ® FISCHERSCOPE X-RAY...
-
Page 119: Calibration
Calibration Calibration 16.0.1 Purpose of the Calibration A calibration is required in the following situations: A new measuring application has been set up. A product was imported. If during a reference measurement a deviation was encountered that is greater than ... - Page 120 Calibration Procedure 1. In the WinFTM main window select Calibrate > Calibration Standard Set... An empty window will appear, if the measuring application has not yet been calibrated. If the measuring applica- tion has already been calibrated, check the values in the window. If the values are plausible, click OK and skip the steps 2.
- Page 121 Calibration Type With multi-coating systems, it may be the case that existing interim coatings act as base material of a calibration stan- dard or that coatings are not present. This setting is made here. 7. Once you have entered all values of a calibration standard, click OK. 8.
- Page 122 Calibration 14. Position the standard and click Start. The instrument will perform the measurement. After the measurement, you will be prompted either to measure a new standard or to measure the same standard one more time. If you measure the same standard again, move it slightly to measure it at a different location.
- Page 123 Calibration Nominal value x measured s measured min. value max. value Evaluation Cr 1.5 μm 1.51 μm 0.03 μm 1.45 μm 1.57 μm Cr 0.77 μm 0.75 μm 0.02 μm 0.68 μm 0.79 μm Not OK The calibration was successful if all re-measurements are within the respective ranges and you are able to use the measuring application.
- Page 124 Calibration FISCHERSCOPE ® X-RAY...
-
Page 125: Measurement Data Export
Starting the Measurement Data Export Measurement Data Export Measurement Data Export You can export the measured values, their XYZ coordinates, statistical evaluations and other data to other applications like spreadsheets, statistical evaluation tools or process control systems. All settings for the measurement data export are assigned to one product. For each product, you can define different settings for the data export. -
Page 126: Export Settings
Measurement Data Export Export Settings 2. In the window Exporting data select the following options: Do not check Online-Export ON. Press the button Select..., which is located besides the fields Template: and No.. Select the export template, e. g. default. Click overwrite file. - Page 127 Export Settings Measurement Data Export Table 17-2: Explanation of the controls of the Exporting data window Control Explanation Online-Export ON The measurement data is exported continuously when measurement data is acquired by the instrument. The reading is exported directly after a measurement is made. ...
-
Page 128: Setting Up An Export Template
Measurement Data Export Setting up an Export Template Table 17-2: Explanation of the controls of the Exporting data window Control Explanation to Excel The data will be directly sent to an Excel file. A new Excel workbook (Workbook 1) opens with the first exported value. - Page 129 Setting up an Export Template Measurement Data Export The window Definition of Export Template appears. The three sub-windows on the left define the different sections of data to be exported: single readings, block statistics and header info. With the check boxes in the area Export Mode you can activate or deactivate the sections.
- Page 130 Measurement Data Export Setting up an Export Template To add a variable to your template: 1. Set the cursor to the position in your template, where the variable shall be inserted. 2. Highlight the variable in the window at the right. 3.
- Page 131 Setting up an Export Template Measurement Data Export Template for block statistics Syntax: Block #@TAB@BLK@TAB@ANB@TAB@LOT@TAB@BM1@TAB@BM2@CRX@LFX x = @TAB@TAB@MW1@TAB@MW2@TAB@MW3 ... MW20@CRX@LFX s = @TAB@TAB@S_1@TAB@S_2@TAB@S_3 ... S_20@LFX@LFX@END NOTE: For more clarity the syntax is shown here in three lines. In the window Def- inition of Export Template the template must be written in one line to avoid unwanted carriage returns and line feeds.
- Page 132 Measurement Data Export Setting up an Export Template Table 17-6: Explanation of the elements Variable Explanation @CAL Contains the product name. @TAB A tabulator will be inserted. The character # will be displayed. @PRN Contains the product number. @CRX A carriage return will be inserted. Operator The text Operator will be inserted.
-
Page 133: Addendum
Description of the Characteristic Statistical Parameters Addendum Addendum 18.1 Description of the Characteristic Statistical Parameters 18.1.1 Block Result Parameter Description Equation Mean value of the single readings, Mean value -- - called arithmetic mean value . The arithmetic mean value is the summation of all single readings Single readings a measurement series (block/group),... - Page 134 Addendum Description of the Characteristic Statistical Parameters Parameter Description Equation Coefficient of Ratio of the standard deviation to the --100 mean value variation Standard deviation Mean value of the block For sufficiently large samples it can be said: -- - ...
- Page 135 Description of the Characteristic Statistical Parameters Addendum 18.1.2 Final Result – Fixed Block Definition Automatic block creation (Block definition fix) is enabled for the product. Parameter Description Equation Mean value of the block mean Mean value values. is the summation of all ...
- Page 136 Addendum Description of the Characteristic Statistical Parameters Parameter Description Equation Coefficient of Standard deviation referring to the --100 mean value variation : Mean standard deviation Mean value of the block mean values Mean range of the block ranges Mean range ...
- Page 137 Description of the Characteristic Statistical Parameters Addendum Parameter Description Equation Process capability index Min C Computed and displayed only if specification limits are enabled – ------------------ - 3 ˆ USL – ------------------- - 3 ˆ Upper specification limit Lower specification limit ...
- Page 138 Addendum Description of the Characteristic Statistical Parameters 18.1.3 Final Result – Variable Block Definition Manual block creation (Block definition variable) is enabled for the product. Parameter Description Equation Arithmetic mean value of the single Mean value -- - readings Single readings of the selected blocks Number of measurements of the...
- Page 139 Description of the Characteristic Statistical Parameters Addendum Parameter Description Equation Difference between the highest and Range – the lowest reading of the selected blocks : Highest reading of the selected blocks : Lowest reading of the selected blocks Range relating to the mean value Range ---100 Range...
- Page 140 Addendum Description of the Characteristic Statistical Parameters Parameter Description Equation Number of measurements that are n (> above the upper specification limit Number of measurements that are n (> ) [%] above the upper specification limit in percent Displayed only if specification limits are enabled Number of measurements that are n (<...
-
Page 141: Periodic Table Of The Elements With X-Ray Properties
Periodic Table of the Elements with X-Ray Properties Addendum 18.2 Periodic Table of the Elements with X-Ray Properties FISCHERSCOPE ® X-RAY... - Page 142 Addendum Periodic Table of the Elements with X-Ray Properties FISCHERSCOPE ® X-RAY...
-
Page 143: System Integration
System Integration Addendum 18.3 System Integration The FISCHERSCOPE X-RAY 5000 instrument is conceived for the integration into a coating plant. The instrument is controlled by the WinFTM software which is running on a separate computer. The export of the measurement results and the remote control of the instrument is possible. - Page 144 Addendum System Integration FISCHERSCOPE ® X-RAY...
- Page 145 System Integration Addendum FISCHERSCOPE ® X-RAY...
- Page 146 Addendum System Integration FISCHERSCOPE ® X-RAY...
- Page 147 System Integration Addendum FISCHERSCOPE ® X-RAY...
- Page 148 Addendum System Integration FISCHERSCOPE ® X-RAY...
- Page 149 System Integration Addendum FISCHERSCOPE ® X-RAY...
- Page 150 Addendum System Integration FISCHERSCOPE ® X-RAY...
- Page 151 System Integration Addendum FISCHERSCOPE ® X-RAY...
- Page 152 Addendum System Integration FISCHERSCOPE ® X-RAY...
-
Page 153: Assignment Of The Electrical Connections
Assignment of the Electrical Connections Addendum 18.4 Assignment of the Electrical Connections Auxiliary connector Safety contacts Indicator X-ray on 5V DC connector USB interface Voltage supply Main switch Abb. 18-1: Assignment of the electrical connections Connector Design Auxiliary connector M12 sensor connector, Protection Rating IP68, D-coded Safety contacts M12 sensor connector, Protection Rating IP68, A-coded Indicator X-ray on... - Page 154 Addendum Assignment of the Electrical Connections Safety contact 1 Safety contact 2 e. g. for flange e. g. for vacuum A-coded Angle Plug Abb. 18-2: Assignment of the safety devices 18.4.2 Operation of the Safety Contacts To monitor the contacts, the instrument generates 5V pulses. At the input pins (pin 2 and 4 in Fig.
- Page 155 Assignment of the Electrical Connections Addendum 18.4.3 Assembling the Safety Contacts Connector A M12 angle plug with screw terminals by the company Binder is used as safety contacts connector (Binder 4 contact angle plug 713). No crimp applicators or similar tools are necessary for assembling.
- Page 156 Addendum Assignment of the Electrical Connections FISCHERSCOPE ® X-RAY...
-
Page 157: Data Sheet
DATA SHEET ® FISCHERSCOPE X-RAY 5000 Series X-Ray Fluorescence Measuring System for Continuous In-line Measurement and Analysis of Thin Coatings, i.e. CIGS, CIS, and CdTe, in Production Processes Coating Thickness Material Analysis Microhardness Material Testing... - Page 158 FISCHERSCOPE X-RAY 5000 Series Main Features The instruments of the FISCHERSCOPE X-RAY 5000 series are innovative, energy dispersive x-ray fluorescence measuring systems (EDXRF) for in-line applications in industrial production sites. They are especially designed for continuous non-destruc- tive analysis and measurement of thin layers and layer systems in production lines.
- Page 159 General Specification Intended use Energy dispersive x-ray fluorescence measuring system (EDXRF) to analyze and measure coatings and layer systems continuously in production processes. Element range Sodium Na (11) to Uranium U (92) if measured in vacuum Chlorine Cl (17) to Uranium U (92) if measured in the atmosphere Features Calibration Quick and easy with a master standard directly in the production process...
- Page 160 Fischer Instrumentation Electronique, 78180 Montigny le Bretonneux, France, Tel. +33 1 30 58 00 58, france@helmutfischer.com Helmut Fischer S.R.L., Tecnica di Misura, 20099 Sesto San Giovanni (Milano), Italy, Tel. +39 0 22 55 26 26, italy@helmutfischer.com Fischer Instruments, S.A., 08018 Barcelona, Spain, Tel. +34 9 33 09 79 16, spain@helmutfischer.com Helmut Fischer Meettechniek B.V., 5627 GB Eindhoven, The Netherlands, Tel.
-
Page 161: Winftm Features
FEATURES WinFTM ® Software for FISCHERSCOPE X-RAY ® Fluorescence Spectrometers Coating Thickness Material Analysis Microhardness Material Testing... - Page 162 Contents Overview ..........163 WinFTM Versions: BASIC and LIGHT .
-
Page 163: Overview
The usage of the SUPER software requires deep knowledge of the physics of x-ray fluo- rescence and the functionality of the instrument. Alternatively, you can request a new measurement application from FISCHER. FISCHER offers a professional service for the creation of customer’s Def.MA. -
Page 164: Fisim
The different versions and extensions of WinFTM are activated by different FISIMs (Fischer Software Identification Module). A FISIM is a dongle, which is plugged into the computer’s USB socket, before WinFTM is started. Look at the data sheet of your instru- ment to find out, which WinFTM version and extension is running on your system by de- fault. -
Page 165: Features Of Winftm Basic And Light
Integrated Technology Features of WinFTM BASIC and LIGHT Features of WinFTM BASIC and LIGHT The following section describes the features of the software versions BASIC and LIGHT. If there are restrictions in the LIGHT version, they are indicated in the text. Integrated Technology Coating thickness measurement and material analysis can be performed in one run. -
Page 166: Material Analysis
Features of WinFTM BASIC and LIGHT Material Analysis With the LIGHT version max. 4 or 5 individual parameters of a specimen can be measured (thickness: 4 elements, composition: 5 elements). Examples: A component is to be measured that has 4 layers each consisting of one element. ... -
Page 167: Automated Material Identification (Class Of Materials)
Automated Material Identification (Class of Materials) Features of WinFTM BASIC and LIGHT Automated Material Identification (Class of Materials) You can easily sort specimens with different compositions and/or coating thicknesses in different classes of materials. You don’t need to perform reference measurements for each composition or coating thickness. -
Page 168: Optical Functions
Features of WinFTM BASIC and LIGHT Optical Functions Optical Functions Function Description Video image of the spec- The specimen is shown in the video window inside the imen WinFTM main window. Scaled crosshairs Scaled crosshairs are electronically inserted into the video image. -
Page 169: Further Features Of Winftm
Further Features of WinFTM Features of WinFTM BASIC and LIGHT Further Features of WinFTM Function Description Standard Windows user Users with basic knowledge of Windows will very quickly ® ® interface be familiar with the program’s user interface. Product functions You can set up, select, delete, edit and copy products. - Page 170 Features of WinFTM BASIC and LIGHT Further Features of WinFTM Function Description Calculating the random The measurement uncertainty, which is based on natural measurement uncertainty count statistics, is an important quantity in measurement u of a measured quantity technology. The measurement uncertainty u of the current single ...
- Page 171 Further Features of WinFTM Features of WinFTM BASIC and LIGHT Function Description Programmed measure- You can simply program routinely repeating measurement ment sequences (Tasks) sequences and execute them automatically. Even very complex measurement sequences can be simplified. Dialogs for operators can be shown on the screen (e.g. ...
-
Page 172: Measurement Data Management
Features of WinFTM BASIC and LIGHT Measurement Data Management 2.10 Measurement Data Management Function Description Block function A block is a concluded series of measurements. Measure- ment data is stored and evaluated as blocks, including the date and time of the measurement, a notepad, the contin- uous number of the block as well as block-related data. - Page 173 Displaying, Documenting and Backing up Measurement Results and Parameters Features of WinFTM BASIC and LIGHT Function Description SPC presentation of the The SPC chart can directly be displayed on the monitor as measurement results x-bar/s chart or x-bar/r chart. For automated measurement sequences with large batch sizes, you can easily recognize long-term changes of the coating thickness and of other process parameters through the presentation of a trend...
-
Page 174: Presentation Of Readings
Features of WinFTM BASIC and LIGHT Presentation of Readings Function Description Copying products You can copy products including related measurement data including measurement e.g. for data backup. data Automatic, time- You can select folders, which will be backed up automati- controlled backup cally. -
Page 175: Calibrating And Monitoring Of The Measuring Equipment
Calibrating and Monitoring of the Measuring Equipment Features of WinFTM BASIC and LIGHT 2.13 Calibrating and Monitoring of the Measuring Equipment Function Description Calibration of new or The obtained calibration data are stored. existing products Standard-free calibration You can calibrate without calibration standards by means of the fundamental parameter method. -
Page 176: Display And Evaluation Of Spectra
Features of WinFTM BASIC and LIGHT Display and Evaluation of Spectra Function Description Automatic reduction of After several minutes of instrument idle the x-ray tube the x-ray tube current current is reduced automatically. Thus, the service life of the tube is increased and energy is saved. Drift compensation A shift of the peak position in the spectrum is compensated by the software. - Page 177 Control the XY(Z) Measuring Stage Features of WinFTM BASIC and LIGHT Function Description Travel to absolute or rela- You can enter absolute or relative coordinates to travel the tive coordinates stage. The zero point of an operation can be specified indi- vidually.
-
Page 178: Winftm Pdm: Expanded Product Data Administration And Result Documentation
WinFTM PDM: Expanded Product Data Administration and Result Documentation Control the XY(Z) Measuring Stage WinFTM PDM: Expanded Product Data Administration and Result Documentation PDM (Product Data Management) is a supplementary software module to WinFTM BASIC or LIGHT. The PDM software features the following functions: Function Description Setting up new products... - Page 179 Control the XY(Z) Measuring Stage WinFTM PDM: Expanded Product Data Administration and Function Description Result documentation You can assign individual print form templates to each product for block and final evaluation. You can evaluate the measurement readings of several ...
-
Page 180: Comparative Overview With/Without Winftm Pdm
WinFTM PDM: Expanded Product Data Administration and Result Documentation Comparative Overview with/without Comparative Overview with/without WinFTM PDM WinFTM PDM (Product Data Management) as a supplemental software is suitable for both WinFTM BASIC and for WinFTM LIGHT. In both cases, the functional scope of WinFTM PDM is identical. -
Page 181: Winftm Super: For The Experienced X-Ray User
The usage of the SUPER software requires deep knowledge of the physics of x-ray fluo- rescence and the functionality of the instrument. Alternatively, you can request a new measurement application from FISCHER. FISCHER offers a professional service for the creation of customer’s Def.MA. - Page 182 WinFTM SUPER: For the Experienced X-RAY User Comparative Overview with/without WinFTM PDM WinFTM ®...
- Page 183 WinFTM ®...
- Page 184 Fischer Instrumentation Electronique, 78180 Montigny le Bretonneux, France, Tel. +33 1 30 58 00 58, france@helmutfischer.com Helmut Fischer S.R.L., Tecnica di Misura, 20099 Sesto San Giovanni (Milano), Italy, Tel. +39 0 22 55 26 26, italy@helmutfischer.com Fischer Instruments, S.A., 08018 Barcelona, Spain, Tel. +34 9 33 09 79 16, spain@helmutfischer.com Helmut Fischer Meettechniek B.V., 5627 GB Eindhoven, The Netherlands, Tel.
- Page 185 Installation and Training of a FISCHERSCOPE X-RAY with WinFTM Instrument model: Date: Serial No.: WinFTM Version: Customer: Supplier: ............HELMUT FISCHER GMBH Institut für Elektronik und Messtechnik ............Industriestraße 21 ............71069 Sindelfingen, Germany Instructor: Participants: Parts of the training...
- Page 186 Description of the display Select product Def.MA: without FISIM with FISIM Product Data Management existing? If yes please use training protocol Product Data Management Create an product: Calibrate Calibration standard set Produce a control sample Create product „control sample“ Monitoring of the Conception: instrument: Constance over time...
- Page 187 Index Index Fluorescence 12 Fully protected instrument 8 ASTM B568 7 Functional principle of the instrument 13 back-up 83 IEC 348 7 BASIC 163 IEC 348 / VDE 0411 Directive 7 block 172 Intended Use 7 Evaluation 70 Intensity 35 Class of Materials 167 Large Number Presentation 27 Communication...
- Page 188 Index PDM supplementary software 57 Performing Measurements 19 WinFTM 11, 23, 163 Preparing measurements, process WinFTM main window 23 flow 37 Print Form Template Editor 58 Process flow for preparing measurements 37 Product 37, 38 Ratio Method 167 Reference Samples 46 Repeat Inspection 8 residual 166 Safety 7...
Need help?
Do you have a question about the FISCHERSCOPE X-RAY 5000 Series and is the answer not in the manual?
Questions and answers