Table of Contents
Advertisement
Quick Links
Advertisement
Table of Contents

Related Manuals for Sonatest Wave


Summary of Contents for Sonatest Wave
- Page 1 Wave User Manual...
- Page 2 Wave User Manual Version 4...
-
Page 3: Table Of Contents
Wave User Manual Contents 1 INTRODUCTION 1.1 W HAT IS 1.2 A PPLICATION ONCEPT 2 WAVE CARRY CASE 3 WAVE PHYSICAL CHARACTERISTICS 3.1 T CREEN 3.2 T OWER UTTON 3.3 LED B EHAVIOURS 3.3.1 T EVICE URNED OFF 3.3.2 T... - Page 4 Wave User Manual 6.6 A LARMS 6.6.1 A LED C LARM CREEN OLOURS 6.6.2 C OMPLEX LARMS 6.7 L AYOUT 6.8 T OOLBAR 6.8.1 F CREEN 6.8.2 S AVE A ONFIGURATION 6.8.3 C REATE A EPORT 6.8.4 Q UIT AN...
- Page 5 Wave User Manual 12.2.1 C DAC C REATE A URVE 12.2.2 DAC S IZING PTIONS 12.2.3 A DAC G BSOLUTE AND ELATIVE 12.2.4 A MPLITUDE ORRECTED AND NCORRECTED EASUREMENTS 12.3 TCG 12.3.1 C TCG C REATE A URVE 12.3.2 TCG S...
- Page 6 Wave User Manual 14.1 G ENERAL 14.1.1 B RIGHTNESS 14.1.2 H ONTRAST 14.1.3 D ATE AND 14.2 L ANGUAGE 14.3 N ETWORK 14.3.1 W IRED ETWORK ONNECTION 14.3.2 N ETWORK ONNECTION VIA 14.4 A BOUT 14.5 L EGAL 15 UPDATES 15.1 I...
- Page 7 Wave User Manual 23.1 B ATTERY 23.2 USB-C C ONNECTOR 23.3 S YSTEM TATUS 23.4 H HUTDOWN 23.5 A PPLICATION 24 GLOSSARY Version 4...
- Page 8 Sonatest Limited. Sonatest Limited or its subsidiaries provide this manual “AS IS” without warranty of any kind, either express or implied. Included but not limited to the implied warranties or conditions of merchantability or fitness for a particular purpose.
-
Page 9: Introduction
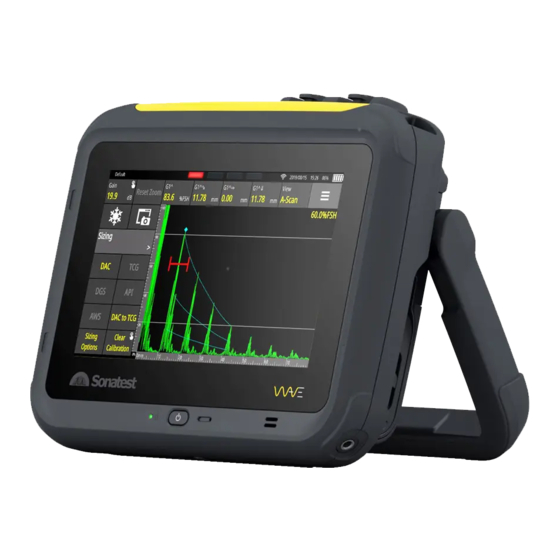
1 Introduction 1.1 What is Wave? Wave is a new generation, smart flaw detector. It has been designed to simplify the work of technicians and engineers. It is based on simple, custom-made applications that can be tailored to meet the specific requirements of different inspection procedures. -
Page 10: Wave Carry Case
The Wave carry case includes: ● Wave instrument; ● Smart Li-on battery pack; ● AC/DC battery charger; ● Ethernet to USB-C adapter; ● Ethernet cable; ● Quick Start Guide booklet; ● Couplant bottle. Figure 1 – Wave Transport Case Version 4... -
Page 11: Wave Physical Characteristics
3 Wave Physical Characteristics 3.1 The Screen The seven-inch screen of Wave occupies most of the front area of the instrument. It is made of glass, which makes it very easy to clean, and is protected on all sides with a rubberised contour. -
Page 12: Led Behaviours
If Wave is connected to the power supply, which means the device is charging, the • LED will blink. If Wave is connected to the power supply and it is fully charged, a solid green LED • light is displayed. -
Page 13: The Ut Connectors
TX/RX Expansion GPIO Figure 4 – Wave connectors and the expansion ports 3.4.1 The UT Connector Pinouts The following tables describe the pinouts of the UT connectors. Figure 5 and Figure 6 illustrate the localisation of the pinouts in the Lemo connector and BNC. -
Page 14: The Gpio Connector
Wave User Manual Figure 5 – Lemo ultrasound connector pinouts Figure 6 – BNC ultrasound connector pinouts 3.5 The GPIO Connector An additional connector is present just beside the UT connectors. This is the GPIO connector for encoder inputs and digital outputs namely used for alarms. -
Page 15: The Expansion Port
(Lemo) 3.6 The Expansion Port The expansion port is a Sonatest proprietary connection that will allow adding extra accessories. The protector cap over the expansion port must remain in place to protect the connector. It should only be removed when attaching an accessory. -
Page 16: Charging Through Usb-C
Figure 8 – Wave from the left side 3.7.1 Charging Through USB-C Wave’s USB-C port is hence used to recharge the instrument’s battery. The AC-DC power supply provided with the unit allows fast charging. Typically, a full recharge of a dead battery to 100% charge level will take just over 3 hours even if the unit is turned on during recharge. -
Page 17: The Battery
Figure 10 – Battery icon 3.9 The Unit’s Stand At the back of the Wave instrument, there is a stand providing a full 180⁰ of adjustment, without any position limitation in between 0⁰ and 180⁰. The stand, when fully extended, can serve as a handle to carry the unit. - Page 18 Wave User Manual Version 4...
-
Page 19: Powering Up And Shutting Down
The instrument is powered up by pressing the power-on button located at the bottom, just under the display. Power button Figure 11 – How to power up the Wave 4.1 Shutting Down the Unit Shut down the unit from the Home screen. By pressing the red On/Off button, you will be presented with a confirmation screen where you can select between Shutdown, Reboot, or Cancel. -
Page 20: Main Screen Overview
Wave User Manual 5 Main Screen Overview There are several screens available in Wave. This section highlights the main features of each screen. For more details, see the corresponding sections. 5.1 Home Screen When powering up your instrument, you will be presented with the Home screen, where all the available applications appear. -
Page 21: Preferred Configuration
Wave User Manual Figure 14 – App Description screen NOTE: From the App Description screen, you can delete a configuration or a report by using the Delete button. This requires a long press, as indicated by the long press icon. -
Page 22: Inspection Screen
Wave User Manual 5.3 Inspection Screen Once a configuration is chosen, the inspection will begin. From top to bottom, the on- screen action buttons are permanent buttons that are always displayed, even in full- screen mode (see Section 6.2). The Freeze button is used to freeze the signal on the screen (see Section 6.3). -
Page 23: Report Screen
Wave User Manual 5.4 Report Screen This screen has six tabs on the left and filters at the top. The filters are used only for the selection of the Source and Image. Figure 16 – Report screen The Source is used to define the reference screenshot that will populate the report. The General tab allows you to add information about the customer and the inspected part. -
Page 24: The Basics - Inspection Screen
Scan • Plan If an app has different menus, it means that they have been modified by the Wave Companion. To have access to a different menu (and its proper list of parameters), simply press the displayed menu item to make a list of menus appear. Select the desired menu from that list. -
Page 25: Permanent On-Screen Action Buttons
6.2 Permanent On-screen Action Buttons At the top left of the Wave’s screen, there are two (2) permanent action buttons, regardless if the unit is in full screen or not. These are described below. Table 5 - On-screen action button... -
Page 26: Screen Capture
All parameters related to the screenshot will be saved for use when a report is created. 6.5 Gates Wave supports four (4) gates. All can be used simultaneously and all offering all measurements. NOTE: The gate to gate measurements are possible between Gate 1 and Gate 2 (G1-G2), and between Gate 3 and Gate 4 (G3-G4). -
Page 27: Moving Gates And Changing Gate Properties
Wave User Manual 6.5.1.1 From Menu To enable a gate, simply select the gate from the menu. Note that Gate X stands for Gate 1, Gate 2, Gate 3, or Gate 4. Press GX Enabled to change its value to Yes. -
Page 28: Setting A Gate On A Scan Plan View
Wave User Manual Alternatively, you can also press on a gate. After doing so, the gate will appear with handles. Figure 20 - Gate handles The left arrow, when dragged left or right, will change the starting point of the gate and its length. -
Page 29: Alarms
There are four alarms, simply named Alarm 1 to Alarm 4. They all appear at the top of the Wave display. If an alarm is not active, it will not be visible. If it is enabled but not triggered, it will appear dimmed, like a turned-off LED. When enabled and triggered, the alarm will appear bright, like a turned-on LED. -
Page 30: Complex Alarms
Alarm 2 is Gate 2, and so on. 6.6.2 Complex Alarms Wave allows to generate alarms based on complex events. For example, Alarm 1 could be triggered by conditions from Gate 1 or Gate 2. When an alarm is triggered by a complex condition, it will appear differently, as shown below. -
Page 31: Toolbar
Wave User Manual A-Scan Scan Plan A+Plan Part T-Log A+T-log Figure 24 – All views or groups of views available NOTE: The T-Log and A+Tlog views are only available when you select T-Log in the Sizing menu. Similarly, the Part view is only available in the Part menu. -
Page 32: Full Screen Mode
Wave User Manual Toolbar menu Figure 25 – Toolbar menu 6.8.1 Full Screen Mode This drop-down menu is where you can get access to the full-screen display where only the Gain, Reset Zoom and measurements remain displayed, allowing the A-Scan to extend to the full width of the screen. -
Page 33: Create A Report
Wave User Manual When saving a configuration, you will be presented with the following screen, allowing you to enter a file name under which the file content will be saved. Figure 27 – Save a configuration 6.8.3 Create a Report This button allows you to create a report directly from an inspection. -
Page 34: Measurements
Wave User Manual 7 Measurements The measurement bar is displayed at the top of the screen. There are four measurements, each one showing any possible measurement, depending on the gates used. As an example, the above figure shows measurements that can be displayed when only Gate 1 is enabled. - Page 35 Wave User Manual The following table shows the various measurement choices for different gates. Table 10 - Measurement choices versus gates Source Gate Measurement Basis Measurement Gate 1 to Gate 4 Peak %FSH, Sound Path, Depth, True Depth, Surface Distance, Surface Distance Minus X Offset,...
-
Page 36: Measurement Definitions
Wave User Manual 7.1 Measurement Definitions Here are some additional information regarding the peak, first peak and flank: Peak: The highest value inside the gate. Flank: The first positive flank to cross the gate (the first value higher than the gate threshold that crosses the gate). -
Page 37: Measurements Reference Table
Wave User Manual Flat part T-joint part Curved part Figure 32 – Visual representation of true depth measurement 7.2 Measurements Reference Table Following is a complete table of measurements and their associated symbols, where X is the gate number. Table 11 - Measurement reference... - Page 38 Wave User Manual Gate Measurement Symbol Meaning Peak Surface GX^⇒-X Distance from front of the probe to position of peak relative to the surface Distance minus X-offset Peak %Ref GX^%REF Amplitude referred to the curve (DAC, TCG and DGS) or to the reference amplitude (Ref.
- Page 39 Wave User Manual Gate Measurement Symbol Meaning Flank Sound Path GX/⇘ Sound path distance measured at flank GX/⇓ Flank Depth Depth at flank position Flank True Depth GX/⇓⊻ True depth at flank position (takes skips into account) Flank Surface GX/⇒...
- Page 40 Wave User Manual Gate Measurement Symbol Meaning Peak %DAC(U) DAC^%(U) Peak measurement, in %, relative to DAC curve. Uncorrected if the gain changed. Use with care Peak dB DAC(C) DAC^dB(C) Peak measurement, in dB, relative to DAC curve. Corrected if the gain...
-
Page 41: Measurement Values
The normal condition: this is the value of the measurement 7.4 Measurement Coordinates References Wave adds quite a few new capabilities for the inspection of complex parts. For example, when inspecting T joints with fillet welds, the ray tracer will show the beam path travelling everywhere in the part. -
Page 42: Measurements Units
Wave User Manual Surface distance Depth Figure 33 – Measurements in complex shapes Let’s say that the red dot in the above figure represents the position of a flaw, as it would be indicated in the measurement of a gate. The red dot is positioned over the horizontal line where the probe lies. -
Page 43: Ultrasonic Parameters - Advanced Notions
Wave User Manual 8 Ultrasonic Parameters – Advanced Notions This section informs you about more advanced notions regarding Wave’s ultrasonic parameters. It is assumed that the concepts in Section 6 have already been understood. 8.1 The A-Scan View The A-Scan appearance and background can be adjusted in numerous ways. The following table describes all the actions offered that can change the A-Scan. -
Page 44: Auto 80% Fsh
Wave User Manual by double-tapping on the gate. Exit this “zoom in gate” mode by using the Reset Zoom on-screen button (top left of display). The alternate way of zooming in an A-Scan is simply by using the same zoom gesture you use on your smartphone, that is by using 2 fingers and spreading them apart. -
Page 45: Signal Menu
Wave User Manual NOTE: The pulse width is automatically set when setting the probe frequency. Although this parameter is calculated automatically, it corresponds to 0.5/frequency in square mode. In spike mode, it is equal to 50 ns. 8.3 Signal Menu The A-Scan view can be modified in different ways. -
Page 46: Filter Reference Table
Wave User Manual 8.3.1 Filter Reference Table Following is the list of these filters available on the Wave. For each frequency, you have its centre frequency as well as their low and high pass frequencies. Table 16 – Filter Reference Table... -
Page 47: Gate Advanced Settings
Wave User Manual 8.4 Gate Advanced Settings This section presents slightly more advanced features for the gates. 8.4.1 Gate Polarity The Gate Polarity parameter may take the following values: absolute, positive or negative. Here is a brief description of each: ●... -
Page 48: The Probe Selection
Wave User Manual 9 The Probe Selection The Probe menu allows you to choose a probe in a probe list and to generate a probe, called Generic, based on some ultrasonic parameters. Probe model available by clicking here Figure 35 – Access to Probe Selection IMPORTANT: It is not possible to save a Generic probe file. - Page 49 Wave User Manual The left columns include fields (Manufacturer, Frequency, Type, Angle, DGS Only, Show Recent) to help you search for a probe. The table on the right shows the list of available probes according to the fields chosen. In the probe list, it is possible to sort them by clicking Model, Manufacturer, Frequency, Angle or Size.
-
Page 50: The Part Wizard
Flat T-joint Corner joint Curved part Figure 37 – Part types available on Wave NOTE: The part type choice influences the weld types. Thus, not all weld types will be available depending on the chosen part. 10.1.1 Part Type Dimensions Table 17 shows the available dimensions according to the chosen part. -
Page 51: Weld Types
Wave User Manual system (see Section 7.5). A checkbox indicates that this part dimension is visible for a given part. Table 17 - Part types and their dimensions available Flat part Curved part T-joint Corner joint Thickness Horizontal thickness Vertical thickness... - Page 52 Wave User Manual Double V Single U Double U Single J Double J Bevel Groove Version 4...
- Page 53 Single Fillet Weld Double Fillet Welds Figure 38 – Welds available with Wave The availability of these welds depends on the type of part chosen beforehand. Table 18 illustrates these possibilities. A checkbox indicates that the weld is visible for a given part.
-
Page 54: Weld Dimensions
Wave User Manual 10.2.1 Weld Dimensions You have the possibility to modify as desired all the dimensions of a weld. Again, the tiles are dynamic. Thus, depending on the type of weld chosen, the visibility of the available dimensions will be modified. It should be noted that all dimensions are available in the SI system as well as in the imperial system (see Section 7.5) -
Page 55: Wizard
Wave User Manual Lw1: Effective throat of the left-side fillet weld ● Lw2: Effective throat of the right-side fillet weld ● 10.3 Wizard The goal of the wizard is to quickly and simply guide you to define the part to be inspected and the weld, if any. -
Page 56: The Scan Plan View
Wave User Manual 11 The Scan Plan View The Scan Plan View allows you to see the part with the probe and the distances. Of course, it is possible to add visual elements such as welds, real A-scan ray tracer and grids. -
Page 57: Moving A Probe
Wave User Manual 11.2 Moving a Probe To virtually move the probe over the test piece image, you just need to click the probe and move it to the desired position. All geometric parameters are then automatically adjusted. View the following video for how to move a probe into the Scan Plan View. -
Page 58: Auto Cal And Sizing Methods
The Auto Cal automates this process so that only two readings are required, one on the thin sample and one on the thick sample. The Wave then sets the Velocity and Probe Zero. This Auto Cal operation must be repeated any time the test material is changed (velocity) or the transducer is changed (zero). - Page 59 When the first echo is recorded, Wave automatically sets the Gain at 80% FSH by default. You can change the reference amplitude to other values with the Ref.
-
Page 60: Dac Sizing Options
Wave User Manual You can add up to 16 points to a DAC curve and also have four Split DACs, depending on their needs. View the following video for how to create a DAC curve. 12.2.2 DAC Sizing Options Once a DAC curve is created, these are the following sizing options available for the DAC sizing method. -
Page 61: Amplitude Corrected And Uncorrected Measurements
Wave User Manual The figure below is based on the same previous example; however, the Gain Mode is set to Absolute instead. The A-scan is indeed +6 dB higher, while the DAC curves have not moved. Please note that corrected (C) measurements provide a compensated amplitude reading. -
Page 62: Tcg
Wave User Manual Figure 45 Corrected and uncorrected measurements when +1 dB is applied Corrected measurements, such as the screenshot above, is the recommended way to use DAC measurements. Regardless of the Gain Mode, the scanning gain is 1 dB stronger than the current reference gain (42.7 dB+ 1.0 dB = 43.7 dB). - Page 63 When the first echo is recorded, Wave automatically sets the Gain at 80% FSH by default. You can change the refence amplitude to other values on Ref. Amplitude button based on your requirements.
-
Page 64: Tcg Sizing Options
Wave User Manual 12.3.2 TCG Sizing Options After creating a TCG curve, you can easily switch from TCG to DAC and back, via the DAC to TCG button. Once the TCG curve is created, you can still set the Transfer Loss making the curve visible, as shown on the following figure. - Page 65 Press Calibrate once the echo is correctly located in the calibration window. Wave will automatically set the gain as the Reference Gain. Wave will then apply it to finalise the calibration procedure.
-
Page 66: Dgs Sizing Options
Wave User Manual Once a DGS probe is selected, you may set some additional parameters. Table 23 – Additional parameters for DGS sizing options Option Meaning Ref. Attenuation Attenuation finds the attenuation losses at the calibration step. Material Att. Material attenuation of the test piece. Once the DGS calibration is done, it applies the attenuation effect on all DGS curves. -
Page 67: Performing An Aws Calibration
When the echo is recorded, Wave automatically sets the Gain at 80% FSH by default. You can change the refence amplitude to other values on Ref. Amplitude button based on your requirements. -
Page 68: Api
It assumes that radial depth of a discontinuity affects either the amplitude of the received echo signal and the differential time of flight of the incident ultrasonic wave as it passes through the discontinuity. -
Page 69: Api Sizing Option
Wave User Manual Figure 50 – API K factor calculated after the calibration View the following video for how to perform an API calibration. 12.6.2 API Sizing Option To calibrate the API, only one sizing option is available. Table 26 – API sizing option... -
Page 70: Parameter Descriptions
Wave User Manual 12.7.1 Parameter descriptions The following table describes the grid’s parameters. Table 27 – Grid parameters Button Choices Action Grid Width 1 to 200 cells Determines the width of the grid Grid Height 1 to 200 cells Determines the height of the grid Depends on the selected measurement Determines the cell’s colour... -
Page 71: Colour Palette
Colour Palette A cell can have up to six colour palettes. The following table features the colours based on the Wave’s contrasts. The extreme values of each colour are identified. Table 29 – Colour palette for the T-log Normal contrast... -
Page 72: T-Min Function
You can export all stored values to a .csv file. All they need to do is click on Save to CSV button. Wave will then automatically generate four .csv files. Each file will include one of the measurements recorded in the data table. The names of the files will be automatically... - Page 73 (M1, M2, M3 and M4). To access the files, you must connect to the device through the Wave Companion software. Once connected, they will be able to select the desired files and transfer them to their computers.
-
Page 74: Report
Wave User Manual 13 Report The Wave reporting tool has been designed to generate a report based on a source. This source is in fact a screenshot that includes all the information from the configuration. Therefore, once the source is selected, the report data is automatically filled in. However, you are free to modify some of the information. -
Page 75: Screenshot
Wave User Manual As will be explained in the following sections, the reporting module is not limited to the specific workflow described above. For example, once a report is created and saved, it is very possible to suspend the process at this point and only send the report at a later time, for example once someone would be near a Wi-Fi access point. -
Page 76: Name And Comment
13.2.2 Rating and Colour Additionally, Wave allows to classify screenshots using 2 useful properties: the rating and the colour. The rating is 1, 2 or 3 stars. A good way to use ratings would be, for example, to set all screenshots that need to be part of a report with 3 stars, as they indicate a flaw. -
Page 77: Create A Report
Wave User Manual 13.3 Create a Report There are two ways to create a report, either from the App description screen or directly from the current Inspection screen. Although they both produce a similar result, each has its own specific details. -
Page 78: From The App Description Screen
Wave User Manual 13.3.2 From the App Description Screen In the App Description screen, click on the Reports tab. Then, click on the Create button. Figure 61 - Launching report creation from the App Description screen 13.4 Report Creating Screen Creating a report is quite quick and easy. - Page 79 Wave User Manual Figure 62 - Editing a screenshot during when generating a report Once the edit is completed, exit with the Save button. The system will bring you back to the Source tab of the report. The same happens if you hit cancel to ignore all changes to the screenshot.
-
Page 80: General
Wave User Manual 13.4.2 General This tab presents general information of the report. There are four sections: Customer Information, Part, Weld Type and Weld Dimensions. Note that the last category is only present if the weld type is different from None. Each category includes parameters that are specific to it. -
Page 81: Inspection Summary
Wave User Manual 13.4.2.1 Company Information This section allows you to enter your company information, such as the name and the address. This information will be visible in the header of the report once it is generated. 13.4.2.2 Customer Information The parameters of this category are Customer, Project Number, Location and Inspection Date. - Page 82 Wave User Manual Figure 66 – The sections for the Inspection Summary tab By default, the fields are empty; they have to be entered manually. 13.4.3.1 Description This field is designed to allow you to write down a summary of the inspection. You have a limit of 1000 characters, including line breaks.
-
Page 83: Images
Wave User Manual Regarding the date, there are two ways to change it. It is possible to write the date in text form, e.g., December 19, 2020, or using the date picker. If the date picker method is chosen, the date format will be linked to the language choice in Settings (see Section 14 for more information). -
Page 84: Ut Parameters
Wave User Manual Figure 69 - Additional screenshots to add to the report The list of selected screenshots can be easily reordered by simply dragging and dropping a specific screenshot appearing in the list on the right-hand side of the screen. Therefore, you can have the screenshots appear in any order in the report that will be created later. - Page 85 Wave User Manual NOTE: Some parameters might be hidden when you look at the screen. Do not hesitate to scroll with your finger. 13.4.5.1 Code and Calibration This section is used to identify the procedure and calibration block used for the inspection.
-
Page 86: Probe And Wedge
Wave User Manual 13.4.6 Probe and Wedge As indicated by the name, this section presents the parameters related to the probe and wedge. By default, Couplant is the only field left empty; it must be filled in manually. This means that all other parameters are intrinsically linked to the Source. Nevertheless, all of them can be modified by a visual keyboard or a numerical keypad. - Page 87 Wave User Manual At this point, the report is not saved. Adjustments are still possible. All you have to do is click on the back arrow to make the changes. The following table shows the sections displayed according to the pagination of the report.
-
Page 88: Navigation In The Pdf Report
Wave User Manual 13.5.1 Navigation in the PDF Report Navigating within the report is easy thanks to the touch screen. In order to zoom in or zoom out, you simply have to pinch in or pinch out the screen. Use your fingertip to navigate anywhere on the screen. -
Page 89: View An Existing Report
Wave User Manual From here, you will be required to write the name of the report. It is mandatory for you to give a name to the report in order to save it. Figure 75 The virtual keyboard is displayed in order to save the report At any time, you can press the Cancel button to go backwards. -
Page 90: Delete An Existing Report
The Wave Companion allows you to retrieve any files, including reports. Of course, the Wave and the Wave Companion must be on the same network (Internet or not). For more information on downloading files, please refer to the Wave Companion User Manual 13.8.2... - Page 91 Figure 78 – Compose Email screen 13.8.2.1 To and Cc These are the fields for entering an email address. The Wave is able to store up to 10 email addresses. If an eleventh is added, the least used address will be removed from the list.
-
Page 92: Settings
Wave User Manual 14 Settings Wave settings are available by clicking the gear wheel located in the top right corner of the Home screen. Figure 79 - Access to the Settings via the Home screen 14.1 General The General includes three sub-menus, which include the brightness, contrast, and date and time. -
Page 93: High Contrast
Wave User Manual 14.1.2 High Contrast You can toggle between two contrasts. The High Contrast is useful when Wave is used outside. Figure 81 – Normal contrast (black background) versus high contrast (white contrast) 14.1.3 Date and Time You can automatically or manually choose the date and time. To automatically configure the date and time settings, you must be connected to the Internet. -
Page 94: Wired Network Connection
In the case of a wire connection, the IP address is visible in the Network section, under the Instrument Name. Figure 84 – The IP address of a Wave unit when it is connected to a network via a wire. Version 4... -
Page 95: Network Connection Via Wi-Fi
Figure 85 – Icon when the device is connected to network via a wire 14.3.2 Network Connection via Wi-Fi In order to connect Wave to Wi-Fi, toggle the Wi-Fi button. Figure 86 – Network connection via Wi-Fi The available networks are displayed. Some icons may appear next to a Wi-Fi network: A lock indicates it is a private network. -
Page 96: About
Wi-Fi network. 14.4 About This section gives you some basic information about your Wave, like the date of the Last Calibration, the Software Version, the Firmware Version and the Serial Number. 14.5 Legal Wave was designed to be ultrasonic inspection equipment. -
Page 97: Updates
15.2 USB-C Update If the Internet connection is not available, it is still possible to update the Wave. Simply put the update file on a USB-C stick and reach the Software Update screen. From there, click on the USB tab and the corresponding update file will be displayed. Then, just press the Update button. -
Page 98: Remote Connection And Vnc
You must keep in mind that by setting up a remote connection with your Wave will not allow you to “virtually” manipulate/operate the instrument from its own laptop. It means that there will be no interaction with your instrument;... -
Page 99: Sharing Your Internet Connection From Your Mobile Phone
IP address will be automatically set to your instrument. Sonatest suggest downloading and installing a VNC viewer on your laptop that allows you to set a remote connection to your instrument. This will allow you to share your screen on your laptop’s screen. -
Page 100: Menus And Parameters Reference
Wave User Manual 17 Menus and Parameters Reference Signal Signal (continued) Velocity Rectification 4.5 MHz narrow ● ● Full ○ Probe Zero 4.5 MHz wide ● +Half ○ Range 5 MHz narrow ● -Half ○ ○ Delay 5 MHz wide ●... - Page 101 Wave User Manual TX/RX Sizing Sizing (continued) RX Mode TCG Visible ● ● ● Pitch-Catch ○ ● ○ Pulse-Echo ○ ● ○ Through AWS C Rounded ○ ● ● Transmission ○ ● Voltage ● ○ DAC to TCG ● ABCD Visible 100 V ●...
- Page 102 Wave User Manual Part Probe Part menu is a wizard in fact. See Section 9 for Probe Model ● more details. Probe Selection ○ Angle ● X-offset ● Wedge Velocity ● Probe Zero ● Frequency ● Probe Width ● Probe Height ●...
- Page 103 Wave User Manual Display Display (continued) Alarms Units Ruler Mode Alarm 1 Enabled ● ● ● Distance ○ ○ ○ Imperial Time ○ ○ ○ Line Appearance Overlay Mode Alarm 1 Source ● ● ● Thin None ○ ○ ○...
- Page 104 Wave User Manual Alarms (continued) Alarms (continued) Alarm 1 GPO Alarm 3 GPO ● ● None None ○ ○ ○ ○ ○ ○ ○ ○ ○ ○ Alarm 2 GPO Alarm 4 GPO ● ● None None ○ ○ ○...
- Page 105 Wave User Manual Gate 4 Scan Plan G4 Enabled Beam Exit Point ● ● Probe Distance ○ ● Rulers ○ ● G4 Start Both ● ○ G4 Width None ● ○ G4 Level Grid Type ● ● G4 Polarity None ●...
-
Page 106: Wave Companion
Wave Companion User Guide. 18.1 Connect Wave to the Wave Companion In order to take advantage of all the features available in Wave Companion, the unit and application must be connected to the same network. Please refer to Section 14.3 to learn how to connect Wave to a network. -
Page 107: Quality Assurance
Wave User Manual 19 Quality Assurance Wave was designed to meet and to surpass several international standards. All Wave units are tested for quality assurance before delivery to customers. The following list shows the standards that Wave has been tested for: EN 12668 •... -
Page 108: Maintenance
To clean the instrument and its accessories use a soft cloth and ordinary liquid soap. Try to clean Wave as often as possible to avoid any accumulation of dust, oil, grease, or couplant. Special attention needs to be given to the battery door. Make sure the battery door gasket is properly clean and free of particles. -
Page 109: Usb-C Connector
You can recharge electronic devices with the USB-C connector available, but it may affect the durability of the battery. 20.6 Travelling When travelling, Wave should be placed in its transportation case to avoid any major damages and mechanical impacts. Version 4... -
Page 110: Additional Resources
21 Additional Resources 21.1 Probes Before operating the Wave, connect it to a probe. Probes can be connected to sockets on the top of the instrument. Make sure to use appropriate cables and to properly connect them to the probes. Otherwise, it may lead to considerable power losses or to echo waveform perturbation. -
Page 111: Warranty And Disclaimers
Sonatest Limited in connection with the use, features and qualifications of the Wave are based on tests believed to be reliable, but the accuracy or completeness thereof is not guaranteed. Before using the product, you should determine its suitability for your intended use based on your knowledge of ultrasonic testing and the characteristics of materials. -
Page 112: Troubleshooting
Make sure you did not click the Freeze button or double-clicked the power-on to • lock the screen. If nothing is working with Wave, you can do a hard shutdown by long pressing and • holding the power-on button for 10 seconds. This action should be considered as a last resort. -
Page 113: Application
Wave User Manual 23.5 Application I have transferred an application and it is not working. Make sure you have not transferred a corrupted application. A corrupted • application features a logo with a crossed-out circle. You cannot open this application. You must replace the application with one that is not corrupted or simply deleted the corrupted application. -
Page 114: Glossary
Wave User Manual 24 Glossary α (degree): Bevel angle α β (degree): Bevel angle β Angle (degree): Angle of the ultrasound beam exiting the probe API: American Petroleum Institute AWS: American welding Society DAC: Distance amplitude gain Delay (mm or in): Offset of the left side of the A-scan. - Page 115 Wave User Manual RX Mode: Pulsing Mode S1 (mm or in): Weld depth of the bevel #1 S2 (mm or in): Weld depth of the bevel #2 TCG: Time corrected gain Transfer loss (dB): dB loss due to surface conditions, poor coupling, etc.
- Page 116 Wave User Manual Version 4...
- Page 117 Distributed by: Sonatest (HQ) Sonatest (North America) Dickens Road 12775 Cogburn Old Wolverton, Milton Keynes San Antonio, Texas MK12 5QQ 78249 United Kingdom United States +44 (0) 1908 316345 +1 (210) 697 0335 sales@sonatest.com sales@sonatestinc.com Part No: 147440 Issue 4_190121...
Need help?
Do you have a question about the Wave and is the answer not in the manual?
Questions and answers