Table of Contents
Advertisement
Quick Links
µTrace setup guide for Embedded
µTrace setup guide for Embedded
µTrace setup guide for Embedded
Artists LPC4357 development
Artists LPC4357 development
Artists LPC4357 development
1
1
1
board
board
board
Embedded Artists LPC4357 Guide
Embedded Artists LPC4357 Guide
Embedded Artists LPC4357 Guide
16 October 2013
16 October 2013
16 October 2013
Advertisement
Table of Contents

Summary of Contents for Lauterbach mTrace
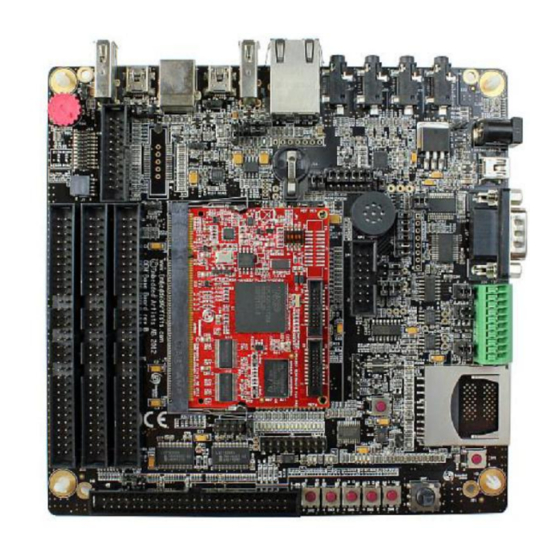
- Page 1 µTrace setup guide for Embedded µTrace setup guide for Embedded µTrace setup guide for Embedded Artists LPC4357 development Artists LPC4357 development Artists LPC4357 development board board board Embedded Artists LPC4357 Guide Embedded Artists LPC4357 Guide Embedded Artists LPC4357 Guide 16 October 2013 16 October 2013 16 October 2013...
-
Page 2: About This Document
About this document About this document This document will explain how to get up and running with the Lauterbach µTrace unit and the Embedded This document will explain how to get up and running with the Lauterbach µTrace unit and the Embedded This document will explain how to get up and running with the Lauterbach µTrace unit and the Embedded... - Page 3 From the File menu, select Run Batchfile..., browse to $T32SYS and select From the File menu, select Run Batchfile..., browse to $T32SYS and select From the File menu, select Run Batchfile..., browse to $T32SYS and select startup.cmm. You should see a window which looks like startup.cmm.
- Page 4 If your system does not have a system with the license highlighted. If your system does not have a multi core license, please contact your local Lauterbach sales office. multi core license, please contact your local Lauterbach sales office.
- Page 5 Now take a copy of your config.t32 file and call it Now take a copy of your config.t32 file and call it Now take a copy of your config.t32 file and call it ; Environment variables ; Environment variables ; Environment variables config-2nd.t32.
-
Page 6: Run Control
Tutorials Tutorials Tutorials This section will provide some basic tutorials to help familiarise users with the TRACE32 concept. This section will provide some basic tutorials to help familiarise users with the TRACE32 concept. This section will provide some basic tutorials to help familiarise users with the TRACE32 concept. Run Control Run Control Run Control... - Page 7 The processor's peripheral control registers can be accessed via a dedicated The processor's peripheral control registers can be accessed via a dedicated The processor's peripheral control registers can be accessed via a dedicated menu which is dynamically added at runtime once the menu which is dynamically added at runtime once the menu which is dynamically added at runtime once the user has made their CPU selection.
-
Page 8: Performance Analysis
Memory Memory Memory Memory can be viewed by selecting Dump... from the View menu. Enter the Memory can be viewed by selecting Dump... from the View menu. Enter the Memory can be viewed by selecting Dump... from the View menu. Enter the address to view and set any relevant options. -
Page 9: Online Help
You can also contact your local Lauterbach representative if you have any questions about the operation of You can also contact your local Lauterbach representative if you have any questions about the operation of You can also contact your local Lauterbach representative if you have any questions about the operation of the µTrace unit or the TRACE32 software interface. - Page 10 Trace Examples Trace Examples Trace Examples All of the previous tutorials have been using the JTAG or SWD interface. The next batch will look at using All of the previous tutorials have been using the JTAG or SWD interface. The next batch will look at using All of the previous tutorials have been using the JTAG or SWD interface.
-
Page 11: Code Coverage
In the trace list window, click the Chart button to see In the trace list window, click the Chart button to see In the trace list window, click the Chart button to see a view of functions against time, similar to that in a view of functions against time, similar to that in a view of functions against time, similar to that in Figure T14. - Page 12 Performance Analysis Performance Analysis Performance Analysis Collect some trace data and then from the Collect some trace data and then from the Collect some trace data and then from the Perf menu select Function Runtime Perf menu select Function Runtime Perf menu select Function Runtime and then Show Detailed Tree.
- Page 13 Clicking the List button in the CTS window will Clicking the List button in the CTS window will Clicking the List button in the CTS window will open a different view of the trace data, showing open a different view of the trace data, showing open a different view of the trace data, showing function nesting and function and instruction function nesting and function and instruction...

Need help?
Do you have a question about the mTrace and is the answer not in the manual?
Questions and answers