
Summary of Contents for GeminiBio Orflo Moxi GO II
- Page 1 a subsidiary of ™ Moxi GO II USER GUIDE For Research Use Only. Not For Use In Diagnostic or Therapeutic Procedures.
- Page 2 This document is provided to customers who have purchased Orflo Technologies, LLC (“Orflo”, a subsidiary of Gemini BioProducts, LLC) equipment, software, reagents and consumables to use in the operation of such Orflo equipment, software, reagents, and consumables. This document is copyright protected and any reproduction of this document in whole or any part is strictly prohibited, except as Orflo may authorize in writing.
-
Page 3: Table Of Contents
Contents INTRODUCTION ..............................1 ABOUT THE USER GUIDE ............................1 CONVENTIONS USED IN THE USER GUIDE ......................2 SAFETY PRECAUTIONS ............................2 ................................ 2 LECTRICAL AFETY ................................2 ASER AFETY ............................... 3 IOLOGICAL AFETY MOXI GO II™ SYSTEM OVERVIEW ......................... 4 MOXI GO II ACCESSORIES .......................... - Page 4 Recorded Channels ............................. 30 Data Display Formats – General Output Types ....................30 Fluorescence vs Size Scatter Plot ............................31 Histograms ..................................32 Fluorescence vs. Fluorescence Scatter Plot ........................33 Reading Raw Data Output (Conc., Size, MFI, and %) ..................34 Fluorescence vs.
- Page 5 MOXI GO II – TRAY INSERT REPLACEMENT PROCEDURE ..................71 ................................71 ACKGROUND ..................... 71 YSTEM EQUIREMENTS AND RDERING NFORMATION ............................72 EMOVING AN EXISTING INSERT ..............................74 NSTALLING AN INSERT TROUBLESHOOTING ............................76 MAINTENANCE AND STORAGE ........................... 80 SPECIFICATIONS FOR THE MOXI GO II ™...
-
Page 6: Introduction
Introduction The Moxi GO II™ from Orflo Technologies (a subsidiary of Gemini BioProducts, LLC) is a benchtop instrument that utilizes a disposable thin-film cassette and a combination of a 488 nm laser, two photomultiplier tubes (525/45 nm filter with either a 561nm LP filter or 646nm/LP filter, user-swappable), Coulter Principle-based cell measurements, and on-board software to provide easy-to- run applications and data analysis. -
Page 7: Conventions Used In The User Guide
Conventions Used in the User Guide Within this manual, the following conventions are used to call out certain points, and also to reminder users of areas of precaution for safety reasons. WARNING Alerts you to a situation that may cause injury to the user. CAUTION Alerts you to a situation that may cause damage to the system, loss of data, or incorrect results. -
Page 8: Biological Safety
a maximum output power of 60 mW. Direct exposure to laser radiation, even for a fraction of a second, can be harmful to skin, eyes, or other body parts, including posing a risk of burns and permanent vision impairment or blindness. -
Page 9: Moxi Go Ii™ System Overview
Moxi GO II™ System Overview ™ The Moxi GO II Kit includes the Moxi GO II system, USB Cable (mini USB B to USB A 2.0), USB Power Adapter, one pack of 25 Type S+ (MXC030) Cassettes, the extra 646nm/LP filter, a spare cassette tray insert, and a Quick Start Reference Guide. -
Page 10: Moxi Go Ii
Component Function Touch Screen Display Allows user to interface with the instrument by pressing icons and targets. Displays all information needed for operation and analysis of results. Power/Reset Button Turns instrument on and off and resets the unit when pressed and held for ~10 seconds. Cassette Tray Door The door is manually opened and closed by user to allow insertion of a cassette into cassette tray. -
Page 11: Getting Started
Part Function Power Adapter, US Style Connects USB cable to a 110 VAC outlet USB Cable Connects instrument to Personal computer (PC or Mac) or power adapter Extra tray insert can be user-installed in Cassette Tray Insert cassette tray when adhesive build-up interferes with insertion/removal of cassettes. -
Page 12: Additional Materials Required
Cells need to be prepared as single-cell suspensions. Clusters/aggregates should be broken apart with mechanical trituration (e.g. pipetting vigorously) and/or protease dissociation (e.g., ® ® Accutase or Accumax ). For stubbornly aggregated samples, pre-filtration with a 40 µm cell strainer is recommended. As the Moxi GO II™... -
Page 13: Using The Moxi Go Ii Tm
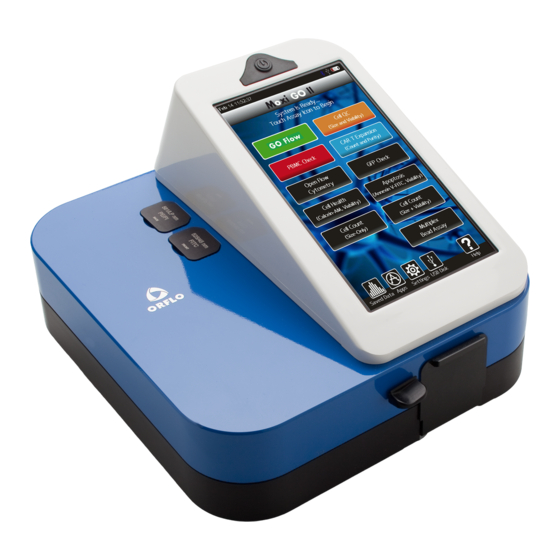
Using the Moxi GO II Press the Power Button to turn on the instrument. The Home Screen will become available. The image below identifies the key items on the Home Screen. Home (Start) Screen Battery/ Charging Date/ Indicator Time Indicator Assays /Applications Help... - Page 14 Depending on the initial purchased configuration of the Moxi GO II system, certain assays/applications may be disabled (examples in images below). These assay can be enabled by contacting Orflo/Gemini (info@orflo.com, 855-879-6694). Grayed out assays are “locked.” Please contact Orflo/Gemini to unlock. (855-879-6694, info@orflo.com) Assays...
-
Page 15: Settings
Settings Date and Time Set the date and time by pressing the Settings icon on the main menu of the instrument. Then touch the Date or Time field. Use the up/down arrow keys to change the values. Passcode Lock The Moxi GO II can be setup to require a password login to use the instrument and access stored data. -
Page 16: Fluorescence Gain
On entering the passcode, the user will be required to “Re-enter Passcode” to prevent accidental entry of a wrong code. Upon successful re-entry of the passcode, the system will display a “lock enabled” message. The system will now require a passcode for access on initial startup and after entering sleep mode. - Page 17 1. Solution Conductivity – As the system utilizes an electrical measurement for counting cells, sizing cells, and metering the fluid volume, cells need to be suspended in a conductive media. The target solution conductivity would be 0.9% salt solution (e.g. PBS or equivalent).
-
Page 18: Running A Test
6. Red Blood Cell (RBC) containing samples – For samples with high levels of RBC’s (e.g. peripheral blood), it is necessary to eliminate/reduce the level of RBC’s in order to prevent those cells from “masking” the cells of interest. The preferred approaches to ®... -
Page 19: Inserting A Cassette
Low, Low, Default, Medium, and High. The initial value populated in this field is determined by the global “Fluorescence Gain” setting that can be set from the Settings icon off of the Home Screen. • Inserting a Cassette: Open the Front Door and depress the Cassette Tray Lever (image below). -
Page 20: Loading A Sample
• Loading a sample: System messages at the top of the screen prompt the user to “Open the Door” (image below/left) and pipette a 60 – 75 µL sample (“Enter the Sample”, image below/middle) into the fill port of the cassette (either test 1 or test 2, depending on which end of the cassette was inserted into the instrument) and close the Door. -
Page 21: "Open Flow Cytometry" Test
• It is best to place the pipette facing straight into the system (not angled left or right) and a ~45degree angle (up/down, see image below) • Dispense the fluid in one, smooth motion as you would normally during pipetting. The system does apply a slight vacuum to pull the fluid it, but it is not recommended to try to “time the load”... - Page 22 2. Select the “Open Flow Cytometry” assay from the Home screen (image below/left) 3. The “X-axis” is always populated with Cell size as its selection; however multiple additional parameters can be selected under the “Y-axis” column. Select the first channel to record from the “Y-axis” column (image below/middle) and select “Next”. Notes: a.
-
Page 23: Go Flow" Tests (Simplified Version Of "Open Flow")
7. Select “Start” or insert a new cassette and close the door to begin the test (start the laser alignment). See “Running a Test - General Instructions” above for further detail. “GO Flow” Tests (Simplified version of “Open Flow”) The “GO Flow” app is meant to simplify, expedite, the “Open Flow Cytometry” selection process by automatically selecting the PMT1 (525/45nm) channel as the “Display”... -
Page 24: "Cell Qc" Test
“Cell QC” Test The “Cell QC” app is designed to provide simplified analysis of cell viability samples either one test at a time or in batch mode (rapid acquisition of multiple samples of the same cell type, using consistent gating). The initial display output of the Cell QC app is a simplified, list of the sample statistics, based on the system’s auto-gating of the sample. -
Page 25: Cell Qc - Start Batch
in the box and using the keyboard below to type a description. The “Dilution Factor” field is a drop-down list with the options of entering “1:1” (no dilution), “1:2” (2x dilution), “1:5” (5x dilution), and “1:10” (10x dilution). Note: the value selected here will automatically be applied to the test count output to adjust the measured counts for the dilution level, providing the true (dilution adjusted) initial starting concentration. -
Page 26: Cell Qc - Initial Test Output (Both Single Run And Batch)
of entering “1:1” (no dilution), “1:2” (2x dilution), “1:5” (5x dilution), and “1:10” (10x dilution). Note: the value selected here will automatically be applied to all tests’ count outputs to adjust the measured counts for the dilution level, providing the true (dilution adjusted) initial starting concentration. -
Page 27: Cell Qc - Test Output - Continuing Batch Testing
refer to the simplified test output screen. The user can return to the simplified “Results Summary” screen by touching the orange “Data Summary” button under the scatter plot. The “Results Summary” screen has the test information at the very top. If this test is part of a batch, the “Batch Name”... -
Page 28: Cell Qc - Batch Run - Saved Data And .Csv Summary File
Following completion of a batch, the user can exit the batch processing by touching the green “No” icon (image above/middle) to exit back to the home screen. Cell QC – Batch Run – Saved Data and .CSV Summary File The batch information is all contained in a sub-folder (under the “Test-Files” main folder) of the Moxi GO II µSD data disk. -
Page 29: Cell Qc - "Add To Existing Batch
Cell QC – “Add to Existing Batch” To append data to existing batch, the user can simply select the “Add to Existing Batch” icon (see above/left) at the first “Cell QC” configuration screen. The system will provide the standard warning (yellow pop-up, see above/left) that batch mode is meant for samples of the same type. Touch “Accept,”... -
Page 30: Running A Multiplex Reference Sample
for unique size discrimination (no size overlap in the size distributions) so that each unique protein (specific to the antibody) could be detected (has its own size “channel” on the scatter plot). As a starting point, the Bangs Labs beads (https://www.bangslabs.com/products/polystyrene-microspheres/functionalized-polystyrene) in the 4µm, 5µm, 6µm, and 7µm bead sizes should work. - Page 31 For a reference bead set, the user has the option of adjusting the size markers so that new lanes are demarcated for identifying the beads. In doing so, the system will automatically update all three of the above indicators. An example for moving the columns in a way that removes beads from falling into the detection lanes is shown in the image above –...
-
Page 32: Running A Multiplex Unknown Sample
Following the reference bead run and gate adjustment (if necessary), the user can hit “Save.” At that point, the size lanes for that reference test are locked-in. Any test compared to it will use those set the size ranges for determination of beads for those sets (no adjustment is possible on the tests to be compared). -
Page 33: Locating All Unknown Tests Linked To A "Reference" Sample
Sample Load and Test Locating all Unknown tests linked to a “Reference” sample As shown in the sequence below, the full list of unknown multiplex sample/tests that are linked to a particular reference multiplex tests can be accessed from the “Saved Data” area. After selecting “Saved Data” from the Home screen, the user can tap one of the “Plex-XXXC.FCS” files to open a particular reference test (Image below –... - Page 34 linked with that reference file. Touching any one of those files will bring up the data table comparison (image below – bottom/left) for those files. Page 29 ™ Moxi GO II User Guide...
-
Page 35: Test Results
Test Results Recorded Channels The Moxi GO II system has the capability of recording the following channels of data for each sample: • Particle Size • PMT1 Fluorescence (525/45nm filtered, e.g. FITC, Alexa 488, GFP, Calcein, et.c) • PMT2 Fluorescence (561nm/LP filtered, e.g. PE, or 646nm/LP filtered, e.g. PI) •... -
Page 36: Fluorescence Vs Size Scatter Plot
Fluorescence vs Size Scatter Plot Test name Population % Test type (touch to change) (defined red and blue gates) Displayed fluorescence channel Toggle between gates: Size (blue), fluorescence Total size-gated (red), and noise (yellow) (between blue gates) counts Right size marker adjust Left size marker adjust (drag to move) (drag to move) Fluorescence scale... -
Page 37: Histograms
Histograms Test type Test name Population % (touch to change) (defined by red and blue gates) Displayed histogram Channel Swipe up/down in Histogram area to change y-axis scale Histogram bin counts Lower (negative/low Fluorescence) cell pop (green) Upper gated (above red Line defined in PMT vs Size view) pop results Lower/Upper overlap... -
Page 38: Fluorescence Vs. Fluorescence Scatter Plot
Fluorescence vs. Fluorescence Scatter Plot Test Type Test name (touch to change) Quadrant 2 (Upper/right) Concentration, MFIs Quadrant 1 (Upper/Left) Concentration, MFIs are (x-axis, y-axis) Touch/drag to move gate Scatter/dot plots (points displayed set by size region of PMT vs size display Tap blue maker and then touch anywhere around Blue marker (Drag to Move center of marker) -
Page 39: Reading Raw Data Output (Conc., Size, Mfi, And %)
Reading Raw Data Output (Conc., Size, MFI, and %) The Moxi GO II™ provides particle concentration and precise sizing information for each gated region, total counts information, fluorescent percentages, and median fluorescent intensities (all where applicable based on the channels selected) for each test. Three example test view screens are shown above (left to right: Fluorescence vs. -
Page 40: Fluorescence Vs. Fluorescence Scatter (Dot) Plot
are shaded yellow. Note: The overlap is a natural consequence of converting the 2D scatter plot data to a 1D Histogram. The two black boxes below the histogram provide the subset concentration (cells/ml), mean particle diameter (Note: This is an “effective” diameter that is based on a precise volumetric measurement (Coulter Principle) combined with a spherical assumption.), particle volume (directly measured by the Coulter Principle approach), and median fluorescence intensity (MFI) values for the negative (green, “Lower Population”) region... -
Page 41: "Pbmc Check" Output
“PBMC Check" Output The initial, simplified output of the PMBC test is shown above. This output is based on the system’s auto-gating of the PMT2 (Propidium Iodide, Viability) vs. Size scatter plot (more detail below) to identify the core PBMC population (by size) and determine the viability (by PI fluorescence). -
Page 42: "Car-T Expansion" Output
The PMT2 (Propidium Iodide, viability) vs size scatter plot is display (above/middle). The placement of the size gates (blue markers, vertical lines, two top dashed red arrows in image above/middle) and fluorescence gate (horizontal red line, two lower dashed red arrows in image above/middle). - Page 43 The data scatter plots/histograms and associated system-set gates can be viewed and adjusted by the user. It is recommended, particularly for the first test in a sequence of experiments, that these gates be checked by the user. The scatter plot is accessed by touching the “Next” icon (image below/right).
-
Page 44: Cell Qc" - Output (Both Single Run And Batch)
“Cell QC” – Output (both Single Run and Batch) An example of the Initial Cell QC “Results Summary” is shown in the image above/left. This initial screen is designed to provide a simple representation of all the cell/sample data based on the system auto-gating of the PMT2 (Propidium Iodide, Viability) vs Size scatter plot (more detail below) to identify the core cell population (by size) and determine the viability (by PI fluorescence). -
Page 45: Quadrant - Data Summary Table Output (Apoptosis, Gfp, Cell Health)
The up/down arrows on the histogram can be used to resize the histogram y-axis (scaling). The “Print BMP” button will save a Bitmap (image, .bmp) file to the Moxi GO II data disk (in the main “Test-Files” folder for single runs or the batch folder for batch runs). That image will be an exact representation of the “Results Summary”... -
Page 46: (General) Recommended Post-Test Workflow
data. Whether or not the data is auto-gated, the user will still have the option to adjust/fine-tune the gates manually. Fluorescence data is presented using Logicle scaling. Logicle scaling is similar to biexponential scaling in flow cytometry. It is implemented to allow for the presentation of negative data (that might result from compensation or baseline averaging) and to better represent the variance of the data by compressing the data region around zero. -
Page 47: Re-Scaling The X Axis (Size Range)
Re-scaling the X axis (size range) Upon completion of a test (but prior to saving the test), the X axis scale can be adjusted. This is accomplished by selecting the re-scale button below the scatter plot (magnifying glass with arrow, see image sequence for a Moxi GO II™ Type S+ cassette below). With each button press, the text under the button changes to indicate the scale range that will be displayed on the next button push. - Page 48 to be saved (or more specifically, to demarcate data to be excluded from being saved). The blue dots allow the user to identify the size range that will be used for generating the summary information (statistics) on the sample. The red dots allow the user to adjust the fluorescent threshold to determine which events will be included in the positive vs.
-
Page 49: Size Gating Of Scatter (Dot) Plots
Size Gating of Scatter (Dot) Plots The results of all fluorescent tests (all tests except for the “Size Histogram” test) are initially displayed as scatter plots with the size (blue) gates enabled (see image above, left). Gates can be adjusted by touching and dragging the blue markers around the edges of the scatter plot (above). -
Page 50: Noise Gating Of Scatter (Dot) Plots
fluorescent gating line. All events/dots that are located above the fluorescent gating line (and within the blue size gates) are included in the “Upper Population” statistics (images below, black box to the right underneath the scatter plot). Those events/dots below the line (and within the blue size gates) are included in the “Lower Population”... -
Page 51: "Web" Or "Quadrant" Gating - Fluorescence Vs. Fluorescence Scatter Plots
of saved events) to correspondingly increase the storage capacity of the disk in terms of number of tests and images that can be saved. This was more significant with the v2.09 and earlier releases of the firmware that were limited to 16Mb storage (vs. 4Gb+ with v2.10 firmware). For almost all tests, it is sufficient to leave this gate, unadjusted, at the system-specified noise exclusion setting. -
Page 52: Store And Recall Of Gate Settings
above). The first step is to define the center point of the quadrants using the blue dot. This dot can be adjusted by touching (anywhere in the general vicinity, e.g. the region defined by the yellow circle in the image above/left) and dragging the marker to the desired location. Touching in the vicinity of the marker (but not on the marker) prevents the positioning of the marker from being obscured by your finger. -
Page 53: Histogram Overlays On Fluorescence Vs Size Scatter Plots
Histogram Overlays on Fluorescence vs Size Scatter Plots Fluorescent and Size histograms overlays on the scatter/dot plot can be toggled on and off by pressing the blue histogram button at the bottom right of the scatter plot (see images below). With histogram overlays turned on, the fluorescent histogram appears as a blue histogram with a base on the left (fluorescent) axis (blue dashed lines point to the histograms in the images below). - Page 54 reprocesses the raw data wave to generate a 1000 bin histogram across the smaller size range, thereby improving the resolution. Swipe Swipe up/down up/down to Rescale to Rescale The Counts (Y axis) scale can be adjusted swiping your finger up or down in the white histogram area.
-
Page 55: Changing Display Axis For Tests (Pmt Vs Size, Histogram Only Views, "Web" Or Quadrant Views)
Changing Display Axis for Tests (PMT vs Size, Histogram Only Views, “Web” or Quadrant Views) Y-axis Select X-axis Select The test output can be modified to display any recorded channel vs another channel or, individually, with a histogram-only view. The change the display axis, the X/Y button (image below, frame at the top/right) can be selected. When X/Y is pressed the available channels for each axis are displayed in the gray boxes at the top and to the right of the current scatter (image below, frame at top/middle) plot (or histogram). - Page 56 and x-axis values to generate the corresponding data display. The size axis can only be selected as the x-axis. Some examples are shown in the above figure (but not all possible permutations) including: • Long Pass (PMT2) fluorescence histogram (image above, top/right frame). Displayed by selecting “Histo”...
-
Page 57: File/Test Operations
File/Test Operations Test Naming and Renaming Tests By default, tests are named with an automated prefix based on the test type (“GFP” for GFP Check, “Via” for Cell Counts (Size + Viability), “Open” for Open Flow Cytometry and GO Flow, “PBMC” for PBMC Check, “CAR” for CAR-T Expansion, “QC” for Cell QC, “Apop” for Apoptosis, “Hlth”... -
Page 58: Exporting Data Screenshots
delete the test. Selecting Yes will remove any history of the test. Selecting No will cancel the delete operation. All saved tests can be deleted as a batch by selecting the Delete All button in the Saved Data area of the instrument or by checking tests in the Saved Data area and selecting the Delete Selected button. - Page 59 • Moxi GO II configuration files are displayed as light gray. Tests can be sorted by either Name, Date, or Type (FCS, BMP, etc.) by touching the corresponding icon in the “Sort by” field at the bottom left of the screen. Touching the same icon (e.g.
-
Page 60: Compare/Overlay Saved Tests
• Scroll up/down (one file at a time) the list by touching the up/down arrows to the right of the file list. • Page up/down (ten files at a time) the list by sliding the up/down arrows to the right of the file list. Files can be selected for batch operations by touching the corresponding white checkbox (or deselected by touching the red “X”... - Page 61 icon (or File | Save icons). The overlay is then available as a blue comma-separated-value (CSV) file entry in the Saved Data area (see image above bottom/left, example Ovl-002.CSV). Page 56 ™ Moxi GO II User Guide...
-
Page 62: Compensation (Of Spillover)
Compensation (of Spillover) Overview/Background There is an expected spectral overlap when using PMT filter detection in 525/45nm and 561nm/LP for particular fluorophores. Depending on the fluorophores used in a test, and their relative intensities, the fluorescence signal of a given fluorophore might “spillover” from its primary fluorescent channel/PMT into the secondary fluorescent channel/PMT. -
Page 63: Standard - Single Test - Compensation
5. When running future tests, verify the compensation setting is toggled to “Use Prior Value” (other option is “None”). The system should automatically set this for you to ensure that the established compensation value is applied to all future tests in the experiment (until system power-off). - Page 64 percentage of every green event is registered on the red channel). To proceed with compensation, use the red and blue gate markers to position the control population/cluster into the bottom-left corner of the quadrant plot and the spillover population/cluster into the bottom right corner of the quadrant plot (as shown in the image below –...
- Page 65 Touching “Auto Adjust” will have the system automatically calculate and apply a compensation percentage (image below – bottom/right red arrow and box). The compensation value can be fine-tuned (or manually adjusted) by touching the arrows (red bracket in image above – below/right) as follows: •...
-
Page 66: Compensation With Negative Control (Load Control Set)
on the PMT2 scale as the dark cluster). The third row shows an example of compensation for a dual-label (FITC-Annexin V and Propidium Iodide) Jurkat Apoptosis test. Note that the applied compensation only affects the cluster in the lower/right, which corresponds the FITC- AnnexinV+/PI- population. -
Page 67: Compensation - Future Tests
Compensation – Future Tests For compensated data sets, the level of compensation is always (all views, including histograms) displayed on the fluorescent axis label in red text. An example is shown in the image below/right for a fluorescence vs. fluorescence scatter plot view. The last, saved compensation levels for any particular assay type (e.g. - Page 68 Page 63 ™ Moxi GO II User Guide...
-
Page 69: Exporting Data - Connecting Via Usb (Usb On-The-Go)
Exporting Data – Connecting Via USB (USB on-the-go) Each saved Moxi GO II™ test is saved in the Flow Cytometry Standard (FCS) v3.1 format (International society for Advancement of Cytometry, http://isac-net.org) and can correspondingly be opened by any commercially available FCS v3.1 compatible software package (e.g. -
Page 70: Put The Moxi Go Ii Tm In Usb Connect Mode
Put the Moxi GO II in USB Connect mode Touch the “USB Disk” icon (image above/left) Touch the “Connect Disk” icon (image above/middle) iii. Wait for the “Connected” icon to light up (image above/right). Notes: • It may take a couple of minutes to light up. • Once that disk is connected, the Moxi GO II disk will appear as an external drive on your computer. -
Page 71: Safely Disconnect Moxi Go Ii
Safely disconnect Moxi GO II from the Computer Safe eject disk from computer Safe-eject the Moxi GO II drive from the computer. • Windows: Click on the “Safely Remove Hardware” icon in the system tray (bottom right of Windows taskbar). Select the option to eject the Moxi GO II disk. -
Page 72: Moxi Go Ii Tm Apps
2. Press the Next icon to view the next visual instruction that demonstrates how to pipette a sample into the cassette. 3. Press the Next icon to proceed to the next instruction screen or press the Previous icon to return to the previous screen. - Page 73 • Loader – Puts unit is Firmware/OS loader mode • Restart – Reboots the unit • Off – powers the unit off. • Migrate – Used to migrate pre-v2.10 firmware data from old (16Mb) flash disk to the new (4Gb) µSD disk. This should be done immediately following the firmware update. The general sequence is shown below.
-
Page 74: Instrument Firmware And Software Upgrades
Instrument Firmware and Software Upgrades This User Guide describes OS version 2.10 of the Moxi GO II™ firmware. The firmware may be updated periodically. For information on the most up-to-date firmware, visit the ORFLO website at www.orflo.com. Register your instrument in order to receive notification about relevant firmware upgrades. - Page 75 Page 70 ™ Moxi GO II User Guide...
-
Page 76: Moxi Go Ii - Tray Insert Replacement Procedure
Moxi GO II – Tray insert replacement procedure Background A new cassette tray design has been created for the Moxi GO II to allow users to address the occasional need to clean the system cassette tray of adhesive build-up. The adhesive build-up can eventually lead to increased resistance to the insertion and removal of cassettes from the system. -
Page 77: Removing An Existing Insert
• Additional inserts, or inserts for non-warranty systems, may be purchased using product code MXA090. Removing an existing insert IMPORTANT: Make sure to unplug Moxi GO II USB/Power cable from system before starting this procedure. Leaving it in place can result in damage to both the cable and the system when the system is being tilted back (connectors can break). - Page 78 2. (While keeping the tray lever position with your left hand) Using right hand thumb and forefinger, gently lift up on the center tab (red arrow in images below) of the tray insert while pulling out to slide the insert out. Pull insert all the way out. Once out, the tray lever can be released.
-
Page 79: Installing An Insert
Installing an insert IMPORTANT: Make sure to unplug Moxi GO II USB/Power cable from system before starting this procedure. Leaving it in place can result in damage to both the cable and the system when the system is being tilted back (connectors can break). 1. - Page 80 3. Once the insert is all the way in, release the tray lever. If insert is properly installed, the tray should close all the way and the insert should be flush with the black top mount in the system (see image below/right). If the tray doesn’t close and there is a gap (see image below/left), push gently on the tray lever and try to push the insert further in.
-
Page 81: Troubleshooting
Troubleshooting Symptom Cause Corrective Action Try charging the unit overnight (minimum, overa Battery gauge has reset or battery a weekend is recommended). Make sure battery Battery will not fully charge is faulty or has surpassed its is plugged into an AC adapter, not a USB port. service life Battery charges fastest when powered on. - Page 82 525/45nm filtered emission or 561nm/LP filtered emission) Use of Phycoerythrin (PE) with Replace back filter with 561nm/LP filter. PE is 646nm/LP filter in PMT2 not detectable when using the 646nm/LP filter Make sure the proper antibody clone and target Incorrect antibody used. species is selected for the cells being used.
- Page 83 A smaller particle population might have a left tail that extends into the system noise (below the specified range of the cassette). Re-scaling the Small Particles x-axis (can only be done after a test, prior to saving) can increase the binning resolution around these populations, helping to better view the peak.
- Page 84 Resource Error: Missing Missing System Files Contact ORFLO Technical Support. Resource Try the other side of the cassette or a new Cassette error cassette Sensor Error: This sensor is an If this affects multiple cassettes, please contact unknown type Sensor Contact error ORFLO Technical Support.
-
Page 85: Maintenance And Storage
Maintenance and Storage Storage Store the Moxi GO II and Cassettes at room temperature in a dry environment. For best results, cassettes should be used within one year of purchase. Avoid prolonged exposure to ultraviolet light as it may degrade the touch screen display or discolor the external surfaces of the instrument. - Page 86 The Moxi GO II contains a 3.7 V, 7500mAh lithium ion battery. The battery is incorporated in the system only to buffer the power surges that occur during the activation of the laser and PMT’s and to ensure that a temporary unplugging of the system does not result in a power-off. The system is NOT intended to be operated under battery power.
- Page 87 Maintenance There is no routine maintenance required for the Moxi GO II . In addition, there are no user serviceable parts with the exception of the ability to swap out the tray insert (see instructions above). Instrument repairs must be carried out by authorized personnel only. Page 82 ™...
-
Page 88: Specifications For The Moxi Go Ii
™ Specifications for the Moxi GO II and Cassettes System Performance Detection Parameters 5 (2-color fluorescence, cell count, cell size, forward extinction) 488 nm Excitation Laser Wavelength Number of PMTs PMT1: 525/45 nm (e.g FITC, GFP, Alexa 488) Optical Detection Range PMT2: User-swappable, either 561 nm LP (e.g PE) or 646nm/LP (PI, avoids need for compensation) Impedimetric (Coulter Principle) - Page 89 Counts 1 x 10 – 1.75 x 10 cells/ml Optimal fluorescence < 5 x 10 cells/ml Type S+ cassette Counts 1 x 10 – 7.5 x 10⁵ cells/ml Optimal fluorescence < 3 x 10 cells/ml Measurement Time ~ 5-10 seconds Software Includes a (pre-loaded) instrument-only FW/SW package that drives instrument performance and on-...
-
Page 90: Ordering Information
Ordering Information This section lists catalog numbers for the Moxi GO II and related products. You can purchase ORFLO products through a regional distributor or on-line at www.orflo.com. See the Technical Assistance section for information about contacting ORFLO. Product Description Product Code Moxi GO II Kit, US Version... -
Page 91: Warranty
Warranty What is Covered By Your Warranty ORFLO Technologies warrants its products will meet their applicable specifications when used in accordance with their published instructions* The ORFLO product warranty is a “bumper to bumper” warranty on your ORFLO automated cell analysis product for the term of the warranty. This includes all electrical parts, mechanical parts, batteries, displays, materials and workmanship. -
Page 92: Applicable Patents
Express or Implied Warranties and Other Legal Stuff ORFLO Technologies makes no other warranty, express or implied. There is no warranty or merchantability or fitness for a particular purpose. The warranty provided herein and the data, specifications, and descriptions of ORFLO products appearing in ORFLO’s product literature may not be altered except by expressed written agreement signed by an officer of ORFLO Technologies. - Page 93 A subsidiary of Page 88 ™ Moxi GO II User Guide...
Need help?
Do you have a question about the Orflo Moxi GO II and is the answer not in the manual?
Questions and answers