Table of Contents
Advertisement
Advertisement
Table of Contents

Related Manuals for Gsertel RCS 50


Summary of Contents for Gsertel RCS 50
- Page 1 RCS 50-RCS 100-RCS 400 Remote monitoring systems User Manual Version 9.02...
-
Page 2: Table Of Contents
User Manual Index Safety Requirements ............................5 Specifications ..............................7 Table of options ............................... 10 Overview ................................11 Description of Equipment Components: ...................... 11 Start Up ................................13 RCS Web Application ............................. 15 1.- RCS Setup ............................. 16 1.1.- System Configuration ........................16 1.1.1.- System ............................ - Page 3 User Manual 3.5.- Tree View ............................56 3.6.- Service Monitoring-Option 902558- .................... 57 3.7.- RDS Analysis –Only for RCS100 and RCS400- ............... 57 3.8.- TS Recorder ........................... 58 3.9.- Quality of Service –Option 902538. Only for RCS100 and RCS400- ........60 4.- T2-MI Analysis -Option 902513 only for RCS100 and RCS400- ...........
- Page 4 User Manual...
-
Page 5: Safety Requirements
User Manual Safety Requirements Product Inspection Inspect the equipment for shipping damage. Should any damage be discovered, immediately file a claim with the carrier. Read and follow all instructions All the safety and operating instructions should be read prior to and followed while operating this product. - Page 6 User Manual The interruption of the protective conductor is prohibited in both the plug and the meter. The disruption may result in the risk that the product is a source of electric shock. Do not overload wall outlets, extension cords or power strips as this may cause fire or electric shock.
-
Page 7: Specifications
User Manual Specifications RCS 400 RCS 50 RCS 100 General Specifications Display Graphic LCD STN. Resolution:256x64 Format 1U 19” rackable unit Weight 3250 g. Dimensions 448x380x43.3mm Operating temperature -5ºC to 45ºC (23ºF to 104ºF) Storage temperature -20ºC a 70ºC (-4ºF a 158ºF) - Page 8 User Manual CBER: 9.9E-2 – 1.0E-6 BER Measurements VBER: 9.9E-2 – 1.0E-8 Left Shoulder < 50 dB Right Shoulder < 50 dB Accuracy +- 2dB Resolution 0.1 dB Constellation Diagram Option 902511 √ Echoes SFN Drift Graphs Option 902511 √ Polling Feature Option 902557 Frequency offset...
- Page 9 User Manual Extended T2-MI PLP extraction Option 902567 (Up to 8 streams) IP Measurements (Option 902518 only for RCS100 and RCS400) Maximum arrival interval √ between packets Minimum arrival interval √ between packets √ IP payload bitrate √ UDP payload bitrate √...
-
Page 10: Table Of Options
12 months RCS 400 support and warranty (12 months of extended warranty, e-mail technical 902522 support and software updates) 902560 12 months RCS 50 support (12 months of e-mail technical support and software updates) 12 months RCS 50 support and warranty (12 months of extended warranty, e-mail technical 902561 support and software updates) -
Page 11: Overview
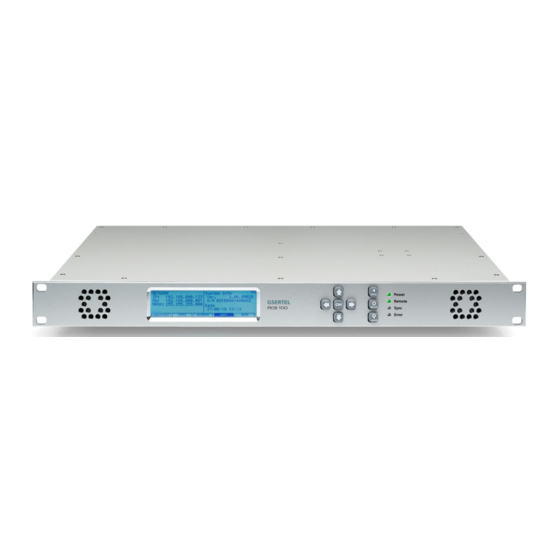
User Manual Overview The RCS is a powerful tool to monitor and analyze the Transport Stream traffic that carries information of audio, video and data of the DVB-T and DVB-T2 digital television channels. The RCS 100 is able to analyze one RF and one ASI inputs. The RCS 400 is able to analyze up to four RF inputs and four ASI inputs. - Page 12 User Manual Back: RCS 50 RCS 100 RCS 400 RF input ASI IN HDMI ASI OUT REF 1PPS Power Supply REF 10MHz Fuses (only old hardware versions) (only for old hardware versions) TSoIP On/Off Button (only for old hardware versions)
-
Page 13: Start Up
Start Up 1.- Place the RCS in the rack 2.- Connect the RCS to power supply 3.- Connect the RCS to internet, using the Ethernet connector 4.- Turn the RCS on by pressing the button 5.- When the RCS starts, the display will show the Info menu, so you will see the IP assigned to your RCS . - Page 14 User Manual To access the application, you must introduce an user name and the corresponding password. For the first time, you must use the following ones: User: admin Password: rcs Once you have entered in your application, you will be able to change your user name and your password.
-
Page 15: Rcs Web Application
User Manual RCS Web Application The RCS web application is organized in various sheets. Each sheet groups several features. In this way, the user has an easy and quick access to any function. The first time the user open the application, it will appear the “All in One” sheet selected: Access the settings by clicking the gear Click to see the alarms profiles Wheel. -
Page 16: Rcs Setup
User Manual 1.- RCS Setup At the top right of the screen, there is a gearwheel icon. When you click on it, you will access the configuration menu. Only system administrators and technicians have access to the RCS configuration (see section 1.3.- System users). - Page 17 User Manual SNMP: The RCS system incorporates a SNMP agent to send traps of the generated alarms to a server selected by the user. A SNMP client must be running in the server to receive the traps from the RCS. The IP server can be entered on the "Trap IP Address" field. It is also necessary to indicate the “Trap Community”...
- Page 18 User Manual Window size: It defines the duration of the window analysis (in seconds) to detect black/frozen images. By increasing this value, more robust the algorithm will be. The minimum recommended value is 5 seconds. Uniform variation analysis and Small packet analysis: These two parameters define the algorithm's behaviour.
-
Page 19: 2- System Users
User Manual Manual Mode: When the parameters of the DVB-T2 signal change since the last synchronization, the RCS detects the change and shows a message to re-synchronize the equipment. Once the user re-synchronizes the device, a SFN DRIFT Resync alarm is activated. Auto Mode: When the parameters of the DVB-T2 signal change since the last synchronization, the RCS detects the change and it is re-synchronized automatically. -
Page 20: System Info
User Manual The RCS allows to access the system only to registered users. This screen shows the list of active users in the system. You can also add a new user or delete any of the existing registered users. The system comprises 3 types of users: administrator, technician, and viewer. There is no restriction on the number of users of each type. - Page 21 First of all, the RCS checks if it has an USB flash drive connected. If so, the RCS looks for a new firmware version in the USB flash drive. So you can download the last version from our web: www.gsertel.com and save it in the root directory of the USB flash drive and connect it to the RCS...
- Page 22 If the RCS is not connected to the internet, the user can select an update file from his computer (it must be previously downloaded from our web page https://www.gsertel.com/documents/RCS/update_files/. The RCS verifies that the file is correct and that it is a newer version. If not, an information message will be shown.
- Page 23 User Manual 3.- A bar will show the updating progress: 4.- After the update, the system will show the message “UPDATE FINISHED. Update successful. The system is going to reboot”. NOTE: Browsers use to store in an own cache the last webs visited. After the update some browsers could show an old web stored in cache, instead of the new (updated) RCS web.
- Page 24 User Manual Below it will be explained the steps you must follow to erase the browser cache Google Chrome web browser: 1.- Choose “Configuration”: 2.- Click on “Advanced options”:...
- Page 25 User Manual 3.- Choose “Clear browsing data”: 4.- Select all the checkboxes, and select “beginning of time” on the menu at the top. Then click on “Clear browsing data”: 5.- Close browser and open it again.
-
Page 26: Input/Output
User Manual 1.2.- Input/Output This feature allows to enable all the inputs/outputs that the user wants to, both RF and ASI or IP (option 902518). This window depends on the RCS model: RCS50 has 1 RF input and 1 ASI output (option 902554), RCS100 has 1 RF input, 1 ASI input and up to 8 IP stream input (option 902518), and the RCS400 has 4 RF inputs, 4 ASI inputs, and up to 8 IP stream input (option 902518). - Page 27 User Manual All the parameters are explained bellow. Inputs: Alias: is a name that the user can assign to the input and that will appear in the top bar of the web application, allowing the user to identify the input easily. Enable: allows to enable/disable the input.
-
Page 28: Channel Plans
User Manual If your RCS has the internal GPS option, there are two ways to synchronize it: by using the external 1PPS signal, or using the external GPS. In the image above, if you select GPS Enable ON, you can choose the signal you want to use to synchronize your RCS: AUTO: The RCS tries to synchronize first to the GPS signal. - Page 29 User Manual To edit a RF channel plan you must export it to a .CSV file, make the changes in the .CSV file and then import it to the RCS. Note: the information about the alarms profile won’t be exported/imported to the .CSV file.
-
Page 30: Asi
User Manual Warrning: When the user selects a frequency that doesn’t belong to any of the channels of the plan (so it has not any Alarms profiles assigned to it), the last alarms profiles used will be applied automatically 1.3.2.- ASI This feature allows to assign an alarms profile to each ASI input (see section 1.5.1.- Alarms Profiles). -
Page 31: Ip Channel Plans (Only For Ip Inputs - Option 902518 For Rcs100 And Rcs400-)
User Manual 1.3.3.- IP Channel Plans (only for IP inputs - option 902518 for RCS100 and RCS400-) This feature allows to select, create, delete, edit, import and export IP channel plans, As well as to assign an alarms profile to each channel (see section 1.5.1.- Alarms Profiles). The RCS allows to choose a different alarms profile for each channel of the plan. - Page 32 User Manual Delete: Deletes the selected channel plan. Note: the active channel plan can not be deleted. Export: Exports the selected channel plan to a .CSV file. The alarms profiles won’t be exported to the .CSV file. Import: Imports a channel plan from a previously created file using the Export function. Using the Export and Import features, you can copy a channel plan from a RCS to another.
- Page 33 User Manual VLAN Table Editor You can edit the VLAN table by using the VLAN selecting the New/Edit option in the VLAN ID field of any channel of the list: If you select New/Edit option, a new window will be open with the VLAN list: You must provide an unique unicast IP address to each VLAN.
-
Page 34: Utilities
User Manual Delete Channel: Deletes the selected channel from the plan. 1.4.- Utilities 1.4.1.- DataBase Management Measurements and system alarms are saved in the probe database, grouped by months. The user can delete from the database the groups he wants to. To do that, select the month files that you want to delete and then click on the “Delete selected archives”... -
Page 35: Cloning
User Manual The system allows to make a total or a partial cloning. This way, an expert user can manage all his equipments in a flexible way. To restore a backup copy, you must first select the type of data you want to recover from the file. You can restore configuration data, input/output settings, bitrate profiles, and DVBT2 templates. -
Page 36: Profiles
User Manual 1.5.- Profiles 1.5.1.- Alarms Profiles Using this window, you can set up the alarms that the system will generate. There are several types of alarms: RF, ASI, IP, ETR290, Services, PID Blacklist, PID Bitrate, and Quality of Service. In fact, the PID Blacklist is not a list of alarms. - Page 37 User Manual Actions that the user can Select the type of do with the selected Configuration parameters. the alarms profile profile Depends on the type of profile List of profiles of the selected type. To select click on the button placed on the left There are four controls that are common to almost all the profile types (RF, ASI, IP and ETR290): TS Rec., Active, Type and Trap.
- Page 38 User Manual NOTE: The colors of the bars of the measurements listed in the several application windows, correspond with the colors of the alarm thresholds: blue if it is on the threshold of "Info", yellow if you are on the threshold of "Alert", red if it is on the threshold of "Error", and green in the case that the measurement is correct.
- Page 39 User Manual During the Time ON period of time During the period of Time ON there are only there are at least 3 times when the 2 times when the measurement is out of the measurement is out of the thresholds thresholds, so the system does not generate the alarm-on message Measurement threshold...
-
Page 40: Bitrate Measure Profile
User Manual Alarm-on periods of time Measurement threshold Threshold-Hysteresis Time axis Alarm-on Alarm-on Alarm-off Alarm-off When the system is in polling mode, the stabilization margin is provided by the number of cycles during which a measurement is out of the thresholds (Cycles ON). In the polling mode, the alarms configuration works in the same way for both transport and RF measurements. -
Page 41: Profiles Shortcut
User Manual In the left-hand column there is a list of the profiles as defined in the ETR290, with their corresponding parameters: T is the total period of time, N is the number of windows of time and t is the duration of each window of time. - Page 42 User Manual...
-
Page 43: All In One -Option 902553 For Rcs50
User Manual 2. All in One –Option 902553 for RCS50- This feature allows the user to have a global vision of the status of the selected input in a single screen. This feature is available for RF, ASI and IP inputs, but there are some differences depending on the type of the selected input (RF, ASI or IP). - Page 44 User Manual If the services of the channel are encrypted, the images of the screenshot will be a grey square with a lock and the word “Even” or “Odd”, depending on the scrambling status of the service, as you can see in the image bellow: ...
- Page 45 User Manual : there isn’t any active alarm currently, but there was one active alarm at least, since the Purple last time the alarm cache was deleted. Filters: by clicking on the corresponding buttons, you can filter the alarms you want to see in the list according to color, type or active/all alarms.
- Page 46 User Manual Enables the HDMI output to display the image of the selected service (Enable service) or the images of all the channel services (Enable carreousel). In this latter case, each service will be displayed for a few seconds and the next service is displayed.
- Page 47 User Manual Save ScreenShot: Makes a snapshot of the current image of the selected service. View Matrix: Select the number of screenshots visible on the grill. Note: If you select the option of one screenshot on the grill, two buttons are displayed at the top that allows you to change the service.
- Page 48 User Manual You can also see a mosaic Distribution of transport with the screenshots of all services and the bitrate of Edit button: the services of the channel each one. Charts with the evolution Goes to IP that are refreshed when the T2-MI mode is over time of UDP payload channel plans...
- Page 49 User Manual o Packet arrival minimum: It is the minimum interval of arrival between packets in one second. o IP payload bitrate: It is the bitrate of the IP packets payload. o UDP payload bitrate: It is the bitrate of the UDP packets payload. o Media loss rate: It is the ratio between the number of uncorrected wrong packets by the total number of packets received per second.
- Page 50 User Manual Click on the card icon to see the information about the CI card. If the services are not unlocked by the CI card or the CI card is not placed in the slot, a grey square with a lock is displayed If you click on the CI card icon (see image above), a popup window will be open to show the card information:...
-
Page 51: Ts Analysis
User Manual 3.- TS Analysis This feature allows a comprehensive analysis of the content of the input signal. The display screen is the same, regardless of the selected input (RF, ASI or IP). NOTE: When the T2MI is enabled in the selected input, the information of this tab is the information of the selected PLP in the list “T2MI packet bitrate”... - Page 52 User Manual By selecting one of the services from the list placed on the right, a more detailed information about it will be shown. 3.2.- Table Repetition This feature shows a list with all the tables of all the services of the selected channel and the time elapsed (interval) between two consecutive arrivals of the tables for each one, as well as the maximum and minimum values of the measured interval elapsed since it began the measuring time.
-
Page 53: Epg
User Manual 3.3.- EPG This feature shows the electronic program guide of the channel: By placing the mouse over one of the events, a popup window will be shown displaying the information about that event:... - Page 54 User Manual You can also click on the event to see further more information about it:...
-
Page 55: Pcr Jitter -Option 902512 Only For Rcs100 And Rcs400
User Manual 3.4.- PCR Jitter -Option 902512 only for RCS100 and RCS400- This feature shows two graphs that represent the PCR jitter and the PCR interval of a selected MPEG Video. On the left side of the screen, there is a list with all the services of the channel. The user must select a MPEG Video to see the PCR jitter and PCR interval graphs on the right side of the screen. -
Page 56: Tree View
User Manual 3.5.- Tree View This feature shows the channel information in tree view format. Each service corresponds to a node of the tree, where the service ID and the name is displayed besides. By expanding a node, all the packets of the service with the ID of each one and the information about the packet type are shown. -
Page 57: Service Monitoring-Option 902558
User Manual 3.6.- Service Monitoring -Option 902558- This feature allows to detect changes in the selected services and it activates an alarm when this occurs. To do that, the user should create templates for each service he wants to monitor. When you click on the “Monitor”... -
Page 58: Ts Recorder
User Manual 3.8.- TS Recorder Allows to record the transport stream of the selected channel in any of its inputs. The file will be saved in the RCS memory. There are two ways of operation: 1.- Instant recording: When no event recordings are configured, or when they are disabled, The “REC”... - Page 59 User Manual At the bottom there is a list of all recordings stored in the memory. On the right side of the name of the file, it is shown its size, as well as three buttons: the first one allows to delete the file, the second one allows to download the file to the computer, and the third one allows to save the file in a USB memory connected to the RCS.
-
Page 60: Quality Of Service -Option 902538. Only For Rcs100 And Rcs400
User Manual –Option 902538. Only for RCS100 and RCS400- 3.9.- Quality of Service This function shows, graphically, all the measurements relating to the quality of the selected service: Service Availability Error (SAE): The main purpose is to identify severe distortions and interruptions of the service under certain receiving conditions. -
Page 61: T2-Mi Analysis -Option 902513 Only For Rcs100 And Rcs400
User Manual 4.- T2-MI Analysis -Option 902513 only for RCS100 and RCS400- When the T2-MI mode is on, it will appear this window in the web application. To know how to activate this mode, see section 1.2.- Input/Output. The T2-MI Analysis has several sheets, explained bellow: 4.1.- Bitrate This screen is divided in two parts: on the left side, you can see the bitrates corresponding to T2-MI packets, and on the right side, you can see the data corresponding to the transport stream bitrates. - Page 62 User Manual...
-
Page 63: Ts Recorder
User Manual 4.3.- TS Recorder Allows to record the transport stream of the selected channel in any of its inputs. The file will be saved in the RCS memory. There are two ways of operation: 1.- Instant recording: When no event recordings are configured, or when they are disabled, The “REC”... -
Page 64: T2Mi Templates -Only For Rcs100 And Rcs400
User Manual At the bottom there is a list of all recordings stored in the memory. On the right side of the name of the file, it is shown its size, as well as three buttons: the first one allows to delete the file, the second one allows to download the file to the computer, and the third one allows to save the file in a USB memory connected to the RCS. - Page 65 User Manual There are two ways to create the template: either by selecting each of its parameters on the right side of the window, or automatically by clicking on the “Load parameters from source”, placed on the right side of the screen, that loads the template with the values of the parameters from the input signal.
-
Page 66: Rf Analysis
User Manual 5.- RF Analysis This feature allows a comprehensive analysis of the RF input. This feature is not available when the IP input is selected (option 902518). The user can select the channel he wants to analyze by clicking on the drop down list placed at the top left corner of the screen. -
Page 67: Constellation -Option 902511 Only For Rcs100 And Rcs400
User Manual On the right side of the window, measurements are shown in real time. At the bottom a table of alarms detected by the RF system is shown. By clicking on an alarm of the list, a window with detailed information will be open. 5.2.- Constellation -Option 902511 only for RCS100 and RCS400- This feature shows the constellation of the RF signal. -
Page 68: Echoes
User Manual 5.3.- Echoes This feature monitors and displays the echoes of the channel and the levels and delays of each. The pink cursor shows the delay (µs) and the level. The graph displays the main signal and the echoes falling within the guard interval (the grey area). For each echo, the level and the delay relative to the main signal are shown. - Page 69 User Manual As you can see in the image bellow, the mask has green color when the corresponding echo is inside the mask thresholds, and when the echoes values are out of the thresholds, the mask square becomes red and an alarm is generated: The Echoes function of your RCS also allows the user to choose the main echo in the graph, whenever the masks are enabled: Choose the main echo...
-
Page 70: Dvbt2 Templates -Only For Rcs100 And Rcs400
User Manual When the user changes the main echo, the graph will be repainted, keeping the masks as they were created for each echo: At the bottom of the window, you can see a list with all the alarms generated by the system. By clicking on an alarm of the list, a window with detailed information will be open. -
Page 71: Sfn -Option 902511 And 902518 Only For Rcs100 And Rcs400
User Manual There are two ways to create the template: either by selecting each of its parameters on the right side of the window, or automatically by clicking on the “Load parameters from source”, placed on the right side of the window, that loads to the template the values of all the parameters from the input signal. - Page 72 User Manual As you can see in the image above, there are two red lines in the graph that indicate the maximum and minimum values allowed for the SFN. Out of these values, the system generates an alarm. These thresholds are selected by the user (see section 1.5.1.- Alarms Profiles). Bellow the SFN Drift graph, there is another graph that shows the time evolution of the frequency offset.
-
Page 73: Channel Spectrum -Only For Rcs50
User Manual –Only for RCS50- 5.6.- Channel Spectrum This feature allows to have in a single screen the spectrum (20 MHz), the measurements and the parameters of the tuned channel, as well as the RF alarms generated by the system. -
Page 74: Spectrum -Option 902511 Only For Rcs100 And Rcs400
User Manual 6.- Spectrum -Option 902511 only for RCS100 and RCS400- This feature is available only when the input selected is RF. This feature shows the spectrum of the selected signal. In the left side of the screen, you can see the signal spectrum. The reference level is automatically selected according to the signal level. - Page 75 User Manual As you can see in the image above, when the maximum and/or minimum hold functions are active, the maximum and minimum levels of the markers will also be shown. *Channel BW: Allows you to enable/disable the marks corresponding to the bandwidth in the graph.
- Page 76 User Manual Mask list: All the masks saved in the RCS will be displayed in this list. You can delete a mask by clicking on the “Delete mask” of the selected mask. Or you can load a mask to the spectrum graph by clicking on the “Load mask”...
-
Page 77: Polling
User Manual 7.- Polling Using this feature, the RCS is able to monitor sequentially all the channels that the user has selected in the channel plan. Polling feature is available only for RF and IP inputs (IP inputs only for option 902518 for RCS100 and RCS400). - Page 78 User Manual Bellow the graph, you can see a list of the alarms generated. The alarms can be filtered by channel using the dropdown list “Filter by channel”. By clicking on an alarm of the list, a window with detailed information will be open.
-
Page 79: Historical Pollings
User Manual Bellow the graph, you can see a list of the alarms generated. The alarms can be filtered by channel by using the dropdown list “Filter by channel”. By clicking on an alarm of the list, a window with detailed information will be open. - Page 80 User Manual By clicking on the selected button, a .csv file will be generated. You can download the file to you computer by clicking on the “Download file polling.csv” button.
-
Page 81: Configuration
User Manual 7.3.- Configuration Using this feature, the user can configure all the parameters that take part in the polling mode. The window of this feature is different depending on the type of input (IP or RF). If the selected input is RF, the user must set: locking time, stabilizing time and measuring time, as well as selecting the channels that the user wants to monitor. - Page 82 User Manual The maximum locking time is the maximum time during which the RCS will try to lock the signal. The measuring time is the time during which the RCS makes the measurements and generates the alarms in each channel. Once the time has elapsed, the RCS tunes the next channel. In the channel selection table the user can select the channels he wants to include in the monitoring Polling.
-
Page 83: Alarms
User Manual 8.- Alarms In this window the user can see all the alarms generated by the RCS. 8.1.- View In this window the user can see a graph of the generated alarms in a period of time selected by the user. -
Page 84: Historical
User Manual 9.- Historical This feature allows to check all the alarms generated by the RCS in a period of time selected by the user. It also allows to generate a measurements and alarms report in .xlsx format. To select the date range, you must select the initial and final date, and click on the “Search” button. As you can see above, the window shows a graph with all the alarms generated in that time frame. - Page 85 User Manual Once you select the zone, click on the “Search” button again. So you can see the alarms generated in the new time frame. If the number of alarms generated is high, you will see a summary in the table at the bottom of the window.
- Page 86 User Manual By clicking on one of the lines in this table, a pop-up window will show all the alarms of that type indicating the channel where it has occurred: By clicking on “Download data”, a .csv file will be generated with all the information of the table.
-
Page 87: Network Delay -Option 902512 Only For Rcs100 And Rcs400
User Manual 10.- Network Delay -Option 902512 only for RCS100 and RCS400- This function measures the transmission delay from the distribution center of the transport stream to the RCS ASI input. This feature is available only when an ASI or IP input is selected. The equipment must have a synchronization signal 1PPS, 10 MHz (See section Description of the Equipment Components). -
Page 88: Local Features
User Manual Local Features Info By using the keyboard of the RCS, the user can check the information of the equipment, as well as setup the IP and the language. You can also check the status of the RF inputs, and shut down your equipment in an orderly manner. - Page 89 User Manual To shut down your equipment in an orderly manner, select “Exit”: NETWORK System Info 192.168.010.164 Ver. 4.01.00088 Shut down system? 192.168.010.249 S/N 01160216400003 MASK: 255.255.255.000 Date 18-05-17 11:06 INFO EXIT Once you confirm the shut down, the RCS will save all the information before it shuts down definitively.
-
Page 90: Maintenance
User Manual Maintenance Cleaning Always disconnect the unit before cleaning. Use only a mild solution of detergent and water applied with a soft damp cloth. Dry thoroughly before use. Do not use aromatic hydrocarbons or chlorinated solvents. These products may damage the unit. Do not use alcohol or alcohol based products on the front panel, especially the display. - Page 91 User Manual Then you can now connect the power connector and make sure that you equipment works properly.
-
Page 92: Technical Support
Repair Service Do not return the unit without first contacting Gsertel Technical Support. If the unit needs to be returned, Gsertel will arrange for free shipping. The unit will need to be appropritely packed for shipping. In compliance with IATA Regulations, when using our shipping service, follow these instructions: ... -
Page 93: Warranty
User Manual Warranty Gsertel offers a one year guarantee, beginning from the date of purchase for countries in the EEC. For countries that are not part of the EEC, the legal guarantee that is in force at the time of purchase is applied. - Page 94 User Manual...
-
Page 95: Annex 1. Introduction To Snmp
User Manual Annex 1. Introduction to SNMP SNMP means Simple Network Management Protocol. This protocol allows to manage all devices in a network in a standard way. SNMP Versions: SNMPv1: The initial version published by the IETF (Internet Engineering Task Force) in May 1990 as a “full standard”. - Page 96 1.3 identified-organization o 1.3.6 dod (Department of Defense) o 1.3.6.1 internet o 1.3.6.1.4 private o 1.3.6.1.4.1 IANA (Internet Assigned Numbers Authority) enterprise numbers o 1.3.6.1.4.1.23180 Televes Corporation o 1.3.6.1.4.1.23180.2 Company of Televes Group o 1.3.6.1.4.1.23180.2.2 Gsertel o 1.3.6.1.4.1.23180.2.2.1 RCS device...
- Page 97 User Manual o 1.3.6.1.4.1.23180.2.2.1.10 generalConfig o 1.3.6.1.4.1.23180.2.2.1.10.1 serialNumber SNMP Operations GET: Retrieve data from a network node. GETNEXT: Retrieve the next element from a network node. SET: Send configuration or control commands to a network node. ...
- Page 98 User Manual RCS MIB One trap per alarm, organized according to the level or type of alarm (firsPriorityAlarm, secondPriorityAlarm…) Traps could carry information such as Input, frequency, value, etc... Several scalar values showing information such as serial number, model, firmware version, etc..
- Page 99 User Manual A set of tables to configure each level or type of alarms. Index of the table reflects the input of the device (0=RF1, 1=RF2, etc..). It is possible to configure alarm thresholds, in addition to activate or deactivate alarms. ...
- Page 100 User Manual A set of tables reflecting the device alarms for each level (or type) of alarms (firstPriorityAlarmPSTable, secondPriorityAlarmPSTable, etc.) The first index of the table reflects the input of the device (0=RF1, 1=RF2, etc..). The second index of the table reflects the polling channel. ...
-
Page 101: Annex 2. Alarms Definitions
User Manual Annex 2. Alarms Definitions RF Alarms Alarm ID Description 41A1 Power under user-defined threshold 41A2 Power above user-defined threshold 41A3 MER under user-defined error threshold 41A4 CBER above user-defined threshold 41A5 C/N under user-defined threshold 41A6 VBER above user-defined threshold 41A7 ECHO above user-defined threshold 41A8... - Page 102 User Manual ETSI TR 101 290 V1.3.1 Priority 2 Indicator Alarm ID Description Transport_error 21A1 The TEI bit equals 1 in the packet CRC error in the tables CAT, PAT, CRC_error 22A1 PMT, NIT, EIT, BAT, SDT or TOT Interval of time between two PCR_repetition_error 23A1...
- Page 103 User Manual PID not referred to by a PMT or a CAT within 0,5 Unreferenced_PID 34A1 Sections of the current SDT table not present in 35A1 the TS in a period of time longer than the threshold Found tables different to SDT, SDT2, BAT or ST 35A2 in the packets with PID 11 The interval of time between two consecutive...
- Page 104 User Manual T2-MI Alarms Alarm ID Description Two of the various packet types are mandatory for each T2 frame: 1016 (L1-current data), 2016 (DVB-T2 Timestamp). If L1 repetition, in-band signalling (IBS) or Time- Frequency-Slicing (TFS) is indicated in the L1- B221 current data, an L1-future packet (1116) should also be...
Need help?
Do you have a question about the RCS 50 and is the answer not in the manual?
Questions and answers