Table of Contents
Advertisement
Quick Links
Advertisement
Table of Contents

Summary of Contents for Albedo xGenius
- Page 1 User’s Manual xGenius Ethernet & IP Testing Guide...
- Page 3 Copyright The information contained in this document is the property of ALBEDO Telecom S.L. and is supplied without liability for errors and omissions. No part of this document may be reproduced or used except as authorised by contract or other written permission from ALBEDO Telecom S.L. The copyright and all restrictions on reproduction and use apply to all media in which this information may be placed.
- Page 4 User Guide...
-
Page 5: Table Of Contents
Table Of Contents Chapter 1: Introduction ..................... 1 Important Notice ..................... 2 Warranty....................2 Safety ....................3 WEEE Notice ..................3 The Tester ....................... 3 Test Connector Panel ................4 Platform Connector Panel ..............6 The Graphical User Interface................. 6 The Home Panel ................... - Page 6 User Guide Chapter 3: Cable Tests ....................53 Electrical Test....................53 Basic Principles of Ethernet Cable Wiring ...........53 Connecting the Tester .................55 Running the Test .................56 Measuring Optical Power ................60 Measuring PoE / PoE+ Electrical Parameters ..........60 Chapter 4: Traffic Generation..................65 Generation of Ethernet Traffic ..............65 Physical Layer Settings ...............66 Frame Settings ..................66 Configuring the Bandwith Profile ............73...
- Page 7 Framed BER Tests................114 Physical Layer BER Tests..............115 Service Disruption Time ................121 Chapter 6: Multi-Stream Analysis................. 123 Enabling and Disabling Filters ..............123 Configuring Filters ..................125 MAC Selection .................. 126 C-VLAN and S-VLAN Selection ............128 MPLS Selection................. 129 IPv4 Selection ...................
- Page 8 User Guide Configuring the Test Method ..............192 Using the Responder Function..............196 Chapter 8: Ping and Traceroute Tools ..............199 Ping ......................199 Internet Control Message Protocol ............199 Test Configuration ................200 Result verification ................202 Traceroute ....................204 Test Configuration ................204 Result verification ................206 Chapter 9: IEEE 1588 Analysis................209 Ethernet Synchronization with IEEE 1588 ..........209 Precedents: IP Synchronization with NTP .........210 PTP Protocol Details .................210...
- Page 9 Frequency Offset Generation ..............262 Wander Generation ..................263 Operation in IP Through Mode ..............264 ESMC Generation and Analysis ..............265 Chapter 11: Test Management................269 Generating Reports ..................269 File Management ..................271 Saving Configurations ............... 271 Renaming Files ................. 272 Deleting Files ..................
- Page 10 User Guide MPLS ......................295 IPv4.......................295 Generic / /UDP Traffic Generator...............295 Bandwidth Profiles ................296 Test Patterns and Payloads ..............296 Filter ......................296 Ethernet Selection ................297 MPLS Selection .................297 IPv4 Selection..................297 IPv6 Selection..................297 UDP Selection ...................297 PTP / IEEE 1588...................297 PHY Results....................298 Cable Tests ..................298 SFP....................298 Auto-Negotiation ................298 Synchronous Ethernet ...............298...
- Page 11 Appendix B: Common Issues and Solutions ............305...
- Page 12 User Guide...
-
Page 13: Chapter 1: Introduction
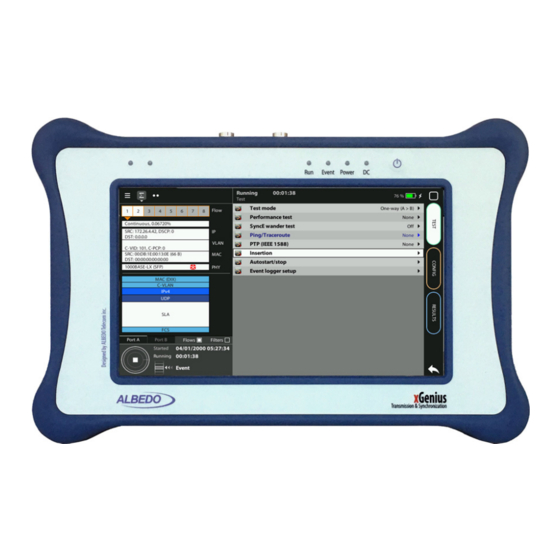
Power Rubber cover Panel Figure 1.1: xGenius front view. The tester presents results by means a colour capacitive touch screen and the LEDs. xGenius operates at bit rates up to 10 Gb/s. It comes with optional synchronization testing capabilities and TDM analysis and generation features. For this reason,... -
Page 14: Important Notice
One USB memory stick with user documentation. • One printed copy of this user manual (if ordered). Check with your distributor the availability of other optional items for your xGenius unit. 1.1.Important Notice Operation, manipulation and disposal warnings for your xGenius unit are listed below. -
Page 15: Safety
1.2.The Tester Interaction with xGenius is based on a high resolution capacitive colour touch screen, and different kinds of status LEDs There are six LEDs (Run, Event, Power, DC, Port A summary, Port B summary). Their description is given below: •... -
Page 16: Test Connector Panel
USB port placed in the platform connector panel (See section 1.2.2). There is a single button in xGenius that is used to switch the unit on and off. If the tester is in off status, push to switch it on. If the tester is on, use this key to switch it off (long push). - Page 17 Introduction • SFP Port A: This port is used to connect the tester to the network through an opti- cal interface with the help of an SFP module. • SFP / SFP+ Port B: This port is used to connect the tester to the network through an optical interface with the help of an SFP module.
-
Page 18: Platform Connector Panel
Ethernet networks and power source. 1.3.The Graphical User Interface The xGenius graphical user interface is based in a 800 x 480 colour touch screen that can be used to browse the different panels, configure the unit and start / stop tests. - Page 19 Direct access to test to results to configuration Figure 1.4: xGenius home panel. • TEST: Contains configuration items related with general test configuration like test scheduling, test setup, performance objectives settings, event insertion, and event logging. Configuration of some special tests like the RFC 2544 or the eSAM or the Ping / Traceroute is also done from this menu.
- Page 20 User Guide • RESULTS: This item enables the user to browse test results. Most of them are not available if a measurement has not been previously started but there are some exceptions to this rule. The Results panel also contains access to the Event logger browser, that enables the user to display graphically miscellaneous events and performance metrics.
-
Page 21: The Menu Structure
Introduction The main panel may also contain shortcuts to predefined tests users are allowed to load depending on what they need to do. The number and type of these shortcuts depend on the license included in the test unit. On the left side of the main panel there is an auxiliary area with three tabs: •... - Page 22 An scroll bar shows the current position in the menu if there is no room to display all items at the same time. Figure 1.6: xGenius selection panel to enable users to choose between different Ethernet encapsulations Configuration and result panels are conceptually different to menus even if both kinds of items could be displayed under the same higher level menu.
-
Page 23: The Summary And Leds Tabs
Introduction Configuration panels are usually selection lists. Sometimes you can select only one simultaneous item in the list and sometimes selection of several items at the same time is possible. Keyboards are available if selection through lists is not possible. There is one keyboard for numeric settings and one for alphanumeric settings. -
Page 24: Recently Used Panel And Menu Tree
User Guide The Summary tab provides some details about the current configuration and results. There is not a fixed structure for this tab, which has its own layout depending on the currently selected operation mode.Typically, this panel has graphical information about traffic flows, protocol stack, filters, signal processing blocks, etc. -
Page 25: Predefined Tests
1.3.5. Predefined Tests Predefined tests are special shortcuts located in the Home panel that enable xGenius users to access to common test scenarios without having to configure the unit step by step. The predefined test shortcuts configure most test parameters and provides quick access to the (usually few) parameters still to be configured. -
Page 26: Upgrading The Unit
2. Press the Power button and keep the button pressed until you see the Power LED to start blinking. 3. Release the Power button. You will hear a beep and the ALBEDO Software Installer will be loaded and exe- cuted. An informative panel will display the xGenius software version number found in the storage device. - Page 27 Introduction 7. Wait for the installation process to finish. Note: The full process may take a few minutes. Note: Do no disconnect the unit or remove the USB memory stick during installa- tion. 8. Press Continue to close the Software Installer and finish the installation process. The unit will be automatically restarted.
- Page 28 User Guide...
-
Page 29: Chapter 2: Connection To The Network
Each RJ-45 / SFP / SFP+ interface constitutes a single logical port. These ports are labelled as Port A and Port B.xGenius includes a third port (Port C) for TDM and clock signal generation and analysis and a PHM slot that can be used to attach custom modules for test applications not included in the xGenius mainframe. - Page 30 IP endpoint port, then Port B will become an IP endpoint port as well. In any other sense, Port A and Port B are allowed to have a different configuration. To configure the xGenius global operation mode follow these steps: 1. From the Home panel, go to CONFIG, The port configuration panel is displayed.
- Page 31 Connection to the Network Table 2.1: Global Ethernet Operation Modes Mode Description Ethernet cable test This is the correct mode to check the UTP / FTP / STP cable transmission parameters like the wire map, skew and MDI / MDIX port status. If there is any cable fault like an open or a short circuit, it is detected and an estimated distance to the fault is displayed.
-
Page 32: Connecting The Tester To The Network
User Guide Table 2.2: Port Modes Mode Description Cable test This is a mode specifically used for cable tests. It is used if the global operation mode is set to Ethernet cable test. The Cable test port mode disables transmission of Ethernet frames or IP packets. -
Page 33: Configuring The Connector
Tester DUT / SUT DUT / SUT Figure 2.1: Basic connection setup for xGenius testers: (a) Ethernet and IP endpoint operation modes. (b) Ethernet / IP through mode. 2.2.1. Configuring the Connector Both Port A and Port B have one Electrical (RJ-45), one SFP port and one SFP+ connector each. -
Page 34: Using The Sfp / Sfp+ Ports
User Guide 2.2.2. Using the SFP / SFP+ Ports The SFP ports are the only choice available for optical tests. They can also be used for electrical tests if compatible SFP / SFP+ are connected but this is usually not necessary due to the attached RJ-45 ports which require no adapters. - Page 35 Connection to the Network Table 2.3: Ethernet SFP Results Result Description Model If there is an SFP connected to the port, this field shows information about the vendor. This information is recorded within a memory in the SFP when it is manufactured. TX optical power In compatible optical SFPs, this field displays the currently transmitted optical power expressed in dBm.
-
Page 36: Configuring Port A And Port B Auto-Negotiation Parameters
Laser on indication Figure 2.2: Laser on indication in the xGenius Summary panel. 2.2.3. Configuring Port A and Port B Auto-negotiation Parameters Many Ethernet ports use auto-negotiation to negotiate speed, duplex operation and other parameters with the peer interface. - Page 37 • Master: The synchronization master role is forced in the interface. This is the right configuration for frequency offset generation or sinusoidal phase modulation generation in xGenius. • Slave: The synchronization slave role is forced in the inter- face. This is the right configuration value for frequency and phase measurements over the interface, including MTIE and TDEV, in the units with the.ability to measure these...
- Page 38 User Guide sub-optimal circumstances. For e example use it to operate at 10 or 100 Mb/s in a link supporting 1000 Mb/s. The general procedure to configure the auto-negotiation in your test unit is as follows: Table 2.5: Ethernet Auto-negotiation Results Result Description Local...
-
Page 39: Entering The Port Local Settings
Once the tester has been connected to the network and the right connector type as been configured, follow these steps to check auto-negotiation results: Figure 2.3: Albedo xGenius auto-negotiation results panel. 1. From the Home panel, go to RESULTS, The test port results panel is displayed. - Page 40 User Guide To do that, users should assign an IP profile to each test port. Port A and Port B need an IP address, network mask, gateway address and DNS address to operate. Table 2.6: Local Ethernet / IP Profile Result Description Ethernet address...
- Page 41 Connection to the Network Table 2.6: Local Ethernet / IP Profile Result Description Static IPv4 network Subnet mask used to identify the network address bits and mask host address bits in the Static IPv4 address. The use of the subnet mask is defined in RFC 1219. The subnet mask is entered in decimal, four-dotted format and it must belong to the same network (same network bits) than the current port.
-
Page 42: Using Pluggable Hardware Modules (Phms)
Note: For Port B, you only need to enter a valid IPv4 address and network mask. 2.4.Using Pluggable Hardware Modules (PHMs) Pluggable Hardware Modules (PHMs) are a way to extend the default xGenius functionalities. There are currently four different PHMs. The PHM-20 can be used for datacom testing, PHM-21 is a dual-port IEEE C.37.94 module, the PHM-22 can be... - Page 43 Connection to the Network some kind of analysis over this traffic requiring correlation between received and transmitted frames. Examples of this are BER and latency analysis. Table 2.7: Local Ethernet / IP Profile Result Description Loop mode The loop mode determines which fields within the Ethernet frame or the IP datagram are swapped before forwarding.
-
Page 44: Testing With An External Clock Reference
2.6.Testing with an External Clock Reference Some tests performed by xGenius require a clock reference. Moreover, it is possible that the user is interested in setting the transmission timing source of Port A / Port B transmitters to something different to the default configuration. Clock reference configuration for tests that require an external timing source is carried out through the Reference clock menu. - Page 45 Enables the user to choose between different clock reference outputs.These outputs could be used to synchronize an external equipment, including a second xGenius, with the test unit. The available outputs depend on your hardware configuration and the current operation mode.
- Page 46 User Guide Table 2.8: Reference Clock Panel Result Description GNSS receiver Enables access to the GNSS configuration menu and shows information about the GNSS receiver status, if this option is available. These are • No data: There is no connection between the test unit and the GPS / Glonass receiver or the receiver is not generat- ing any data.
- Page 47 Connection to the Network Table 2.8: Reference Clock Panel Result Description PPS / ToD output Menu that configures and reports status of 1 PPS, 1 PP2S interfaces and ToD clock reference outputs. Configuration of these interfaces is limited to a custom outgoing cable delay com- pensation and the ToD format (ITU-T G.8271, NMEA) to be configured at the output.
- Page 48 Table 2.9: Oscillator Settings and Status Result Description Oscillator status For a proper operation of your xGenius test unit, the oscillator status should always be Calibrated. Not calibrated oscillators may not be able to track correctly an external reference and they could generate large fre- quency offsets when they operate in free running mode.
- Page 49 Connection to the Network Table 2.9: Oscillator Settings and Status Result Description • Locking: The oscillator has finished the initialization sequence and it starts tracking the external reference fre- quency and phase. The objective of this state is to mini- mize the phase and frequency difference between the local oscillator and the reference.
-
Page 50: Using Pps / Tod And Frequency References
The default holdo- ver duration period is 24 hours. The procedure to configure the clock reference input in your xGenius unit is detailed in the following steps. 1. From the Home panel, go to CONFIG, The port setup panel is displayed. - Page 51 Connection to the Network require an adjustment to compensate for the latency in the patch cable from / to the DUT. The same setting applies both to phase and time references. On the other hand, frequency references require an impedance configuration. Setting a high impedance value enables monitoring applications without disturbing the line and the nominal impedance can be used to avoid reflections when the test unit is connected in endpoint mode.
- Page 52 User Guide • Time references. Includes the ToD reference. The ToD is made up of a 1 PPS that provides accurate phase timing and a protocol that distributes the time in an abso- lute time scale such as TAI or UTC. The ToD can be used to measure TE in any interface including, PTP, 1 PPS and frequency.
-
Page 53: Configuring The Built In Gnss Receiver
20 dB is expected for these points. 2.6.2. Configuring the Built in GNSS Receiver xGenius units may optionally be equipped with a built in GNSS receiver. These units have a SMA female connector suitable for connecting an external antenna. Units with the built in GNSS receiver are also supplied with a compact antenna with 5 m of coaxial cable plus a 10 m extension cable.Using a different antenna is possible as long as the... - Page 54 User Guide 5. Check the values of GPS status, Satellites received, Satellites used, PDOP and TDOP. Table 2.13: GNSS Receiver Options Parameter Description Antenna cable delay Compensates the delay added by the physical media when the GNSS signal propagates from the antenna to the receiver.
- Page 55 Connection to the Network Table 2.13: GNSS Receiver Options Parameter Description GNSS status Displays the current status of the NMEA interface used for communication with the built in GPS / Glonass module or an external GPS receiver connected to the unit through a 1 PPS / ToD interface.
- Page 56 GNSS constellations without user intervention. This is, therefore a read only field. You can also actively configure the xGenius GNSS receiver. Some settings are not mandatory but the increase in accuracy it could be obtained in this way is quite important.
-
Page 57: Using The Holdover Mode
In Rubidium units, it is possible to recover from a holdover without restarting the oscillator control loop from the beginning. This is the right procedure to do that: 1. Plug a GNSS or 1 PPS clock reference to the right connector in your xGenius tester. - Page 58 not.
- Page 59 For the example of the Rubidium xGenius, the holdover accuracy of 1000 ns in 24 hours applies only to operation with temperature changes within ±2 ºC. If the...
-
Page 60: Using The Clock Reference Output
1. A test is to be done in a room where access to GNSS is not possible and there is no other signal that could be used as an alternative reference input. xGenius is synchronized in a different room at a different temperature and then moved to the test location. - Page 61 Connection to the Network • 1 PP2S (Port Ref. In/Out): The clock reference constituted by a 1 PP2S signal (1 pulse every two seconds) transmitted through the RJ-48 REF IN/OUT port. For this reason, this option is available only if a clock reference input has not been previ- ously configured over the same port.
- Page 62 User Guide Table 2.14: Clock/PCM output interfaces Options Parameter Description Frame structure Sets the frame structure for E1 and T1 clock reference outputs. The available options are: • PCM31: 2048 kb/s TDM frame made up of 32 time slots (TS0, TS1,..., TS31) of 64 kb/s each. TS0 carries the FAS and NFAS words.
- Page 63 Connection to the Network Table 2.14: Clock/PCM output interfaces Options Parameter Description SSM signaling Enables or disables the Synchronization Status Message (SSM) clock reference output. The SSM transports informa- tion about the current synchronization performance level transported in the E1 or T1 signal. The SSM information can be used by network clocks or other devices to know if the E1 or T1 signal is a reliable synchronization source.
- Page 64 User Guide Table 2.15: PPS/ToD output Interfaces Options Parameter Description Output Reference Adds a delay compensation to 1 PPS / 1PP2S / ToD clock delay reference output. This setting could be useful to configure the correct phase alignment at the output when the input is not able to compensate a phase offset.
-
Page 65: Chapter 3: Cable Tests
Chapter 3 Cable Tests xGenius has the ability to check wiring and performance of Ethernet cables or optical fibres to make sure they will operate as expected when connected to the network. Cable testing can be used to estimate the cable length, recognise cabling types or detect wiring faults. - Page 66 User Guide All the different test results are provided for each Media Dependent Interface (MDI). An MDI corresponds with a single Ethernet pair transceiver. There are four of them in 1000BASE-T (MDI-0, MDI-1, MDI-2 and MDI-3) and two in 100BASE-TX / 10BASE-T (MDI-0 and MDI-1).
-
Page 67: Connecting The Tester
Cable Tests is connected with a remote MDIX port through an straight cable and that an MDI (or MDIX) port is connected to a second MDI (or MDIX) port through a crossover cable. The advantage of this procedure is that there is no need to think about which cable (crossover or straight) is required for interconnection of network equipment and stations. -
Page 68: Running The Test
DUT / SUT xGenius Tester Figure 3.2: Basic connection setup for xGenius tester: (a) Port A - Port B closed loop, (b) Port A connection with remote link, (c) Port A connection without link. 3.1.3. Running the Test Once the tester has been connected to the network in any of the supported test configurations. - Page 69 Cable Tests 3. Choose Ethernet cable test. 4. From the Home panel, go to Results, The port setup panel is displayed. 5. Select Port A to enter in the test Port A specific results panel. Table 3.3: Common cable wiring problems Description Diagram Diagnostic...
- Page 70 User Guide Table 3.3: Common cable wiring problems Description Diagram Diagnostic Swapped pair, con- No fault is detected in any nections are OK but pair (Fault displays OK for wires of the same all MDIs) but if the cable is connection are long enough it will result in twisted in different...
- Page 71 The maximum range of the distance test is 100 m. To measure the cable length, just leave the far end disconnected and run the test. xGenius will detect an open circuit in all MDIs and the Distance (m.) results displays the cable length.
-
Page 72: Measuring Optical Power
User Guide Table 3.4: Cable test results Result Description Wiring A cable could be designed to cross at the remote end the pairs used for transmitting and receiving (crossover cable) or not (straight cable). The wiring result checks whether a cable is straight or crossover. - Page 73 Cable Tests connected between a switch or a router without PoE / PoE+ and the PD. These Midspans inject the current required to feed the PD. 48 V 48 V Figure 3.3: PoE / PoE+ powering alternatives: (a) Alternative A, power is injected between wires 1/2 and 3/6.
- Page 74 User Guide the PSE stabilizes the voltage to around 48 V DC and the normal powering operation starts. Table 3.5: Cable test results Result Description Status Displays the current PoE / PoE+ measurement status. The Status could be any of the following items: •...
- Page 75 Test unit Figure 3.4: Connection of xGenius to measure PoE / PoE+: (1) The test unit replaces the PD. The unit measures only voltage, (2) The test unit is connected between the PD and the PSE, In this case it measures voltage, current and power.
- Page 76 User Guide...
-
Page 77: Chapter 4 Traffic Generation
Ethernet / IP test ports (Port A and Port B). Each traffic flow may be configured with specific encapsulation and addressing parameters thus providing great versatility in all applications requiring Ethernet and IP traffic generation. -
Page 78: Physical Layer Settings
User Guide 4.1.1. Physical Layer Settings Before starting any frame generation test, the equipment must be connected to the network and the electrical and optical physical layer must be correctly configured. Ethernet technology has been designed to keep physical layer configuration to the minimum. - Page 79 Traffic Generation Table 4.1: Ethernet Frame Settings Setting Description Encapsulation • Local Profile: Sets the encapsulation (and eventually the C-VID and C-VLAN priority) to the same value configured in the local profile (See section 2.3). This is the default configuration. It is useful when the user wants to control the encapsulation in various streams through a single set- ting.
- Page 80 User Guide Table 4.1: Ethernet Frame Settings Setting Description Des. MAC address Establishes the origin of the destination MAC address for the from current stream. There are three different settings available for configuration: • ARP: Uses the Address Resolution Protocol (IETF RFC 826) to configure the destination MAC address with- out user intervention.
- Page 81 Traffic Generation Table 4.1: Ethernet Frame Settings Setting Description Address range size Configures the number of MAC addresses within an address range. This control is valid only if Des. MAC address type is set to Range. In this case, the Ethernet frames transmitted in the current stream will contain as many destination addresses as previously configured in this field.
- Page 82 User Guide Table 4.1: Ethernet Frame Settings Setting Description S-VLAN TPID Ethertype to be associated to the S-VLAN tag in Q-in-Q frames. Four different values are possible: 0x8100, 0x9100, 0x9200 and 0x9300. It the encapsulation is set to IEEE 802.1ad, the S-VLAN Eth- ertype is automatically set to 0x88a8 and this field is not available for configuration.
- Page 83 Preamble Preamble Type Type / Length Data DIX Frame IEEE 802.3 Frame Figure 4.1: MAC frame structure: IEEE 802.3 and DIX The following steps illustrate the frame configuration procedure in xGenius. Both the port-wide and flow-specific configuration is included.
- Page 84 User Guide 1. Make sure that your tester is connected to the network. The physical layer must be up and working (See section 4.1.1). 2. From the Home panel, go to CONFIG, The test port settings panel is displayed. 3. Select either Port A or Port B to enter in the port specific configuration. 4.
-
Page 85: Configuring The Bandwith Profile
Traffic Generation 5. Configure the correct MTU with the help of the MTU menu. You may want to set the MTU to 1518 bytes for traffic analysis in line with IEEE 802.3 or to other value to allow jumbo frames. The maximum allowed MTU is 10,000 bytes. 6. - Page 86 6. Configure the transmission mode to one of the available profiles with the help of the Mode control. Figure 4.3: Albedo xGenius bandwidth profile configuration panel. 7. Configure the transmission rate parameters with Transmission Rate. Note: Depending on the current transmission mode you will be requested to enter different traffic parameters in the Transmission Rate panel.
- Page 87 Time (s) Step duration Rate (final) Rate (final) Time (s) Rate (average) Time (s) Figure 4.4: Bandwidth profiles for Albedo xGenius: (a) Continuous traffic generation, (b) Periodic burst generation, (c) Ramp generation, (d) Random traffic generation with Poisson probability distribution.
- Page 88 User Guide Test traffic generation does not start immediately after setting the bandwidth profile parameters. Traffic generation requires a test to be started with by pressing run. Table 4.2: Ethernet Payload Settings Setting Description Mode Configures the traffic shape to be used by the traffic genera- tor in the current stream.
-
Page 89: Choosing The Test Payload For Ethernet
Mb/s or percentage. 4.1.4. Choosing the Test Payload for Ethernet The traffic generated by xGenius is synthetic. It does not contain any real user data. In fact, the user payload of the internally generated frames is replaced by a test payload. - Page 90 ALBEDO Telecom Ethernet SLA Frame Figure 4.5: Albedo payload for SLA tests (Ethernet Endpoint mode). Note: The default value for the SLA Ethertype in Ethernet endpoint mode is 0x8902 (IEEE 802.1ag / ITU-T Y.1731 OAM). There is no way to set a custom Eth- ertype in IP endpoint mode, which is statically set to 0x0800 (IPv4 protocol).
- Page 91 SLA payload constitutes a proprietary extension of the Operation, Administration and Maintenance (OAM) proto- col for Ethernet defined in ITU-T Y.1531. The SLA payload in IP Endpoint mode is a proprietary ALBEDO Telecom for- mat. • All zeroes: Sets the transmitted pattern to all zeroes.
-
Page 92: Generation Of Ipv4 Traffic
IPv6 addressing space but IPv4 and IPv6 can be regarded as different and incompatible network protocols in any other sense. Currently, xGenius traffic generation functionality is compatible with version four of the IP protocol (IPv4). Traffic analysis include both versions of the IP protocol, IPv4 and IPv6. -
Page 93: Configuring The Physical And Mac Layers
Traffic Generation bytes V IHL DS Field Offset bits Prot DSCP DSCP: Differenciated Service CodePoints CU: Currently Unused Data IPv4 Datagram Figure 4.6: IPv4 datagram structure. • The test equipment is now ready to use some helper protocols to make the config- uration process easier. -
Page 94: Configuring Mpls
User Guide 4.2.2. Configuring MPLS Multi-Protocol Label Switching (MPLS) is a technology designed to speed up IP packet switching in routers by separating the functions of route selection and packet forwarding into two planes: • Control Plane: This plane manages route learning and selection with the help of traditional routing protocols such as Open Shortest Path First (OSPF) or Interme- diate System - Intermediate System (IS-IS). - Page 95 Traffic Generation deploy advanced traffic engineering tools that provide the operator with tight control over the path that follows every packet within the network. Both QoS provision and advanced traffic engineering are difficult, if not impossible to solve in traditional IP networks.
- Page 96 User Guide 5. Select one of the traffic flows between Flow #1 and Flow #8 to enter in the flow specific configuration. Table 4.4: MPLS Settings Setting Description Stack configuration Configures the size of the MPLS label stack for the current flow.
-
Page 97: Configuring The Port Local Network Profile
Traffic Generation Table 4.4: MPLS Settings Setting Description Top traffic class This field contains the traffic class identifier for the top MPLS header. It was first thought that this field could carry the 3 Type-of-Service (ToS) bits defined for Class of Service (CoS) definition in the IP version 4, but currently, the ToS field is being replaced by 6-bit Differentiated Services Code Points (DSCP). -
Page 98: Configuring The Ipv4 Datagram
User Guide 4.4.4. Configuring the IPv4 Datagram The IPv4 packet content is set much in the same way that the MAC frame content. However, in this case, MAC addresses are replaced by IPv4 addresses. Of course, IPv4 datagrams have their own structure and they contain some fields not present in Ethernet frames. - Page 99 Traffic Generation Table 4.5: IPv4 Packet Settings Setting Description Destination IPv4 Establishes the origin of the destination IPv4 address for the address from current stream. There are three different settings available for configuration: • Manual: The destination address is set to the value config- ured in Destination IPv4 address.
- Page 100 User Guide Table 4.5: IPv4 Packet Settings Setting Description Address range size Configures the number of IPv4 addresses within an address range. This control is valid only if Destination type is set to Range. In this case, the IP datagrams transmitted in the current stream will contain as many destination addresses as previously configured in this field.
- Page 101 Traffic Generation Table 4.5: IPv4 Packet Settings Setting Description Enables or disables transmission of the User Datagram Pro- tocol (UDP) in the current stream. The UDP is defined in RFC 768 and it is a lightweight trans- port protocol for unreliable data transmission. RFC 768 defines an eight-byte fixed length header for UDP that is gen- erated when UDP generation is enabled in the stream.
-
Page 102: Setting The Bandwidth Profile
However, there is a difference concerning the SLA payload. While in Ethernet Endpoint the SLA payload is defined as an extension of the ITU-T Y.1731 structure, in IP Endpoint, this payload is ALBEDO Telecom proprietary. In practical terms, the structure of the SLA payload should not make any difference when testing. - Page 103 Test Pattern (PRBS 2 ALBEDO Telecom IP SLA Frame Figure 4.7: Albedo payload for SLA tests (IP Endpoint mode). 2. Select Insertion The event insertion menu is displayed. 3. Select the event to be inserted with the help of the Event to be inserted menu item.
- Page 104 User Guide Table 4.6: Event Insertion Settings Setting Description Event to be inserted Contains a selection list with events the user can choose for insertion in the transmitted data stream.The events available are: • None: Disables event insertion in the target port and flow. No event will be generated in case the user presses event.
- Page 105 Traffic Generation Table 4.6: Event Insertion Settings Setting Description Mode Configures the way events are inserted in the outgoing sig- nal. Depending on whether the insertion event is an anomaly or a defect there are different insertion modes. For anoma- lies, the insertion modes are: •...
- Page 106 User Guide...
-
Page 107: Chapter 5 Basic Frame Analysis
Chapter 5 Basic Frame Analysis ALBEDO xGenius can be used to get advanced traffic counts and statistics about Ethernet and IP networks operating at rates up to 10 Gb/s. These statistics include frame and error counts, bandwidth statistics, quality of service statistics, frame size statistics and other results. -
Page 108: Global Counts And Statistics
User Guide other measurements because they require a BERT payload / pattern received in the test interface. These test may be generated by the same test unit or a remote tester. 5.1.Global Counts and Statistics Global frame counts and statistics are those not associated to any particular stream. Some global statistics have a per-stream statistic counterpart. - Page 109 Basic Frame Analysis Table 5.1: Global Frame Statistics Metric Description Multicast frames Received Ethernet multicast frames from the beginning of the test. Ethernet multicast frames have their multicast bit in their des- tination MAC address set to ‘1’. The multicast bit of a MAC address is the least significant bit of the more significant address byte.
-
Page 110: Error Counts
User Guide 5.1.2. Error Counts xGenius is prepared to get any defect or fault in the received data stream. These faults include invalid checksum, alignment or size and frame structure defects. If configured in pass-through mode, the test unit, automatically drops frames with errors but these are still counted and presented in the error statistics panels. -
Page 111: Network Counts
Basic Frame Analysis Table 5.2: Global Error Counts Metric Description UDP errors Displays information about the total number of errored UDP packets. UDP packets are considered to contain errors if either their structure or their content is invalid. For UDP, this means that the packet has an unexpected length or it contains checksum errors. - Page 112 User Guide Table 5.3: Global Network Statistics Metric Description IPv6 RX Total number of received IPv6 packets since the beginning of the test with RUN. IPv6 packets are encapsulated in Ethernet frames carrying the 0x86dd Type. Unicast pkts. Aggregated count of unicast IPv4 and IPv6 packets received from the beginning of the test.
-
Page 113: Bandwidth Statistics
Basic Frame Analysis Table 5.3: Global Network Statistics Metric Description ICMP / ICMPv6 Aggregated count of ICMP and ICMPv6 messages received from the beginning of the test. ICMP packets carry Internet Control Message Protocol (ICMP) messages defined in RFC 792. ICMPv6 messages carry the version 6 of Internet Control Message Protocol defined in RFC 4443. - Page 114 User Guide 5. Check the Eth. (current), Eth. (min.), Eth (max.), Eth. unicast, Eth. multicast, Eth. broadcast, IPv4 (current), UDP (current) results. Table 5.4: Bandwidth Statistics Metric Description Eth. (current) Total amount of Ethernet traffic received during the last sec- ond computed in bits per second, frames per second and as a percentage of the total channel capacity.
-
Page 115: Frame Size Distribution
VoIP use short frames while most data applications based on a client / server architecture use short frame lengths for the client requests and long frames for the server replies. The ALBEDO Telecom xGenius provides frame size results as described in standard RFC 2819. The procedure for displaying the received frame size distribution is as follows: 1. -
Page 116: Using The Network Search Capability
User Guide broadcast packets when this happens. MPLS test results are limited to an indication of the presence of MPLS in the received traffic and some statistics about the MPLS stack size. To display the MPLS statistics follow these steps: 1. -
Page 117: The Leds Panel
6). 5.3.The LEDs Panel The LEDs panel offers a quick view of the current xGenius connection and operation status. They are permanent indicators. That means that no test has to be started to get the information from the LEDs. - Page 118 The History check box sets or unsets the history mode. If the history mode is enabled, then the Reset button resets the LEDs history. Figure 5.2: Albedo xGenius LEDs panel. Orange is used to signal anomalies and red indicates defects but there are more possible LED status: •...
- Page 119 Basic Frame Analysis also indicate that the LED has been disabled due to the presence of a more impor- tant event. Table 5.6: LED Indications Metric Description External clock input status LED. Displays green colour if a valid reference signal is found in the corresponding clock input port.
- Page 120 User Guide Table 5.6: LED Indications Metric Description At least one frame with FCS errors has been found during the current second. A frame with a FCS error is a frame with a legal size which contains an invalid FCS field. FCS errors are caused by transmission errors.
-
Page 121: The Event Logger
Global counts, statistics and LEDs provide information about which events and how many of them have been registered but they do not say too much about how they are distributed in time. These information is supplied by the xGenius graphical representation tool or event logger. -
Page 122: Configuring The Event Logger
User Guide With the Help of the event logger function, you can select one or various events and trace them so that all changes along with the time and date these changes are registered are recorded with a 1 second resolution. The event logger provides different representations and different zoom levels to enable event analysis at different time scales. -
Page 123: Displaying Logs
Basic Frame Analysis Table 5.7: Logging event categories Event class Description Synchronization This event category includes all events related with Synchro- nous Ethernet. Both message statistics, and time / frequency metrics are available. The traceable event list is: REF, OVF, TIE, Frequency offset, Frequency drift. - Page 124 5 mins/div, 20 mins/div, 1 hours/div, 5 hours/div, 20 hours/div, 2 days/div. Figure 5.3: The xGenius event logger traces all events previously selected from the event 6. Select an event in the list to and an instant in the time bar to display the magnitude of the event at the chosen time.
-
Page 125: Exporting Logs
A typical application is to use these graphics to generate high resolution plots from the data measured by xGenius. To export a file you can use the regular file exporting procedure for log files (See section 11.2.4). You can also export log files with the help of a web browser (See section 11.2.8). -
Page 126: Framed Ber Tests
The tester considers that a frame contains bit errors when the test pattern carried by the frame does not match the expected pattern but the checksum fields are still correct. For this reason, xGenius Test Sequence Error (TSE) events are closer to... -
Page 127: Physical Layer Ber Tests
TSE event. xGenius testers include one two test pattern generators and two pattern analysers, one for Port A and one for Port B. Pattern generator is bound with Flow 1 while traffic analysers are attached to Filter 1. - Page 128 User Guide analyser (as opposed to a frame sequence). The result is a more accurate description of the transmission performance in terms of bit errors. On the other hand, L1 test patterns do not contain source and destination addresses or CoS labels to force the stream to follow an specific path in the network.
- Page 129 Basic Frame Analysis In xGenius, L1-PCS-synchronized patterns are supported only by the optical interfaces. L2-compliant patterns are available from all physical interface configurations. Table 5.9: Test Patterns for Unframed Operation Setting Description RPAT Random Data Pattern. This is a L1-PCS-synchronized test pattern defined in the NCITS TR-25-1999.
- Page 130 User Guide Table 5.9: Test Patterns for Unframed Operation Setting Description LFPAT Low Frequency test pattern. This is a L1-PCS-synchronized test pattern defined in Annex 36A of the IEEE 802.3 stand- ard. The purpose of this pattern is to test low-frequency ran- dom jitter and also to test PLL tracking error.
- Page 131 Basic Frame Analysis Table 5.9: Test Patterns for Unframed Operation Setting Description A / B-Seed This code is a L1-PCS-synchronized test pattern generated by loading predefined seeds An, Bn, Ai, Bi in an scrambler with polynomial G(X) = 1 + X and predefined sequences at the scrambler input.
- Page 132 (IEEE 802.3 Annex 36A) LCRPAT (IEEE 802.3 Annex 36A) Figure 5.6: L2 compliant patterns supported by the ALBEDO Telecom family of Ethernet Generators / Analysers. 5. Go to L1 BERT pattern and select one or RPAT, JPAT, SPAT, HFPAT, LFPAT,...
-
Page 133: Service Disruption Time
B-Seed patterns for 10 Gb/s LAN interfaces. 5.6.Service Disruption Time The Service Disruption Time (SDT) test enables xGenius to find short Ethernet service interruptions.Some service disruptions are caused by problems that can be accounted for in time scales of seconds but some others, like the ones related with protection switching happen in time scales of milliseconds. - Page 134 User Guide The SDT testing methodology requires the test unit to receive a constant bit rate of test frames. A warning message is displayed if the message rate is not large enough to achieve an accuracy level of 1 ms.The SDT is compatible both with Ethernet endpoint and IP Endpoint operation modes.
-
Page 135: Chapter 6 Multi-Stream Analysis
6.1.Enabling and Disabling Filters Traffic selection or filtering is configured by first enabling one or several filtering blocks and after that setting the filtering criteria. xGenius supports Ethernet, VLAN, IPv4 and TCP / UDP filters. The test unit is equipped with 8 filters per port (up to 16 filters in total). Each filter has... - Page 136 User Guide by any lower priority filters. In other words, traffic is processed by at most one matching filter, the one with the highest precedence. Figure 6.1: Filter summary panel. Filter status can be checked from this panel. A filter admits three different configurations: •...
-
Page 137: Configuring Filters
Multi-Stream Analysis port A (loop) mode is available for Port A only, while the Match port B (loop) is available for Port B only. Current filtering configuration is always available from the summary screen. In this screen use the Port A and Port B contextual buttons to choose between Port A or Port B filters and the Filters check box to display filtering configuration. -
Page 138: Mac Selection
Ethernet interfaces thus making Ethernet the most scalable transmission technology currently available. xGenius provides frame selection based on the MAC address source and destination and Ethertype value. It is possible to configure a matching mask for all three fields to select a value set rather than a single value. - Page 139 Multi-Stream Analysis Table 6.1: MAC Selection Field Description Destination MAC Enables selection by destination MAC address in the current address match filter. The value configured here is used to determine which frames are allowed to pass through the filter and which ones are blocked.
-
Page 140: C-Vlan And S-Vlan Selection
User Guide 6.2.2. C-VLAN and S-VLAN Selection Within enterprise networks, VLANs are important because they enable network segmentation on an organisational basis, by functions, project teams or applications, rather than on a physical or a geographical basis. The network can be reconfigured through software, instead of physically unplugging and moving devices or wires. -
Page 141: Mpls Selection
Multi-Stream Analysis Table 6.2: C-VLAN and S-VLAN Selection Field Description Priority codepoint Enables selection by IEEE 802.1Q/p priority bits in the cur- match rent filter. The value configured here is used to determine which frames are allowed to pass through the filter and which ones are blocked. - Page 142 User Guide The filtering capabilities of the test unit can be used to match MPLS header field of IP packets carrying up to two different labels. Table 6.3: MPLS Selection Field Description Bottom label match Enables selection based on the bottom MPLS label in the current filter.
-
Page 143: Ipv4 Selection
Multi-Stream Analysis Table 6.3: MPLS Selection Field Description Top label match Enables selection based on the top MPLS label in the current filter. Top label matching makes sense only if the received packets carry two MPLS labels. In this case the top label is the one placed closer to the layer two header. - Page 144 User Guide destination IP address, protocol and DSCP. Source and destination IP addresses can be matched by means selection masks. Table 6.4: IPv4 Selection Field Description Source IPv4 address Enables selection by source IPv4 address in the current filter. match The value configured here is used to determine which frames are allowed to pass through the filter and which ones are blocked.
- Page 145 Multi-Stream Analysis Table 6.4: IPv4 Selection Field Description Destination IPv4 This is the mask for the source IPv4 address filter selection address mask criteria. Before comparing the Source address field with the frame addresses, bit wise AND operations are carried out between the value configured here and the Source address field so that only the values surviving the AND are taken into account for matching the filter.
-
Page 146: Ipv6 Selection
User Guide Table 6.4: IPv4 Selection Field Description DSCP This setting contains a 6-bit word in decimal format that con- stitutes the DSCP to be matched in the incoming traffic. 6.2.5. IPv6 Selection Version 6 of the IP protocol is increasingly important in current network deployments. For this reason, the test unit supports filtering based on various IPv6 packet fields including addresses, CoS marks, flow labels and higher layer protocol identifiers. - Page 147 Multi-Stream Analysis Table 6.5: IPv6 Selection Field Description Destination IPv6 Enables selection by destination IPv6 address in the current address match filter. The value configured here is used to determine which frames are allowed to pass through the filter and which ones are blocked.
-
Page 148: Udp Selection
User Guide Table 6.5: IPv6 Selection Field Description Next Header number This object contains an 8-bit word that constitutes the next header identifier to be matched in the incoming traffic. For example, configuring this object to 17 matches UDP traffic, TCP uses 6 as the protocol number and ICMPv6 uses num- ber 58. -
Page 149: Fixed Offset Selection
Multi-Stream Analysis weight User Datagram Protocol (UDP). Like TCP, UDP provides communications through ports to applications but it doesn’t have any error recovery capability. Table 6.6: UDP Selection Field Description Source port match Enables selection by source UCP port in the current filter. The value configured here is used to determine which frames are allowed to pass through the filter and which ones are blocked. - Page 150 User Guide required. This selection mode defines an offset and a mask. Frames matching the specified mask in the configured offset are selected. Table 6.7: Generic Selection Field Description Filter match Enables fixed offset selection in the current filter. The value configured here is used to determine which frames are allowed to pass through the filter and which ones are blocked.
-
Page 151: Per-Stream Counts And Statistics
SLA metrics. To get general statistics about filtered frames follow this procedure: 1. -
Page 152: Bandwidth Statistics
Traffic may come from anywhere in the network. • SLA: At least one frame carrying the ALBEDO Telecom SLA payload and matching the filter rules has been found during the last second. The SLA payload is ALBEDO pro- prietary and therefore it has probably been transmitted by an ALBEDO Telecom equipment. -
Page 153: Sla Statistics
Multi-Stream Analysis 6.3.2. SLA Statistics SLA statistics are more similar to BER results than bandwidth statistics or error counts: Like it happens with BER results, SLA statistics require an special frame / packet payload. In this case, the payload to be used is the SLA payload (See section 4.1.4, See section 4.4.6). - Page 154 User Guide and analysis requires a loop-back device somewhere in the network to redirect the traffic towards the origin (See section 2.2.3). It is also possible to generate traffic with one tester and use a remote equipment to analyse this traffic but delay statistics will be probably wrong or at least will have a poor accuracy due to the lack of a common timing source for the generator and the analyser.
- Page 155 Multi-Stream Analysis Current, Maximum, Minimum Average, Standard dev.iation and Range values of the FTD and the Current, Average and Maximum values of the FDV. Table 6.10: SLA Delay Statistics Field Description FTD (current) Current value of the point-to-point Ethernet Frame Delay computed as specified in ITU-T Y.1563 and expressed in ms.
- Page 156 User Guide Table 6.10: SLA Delay Statistics Field Description FDV (maximum) Smoothed jitter maximum computed from the beginning of the test. The FDV (max) is a packet-by-packet statistic that does not involve any sampling process. FDV (average) Average of all individual delay variation values computed from the beginning of the test.
-
Page 157: Chapter 7: Automatic Performance Tests
Thresholds for the pass / fail results can be tuned through specific menus. ALBEDO xGenius currently supports three different automatic measurements: The IETF RFC 2544 test, the Ethernet service activation test methodology (eSAM) based on the ITU-T Y.1564 standard and the IETF RFC 6349 TCP throughput test. -
Page 158: Performance Assessment With The Rfc 2544 Test
User Guide 7.1.Performance Assessment with the RFC 2544 Test The RFC 2544 is an IETF standard that describes benchmarking tests for network devices. Vendors can use these tests to measure and outline the performance characteristics of their Ethernet and IP switching equipment. As these tests follow standard procedures, they also make it easier for customers to make sense of the glitzy marketing-speak employed by most vendors. -
Page 159: Throughput
Automatic Performance Tests mode). Note: A unit configured in Remotely managed mode has to be installed and con- figured in the remote end before any asymmetric test can be run (See section 7.4). 16. From the Home panel, go to CONFIG, The port setup panel is displayed. - Page 160 User Guide 1. Send a certain number of frames at a specific rate through the DUT / SUT and count the frames transmitted by the DUT / SUT. 2. If the count of transmitted frames is equal to the count of received frames, increase the transmission rate and re-run the test.
-
Page 161: Latency
Automatic Performance Tests Table 7.1: RFC 2544 Throughput Test Settings Setting Description Trial duration (s.) This value corresponds with the duration of a single through- put trial test expressed in seconds. Each algorithm test cycle contains one trial. The equipment transmits test traffic during the time specified by this setting before deciding by means the analysis of the number of lost frames whether to continue or not. -
Page 162: Frame Loss
User Guide timestamp B. The latency is the difference between timestamp B and timestamp A, according to the definition found in RFC 1242. Table 7.2: RFC 2544 Latency Test Settings Setting Description Enable Enables or disables the RFC 2544 latency test. The latency test will not be executed if is not previously enabled by this control. -
Page 163: Back-To-Back Frames
Automatic Performance Tests Table 7.3: RFC 2544 Frame Loss Test Settings Setting Description Resolution (%) Measures the decrease in terms of bit rate the tester uses to measure frame loss expressed as a percentage of the nomi- nal transmission capacity. For example if throughput result is 100% for one specific frame size and this field is set to 10%, then frame loss will be evaluated for 100%, 90%, 80%... -
Page 164: System Recovery
User Guide 2 seconds, and it should be repeated at least 50 times with the average of the recorded values being reported. Table 7.4: RFC 2544 Back-to-back Test Settings Setting Description Enable Enables or disables the RFC 2544 back-to-back frames test. The back-to-back frames test will not be executed if is not previously enabled by this control. -
Page 165: Configuration Pass / Fail Thresholds
Automatic Performance Tests the throughput rate for each type of data stream tested, and for the measured recovery time for each type of data stream tested. Table 7.5: RFC 2544 System Recovery Test Settings Setting Description Enable Enables or disables the RFC 2544 system recovery test. The system recovery test will not be executed if is not previously enabled by this control. -
Page 166: Getting Test Results
User Guide Table 7.6: RFC 2544 Performance Objectives Setting Description Back-to-back frames Sets a performance objective for the RFC 2544 back-to-back frames test. The test is considered to fail if the back-to-back frames result is smaller than the configured threshold and it is considered to pass otherwise. - Page 167 Automatic Performance Tests results are available in Port B. On the other hand, if you have configured Two-way (A > A), Upstream or Downstream, the RFC 2544 results are available in Port A. Figure 7.1: RFC 2544 test results: (a) Throughput results table, (b) Latency results table. 3.
- Page 168 User Guide 5. Check the Current stage and In progress fields to know what is doing the tester in the current moment and which is the current test progress. Figure 7.2: RFC 2544 test results: (a) Frame loss result table, (b) Back-to-back frames result table.
- Page 169 Automatic Performance Tests Size and Throughput (%). Throughput (%) represents the bit rate used for testing latency and frame loss. It can be the previously measured maximum rate attaina- ble bit rate expressed as a percentage of the nominal interface rate (10 Mb/s, 100 Mb/s, 1000 Mb/s, 10 Gb/s) or a different value depending on the particular test settings.
-
Page 170: Generation Of Rfc 2544 Result Reports
User Guide Table 7.7: RFC 2544 Test Results Setting Description Measured max rate Measured maximum rate attainable in the transmission (fr/s) medium expressed in frames per second. This result is always smaller or equal than the theoretical maximum rate result. The measured maximum rate result is available in the Throughput test result table Delay (s) - Page 171 Automatic Performance Tests RFC 2544 Test Report Report name 2012-11-22-185949 Customer Department Company Location Operator Start Time Thu Nov 22 18:59:49 2012 Elapsed Time 11:16:44 Test Unit Ether.Giga Gigabit Ethernet Tester Serial number MEM0009P Software version 1.13.35 Global results Status FAIL Completed 100%...
- Page 172 Throughput (%) Recovery time Status 27.14 620.400 us PASS 47.07 906.000 us PASS 86.13 335.000 us PASS 100.00 0.000 us PASS 1024 100.00 0.000 us PASS 1280 100.00 0.000 us PASS 1518 100.00 0.000 us PASS (c) 2012 ALBEDO Telecom...
-
Page 173: Performance Assessment With The Esam Test
Automatic Performance Tests 7.2.Performance Assessment with the eSAM Test Ethernet service activation though eSAM defined in ITU-T 1564 has arisen as an alternative to RFC 2544 verification. Unlike the RFC 2544, eSAM is designed for Ethernet service activation from the beginning. The advantages of eSAM in front of RFC 2544 are summarized in the following points: Service provider edge device... - Page 174 User Guide end-to-end network performance and it is therefore an essential parameter to measure. Traffic acceptance Network xGenius Tester Traffic may or may not Subscriber traffic be marked by the service contains no color marks provider Traffic acceptance Network xGenius...
-
Page 175: Bandwidth Profiles For Ethernet Services
Automatic Performance Tests applications are the DSCP (Layer 3) and the VLAN priority bits (Layer 2). The lat- ter requires the subscriber frames to be encapsulated in VLAN tagged frames. 7.2.1. Bandwidth Profiles for Ethernet Services To see how eSAM works it is essential to understand how Ethernet services are defined. - Page 176 User Guide The MEF specifies the RFC 2698 Two-rate Three-Color Marker (trTCM) as the admission control mechanism for carrier Ethernet services. The trTCM is obtained by chaining two simple token bucket policers. Tokens fill the main bucket until they reach the capacity given by the CBS parameter, at a rate given by the CIR parameter.
- Page 177 However, admission control is necessary even in this case and frame remarking is done on non-conforming traffic anyway. Figure 7.8: CIR test results as presented by xGenius. The basic purpose of eSAM is to check that green and yellow frames are transported with the required performance in terms of Frame Total Delay (FTD), Frame Delay Variation (FDV), Frame Loss Ratio (FLR) and availability.
- Page 178 User Guide when required to do so. More details about these specific tests are provided in the following sections. Figure 7.9: EIR and policing test results as presented by xGenius.
-
Page 179: Test Configuration
Automatic Performance Tests 7.2.2. Test Configuration The way the equipment is configured depends on the particular network and service to be tested. Before running the test, there are several questions the user must answer: • What kind of network is going to be tested? Configuration is different for IP net- works and Ethernet networks. - Page 180 User Guide Table 7.8: eSAM Configuration Setting Description Color method The color method configures which field in the test traffic implements the color mechanism. There are the following potential choices: • DSCP: Differentiated Services Code Point. It is 6-bit class of service label that accepts values between 0 and 63.
- Page 181 Automatic Performance Tests Table 7.8: eSAM Configuration Setting Description Number of steps Number of different bit rates to be tested in the configuration CIR test. The test bit rates are equally distributed between 0 and CIR bit rates. Step duration (s) Duration of each iteration of the CIR test.
- Page 182 User Guide 3. Choose between Ethernet endpoint or IP endpoint with the Mode setting. 4. From the Home panel, go to TEST, The test configuration panel is displayed. 5. Go to Performance test and configure eSAM. 6. Enter in the eSAM menu to configure the global ITU-T Y.1564 settings. 7.
- Page 183 This performance metric is computed as 100% - PEU(%). Where the PEU(%) is the Percent Ethernet service Unavaila- bility defined in ITU-T Y.1563 and supplied by the xGenius SLA statistics. This metric is computed for eSAM performance tests only.
- Page 184 User Guide 18. Depending on your test setup (See section 2.2.3), configure Test method to One- way (A > B), Two-way (A > A), Upstream or Downstream. 19. If you have configured either the Upstream or Downstream test modes, configure Remote unit MAC (in Ethernet endpoint mode) or Remote unit IP (in IP endpoint mode).
-
Page 185: Cir Configuration Test
Automatic Performance Tests Note: In the same way than in Downstream Ethernet end point tests, you need to think in the port settings you configure as the configuration for the responder device. For this reason you are allowed to configure the Source IP address from field to Remote. -
Page 186: Eir Configuration Test
User Guide 6. Go to eSAM Configuration test. A table with eSAM configuration test results is displayed. 7. Use the Test- and Test+ contextual keys to select the eSAM CIR test results. Use the Serv- and Serv+ contextual keys to select the table corresponding to the ser- vice you want to check. - Page 187 Automatic Performance Tests Idealized IR Traffic Load Policing Policing Policing Policing Test Test Test Test Test Test Idealized IR Traffic Load Policing Policing Yellow Yellow Green Green Policing Policing Test Test Test Test Test Test Figure 7.10: Typical CIR, EIR and Policing tests in colour-aware and non colour aware services: (a) No colours are defined in the interface.
-
Page 188: Performance Test
While configuration tests take a few minutes to finish, a performance test may take hours or even days depending on the test requirements. Figure 7.11: Performance results as presented by xGenius. In some ways, the performance test is similar to the CIR test because in the network is... -
Page 189: Generation Of Esam Result Reports
Automatic Performance Tests The procedure to follow to display the performance test results is similar than for the CIR results but in this case it is necessary to go the eSAM Performance test result panel rather than to the eSAM Configuration test panel. 7.2.7. - Page 190 User Guide Number of services Number of steps Step duration (s) Policing test Disabled Performance test duration User duration User duration 00:01:00 Service configuration Service 2.000 Mb/s 2.000 Mb/s 2.000 Mb/s 2.000 Mb/s 2.500 Mb/s 2.500 Mb/s 2.500 Mb/s 2.500 Mb/s eSAM objectives Service Avail.
- Page 191 IR (Mbit/s) FTD (ms) FDV (ms) Avail. Status 2.000 0.000E+00 0.501 0.071 100.000 % PASS 2.000 0.000E+00 0.540 0.061 100.000 % PASS 2.500 0.000E+00 0.484 0.063 100.000 % PASS 2.500 0.000E+00 0.532 0.075 100.000 % PASS (c) 2013 ALBEDO Telecom...
-
Page 192: Performance Assessment With The Rfc 6349
Both the RFC 2544 and the eSAM tests are Ethernet and IP tests that provide the same result regardless of the application. They generate fixed frame rates and verify the ability of the network to transmit this traffic with a low impairment level. TCP transmitter TCP receiver xGenius xGenius Data Data TCP transmitter... - Page 193 The entity that starts the communication by initiating the handshaking procedure is the TCP client. The TCP server, on the other hand, accepts connections from clients and responds to their queries while the connection is active TCP transmitter TCP receiver xGenius xGenius Data TCP transmitter TCP receiver...
- Page 194 There are, actually, many different implementations of the TCP protocol. They differ on how they manage retransmission of lost / corrupted data, on congestion control and in other aspects. The xGenius test unit is based on a TCP implementation known as NewReno.
-
Page 195: Configuring The Rfc 6349 Test
7.3.1. Configuring the RFC 6349 Test xGenius has the ability to generate TCP flows to verify the protocol performance in terms of the metrics defined in standard RFC 6349. Users have control on how the TCP traffic is generated, the metrics to be evaluated and the performance thresholds required to declare a Pass or Fail. - Page 196 User Guide • Baseline RTT test: Measures the baseline RTT, the minimum time it takes for a TCP packet to travel from the near end to the far end and back to the near end. The baseline RTT could be also defined as the uncongested delay associated to the network under test.
- Page 197 Automatic Performance Tests Table 7.10: RFC 6349 Configuration Setting Description RTT test duration Configures the baseline RTT test duration. If Enable RTT test is configured to Enabled, then this field specifies the testing period for this parameter. Enable window Enables or disables the window sweep test. The window sweep test sweep test measures the transmission throughput for differ- ent window sizes and it...
- Page 198 This is a read only field that contains the maximum test dura- tion based on the current settings. To configure the TCP throughput test in xGenius, follow these steps: 1. Make sure that your tester is connected to the network. The physical layer must be up and working (See section 4.1.1).
-
Page 199: Setting The Performance Objectives
Automatic Performance Tests 14. If you have enabled Allow multiple connections in the previous stream, then set the Preferred window size for each TCP stream. 15. Leave the RFC 6349 configuration and Performance test panels. 16. Go to Test mode 17. -
Page 200: Retrieving The Results
User Guide To configure the RFC 6349 thresholds, follow these steps: 1. From the Home panel, go to TEST, The test configuration panel is displayed. 2. Go to Performance test and make sure that the RFC 6349.is configured. 3. Go to RFC 6349 objectives 4. - Page 201 Automatic Performance Tests 2. Select Port A to enter in the port specific results. 3. Select RFC 6349. Figure 7.15: RFC 6349 results panels: (a) Window sweep test, (b) TCP throughput test. 4. Check the Global status, Current test, Current test direction and Remaining fields to get an overview of the current test status.
- Page 202 User Guide 5. If you have enabled the baseline RTT test, go to RTT test to know the Baseline RTT and Window size. 6. If you have enabled the window sweep test, go to Window sweep and check the Connections, Theoretical throughput and Throughput for each transmission win- dow.
- Page 203 Automatic Performance Tests Table 7.12: RFC 6349 Results Setting Description RTT test Menu that provides access to a panel with the baseline RTT test results if this test has been configured to run. This panel contains Status information (Idle, In progress, Done, Error), the Baseline RTT result and the Window size derived from the expected IR settings and the baseline RTT.
-
Page 204: Configuring The Test Method
ALBEDO Telecom test units support two-way tests in their Port A. Port B can be used as a local traffic reflector but installing an external reflector in a remote network location is also possible. - Page 205 Moreover, the test unit supports one.way latency measurements between two- units placed in remote locations with GNSS or 1 PPS / ToD synchronization. Port A DUT / SUT Port B xGenius Tester Port A DUT / SUT xGenius xGenius...
- Page 206 Enables or disables the responder operation in the unit. If this mode is enabled, most of the test unit functionality is con- trolled by a remote Albedo unit (See section 7.5). Test method Configures the way the currently configured test is to be exe- cuted.
- Page 207 Automatic Performance Tests Table 7.14: Test Mode Configuration Setting Description Test method • Local bidirectional: Is a test method that runs between Port A and Port within the same test unit. In these tests both ports operate as traffic generators and analysers and therefore the test traffic runs in both transmission direc- tions.
-
Page 208: Using The Responder Function
(See section 7.5). 7.5.Using the Responder Function xGenius can be remotely managed by a compatible test unit in order to run the RFC 2544 or ITU-T Y.1564 asymmetric tests and the RFC 6349 remote bidirectional test. The asymmetric tests are far more powerful than the symmetric RFC 2544 and ITU-T Y.1564 because they enable separated measurement of the upstream and the... - Page 209 In bidirectional tests, the responder is at the same time a traffic generator and a traffic analyser. The correct procedure to configure xGenius as a passive responder is as follows: 1. From the Home panel, go to CONFIG, The port setup panel is displayed.
- Page 210 User Guide...
-
Page 211: Chapter 8: Ping And Traceroute Tools
Ping checks “distance” to any host in the network in terms of delay and packet loss. Results may not be as accurate as the SLA statistics supplied by other xGenius tests but Ping tests are fast, virtually supported by any IP network element and they are at least a good way to check end-to-end network connectivity before running a more sophisticated test. -
Page 212: Test Configuration
User Guide 8.1.2. Test Configuration The setup of a Ping test is much more simple than other tests. It does not require any special remote device like a traffic reflector to work and it works in virtually any network. The steps to follow to configure the IP ping are: 1. - Page 213 Ping and Traceroute Tools Table 8.1: IP Ping Settings Setting Description Destination IPv4 Destination IPv4 address carried by the packets generated in address the current stream if Destination IPv4 address from is set to Manual. The address is entered in decimal, four-dotted format. Any address between 0.0.0.0 and 255.255.255.255 is admitted as a destination IPv4 address.
-
Page 214: Result Verification
User Guide Table 8.1: IP Ping Settings Setting Description Initial Time To Live value configured in the packets transmit- ted in the current stream. The TTL is decreased by one unit each time it lefts a network node. If the value reaches zero, then the packet is discarded. The TTL is then a measure of the number of nodes the packet is allowed to transverse before reaching its destina- tion. - Page 215 The test port results panel is displayed. 2. Select Port A to enter in the port specific results. 3. Select Ping. 4. Check the Requests sent, Replies received, Replies lost, Packet loss, Minimum delay, Maximum delay and Average delay statistics. Figure 8.1: xGenius Ping results panel.
-
Page 216: Traceroute
User Guide 8.2.Traceroute Traceroute can be defined as an extended Ping test that traces intermediate network elements between the source and destination. These elements are identified by their IP addresses. For this reason, Traceroute is often used to check the path the packets follow when they are transmitted to the network.The test unit support two different implementations of the Traceroute application based on different probe packets: •... - Page 217 Ping and Traceroute Tools 12. Configure the Timeout, Interval, Max. number of hops, Number of packets/hop, Traceroute protocol and UDP port (UDP Traceroute only) parameters for the test. 13. Run the Traceroute test with the help of Run. Table 8.3: Traceroute Settings Setting Description Destination IPv4...
-
Page 218: Result Verification
Traceroute results are presented in real time within a dedicated panel in the test unit. To display the Traceroute results follow these steps: Figure 8.2: xGenius Traceroute results panel. 1. From the Home panel, go to RESULTS, The test port results panel is displayed. - Page 219 Ping and Traceroute Tools 4. Check the Node list and the Pkts, Min.(ms), Max.(ms) and Avg.(ms) statistics for each node in the list. Table 8.4: Traceroute Results Result Description Node IP address corresponding to a network node detected by the Traceroute test.
- Page 220 User Guide...
-
Page 221: Chapter 9 Ieee 1588 Analysis
Chapter 9 IEEE 1588 Analysis xGenius may optionally supply IEEE 1588 version 2, also known as Packet Time Protocol (PTP), emulation and analysis features. Some of the potential applications for the IEEE 1588 emulation and testing capabilities included in xGenius are: •... -
Page 222: Precedents: Ip Synchronization With Ntp
User Guide 9.1.1. Precedents: IP Synchronization with NTP The Network Time Protocol (NTP), is one of the oldest protocols still in use and it is available in two flavours: the full version and Simple NTP (SNTP), a subset of NTP. The latest version of NTP, version 4 (NTPv4) can usually maintain time to within 1- 20 ms using traditional software-interrupt based solutions over the public Internet and can achieve accuracies of microseconds or better in LANs under ideal conditions. -
Page 223: The Synchronization Mechanism
IEEE 1588 Analysis plied by special Announce messages generated periodically by Ordinary and Boundary Clocks. 2. Clock synchronization. Slave clocks may have a positive or negative offsets when compared with their masters and latency from masters to slaves is also unknown. PTP devices start a procedure to compute latencies and offsets. -
Page 224: Protocol Encapsulation
User Guide messages can be used. Follow_Up messages carry timestamps for a previous Sync message allowing a more relaxed timestamping procedure and simpler hardware. The Sync mechanism, however, does not take into account propagation time of Sync messages through the network. For this reason, the slave may request a latency measurement with a Delay Req message. -
Page 225: Unicast Addressing Mode
9.2.IEEE 1588 Grandmaster and Slave Emulation xGenius can be configured to behave as different kinds of PTP entities, including PTP master and slave clocks. Theoretically, there is no difference between any standard PTP clock and these equipments but the testers supply measurement results that are... - Page 226 Figure 9.3: IEEE 1588 master and slave emulation modes: (a) Connection diagram corresponding to the PTP slave emulation mode, (b) connection corresponding to the master emulation mode. The IEEE 1588 test results provided by xGenius when they are configured in Clock emulation mode can be classified in four different families: •...
-
Page 227: Configuration Of The Ieee 1588 Master And Slave
IEEE 1588 Analysis equipment to the network through the port A. Details about which results are available in each mode are provided in the following sections. 9.2.1. Configuration of the IEEE 1588 Master and Slave When configuring the test unit in master or slave emulation modes, it has to be taken into account that only the test Port A contains a full implementation of the protocol. - Page 228 User Guide 10. If you have configured Clock emulation to Master or Auto configure the Master clock type to One-step or Two step and set the Clock class and Custom clock class attributes. 11. If you have configured Addressing mode to Unicast, then you can configure one or more PTP entities to communicate with from the Unicast master table menu Note: Remote PTP entities are configured through their IP or MAC address, depending on the Transport protocol.
- Page 229 IEEE 1588 Analysis Table 9.2: IEEE 1588 Settings Setting Description Clock emulation This setting enables the user to configure the role of the test unit within the PTP network. It is one of the following: • Master: The equipment is forced to assume the role of a PTP master clock within the network.
- Page 230 User Guide Table 9.2: IEEE 1588 Settings Setting Description Addressing mode • Multicast: Configures multicast transmission in the PTP interface. It means that destination addresses of PTP messages transmitted by the interface will be multicast. If the current payload setting is UDP, then the correct desti- nation addresses are 224.0.1.129 and 224.0.0.107.
- Page 231 IEEE 1588 Analysis Table 9.2: IEEE 1588 Settings Setting Description Master clock type Configures generation of follow up packets for Sync and other PTP messages. This setting could have two different values: • One-step: Means that no follow up messages are gener- ated.
- Page 232 User Guide Table 9.2: IEEE 1588 Settings Setting Description Priority 1 This is a numeric parameter used by the BMC to establish the master / slave hierarchy with the help of the BMC algo- rithm. The range of accepted values of Priority 1 is between 0 and 255.
- Page 233 The Clock Id. is built from the port A MAC address following IEEE 1588v2. Port Port number. In a multi-port PTP device with it identifies each port. xGenius have all one single PTP port and therefore the port number is always 1.
- Page 234 2019), the TAI time is 37 seconds ahead of UTC. The UTC offset is required only if the slave has to translate the time into the UTC time scale. All xGenius time measure- ments in test mode are done in the TAI time scale and there-...
- Page 235 IEEE 1588 Analysis Table 9.3: IEEE 1588v2 Time Properties Settings Setting Description Timescale The time scale is an standard for the duration of the time unit (usually the atomic second) together with an epoch, which constitutes an origin for the seconds count. It is one of Arbi- trary or TAI.
- Page 236 User Guide play the slave role. This is because the test unit may wrongly understand that one or several messages are lost and trigger the actions corresponding to this event. Table 9.4: IEEE 1588v2 Message Timing Configuration Setting Description Sync TX interval Sync message rate transmitted by the test unit when the Addressing Mode is configured to Multicast.
- Page 237 IEEE 1588 Analysis Table 9.4: IEEE 1588v2 Message Timing Configuration Setting Description Announce RX time- Sets the number of missing Announce packets before a PTP outs (#msgs) slave declares the timing source to be lost. Any value between 2 and 10 messages is allowed. Only PTP slaves are expected to keep track of received Announce messages and therefore, this option is greyed out if Clock emulation is configured to Master.
-
Page 238: Protocol State
User Guide Table 9.4: IEEE 1588v2 Message Timing Configuration Setting Description Unicast Peer Delay Peer Delay Request message rate negotiated by unicast Req. interval PTP entities. If the entity finally becomes an slave it will deliver packets at the negotiated rate. Both grandmasters and slaves participate in the unicast Peer Delay Request interval negotiation and therefore, unlike it happens in the multicast addressing mode, this setting makes sense in all... - Page 239 IEEE 1588 Analysis 2. Select either Port A to enter in the port A specific results. Table 9.5: Protocol State Results Result Description Port state Displays one of the port states defined for the BMC algorithm in standard IEEE 1588-2008. These states determine which is the current role of the network equipment within the syn- chronization network (master or slave) or inform about spe- cial conditions or problems within the BMC algorithm.
- Page 240 User Guide Table 9.5: Protocol State Results Result Description Master IP address This is a 32-bit IPv4 address in the standard four-dotted dec- imal format A.B.C.D that describes the master. This result is displayed only if the PTP Transport Protocol is - UDP.
- Page 241 IEEE 1588 Analysis Table 9.5: Protocol State Results Result Description Grandmaster identity EUI-64 code associated to the grandmaster clock. The EUI- 64, computed as explained in standard IEEE 1588-2008, constitutes a globally unique identifier. The Grandmaster identity is different to the master identity only when the synchronization is transmitted through a chain involving several PTP master / slave relations.
- Page 242 User Guide Table 9.5: Protocol State Results Result Description Grandmaster time Indicates the time source used by the grandmaster clock. source The value is not used in the selection of the grandmaster clock. It is one of the following • Atomic clock: Any device that is based on atomic reso- nance for frequency and that has been calibrated against international standards for frequency and time.
-
Page 243: Message Statistics
IEEE 1588 Analysis 9.2.3. Message Statistics The Message statistics panel include counts of each PTP message type defined in IEEE 1588-2008. This result panel includes statistics both about received and transmitted (internally generated) packets. There is one Message statistics panel for each test port. In case, that protocol emulation or delay / jitter tests are not required, Port B can be used for message statistics compilation. - Page 244 User Guide Table 9.6: IEEE 1588 Message Statistics Result Description Peer Delay Request Computed number of received (RX) and transmitted (TX) Peer Delay Request messages. The Peer Delay Request message is part of the Peer Delay mechanism used to measure the two-way latency between master and slave.
-
Page 245: Delay Statistics
IEEE 1588 Analysis Table 9.6: IEEE 1588 Message Statistics Result Description Management Number of received (RX) and transmitted (TX) Management messages. Management messages are used to connect the PTP enti- ties to the management system and enable operation and maintenance of the synchronization network. Domain mismatch Total count of received IEEE 1588 messages no correspond- ing to the currently configured PTP domain. - Page 246 User Guide The procedure to display the delay statistics associated to PTP messages is as follows: Table 9.7: IEEE 1588 Delay Statistics Result Description Sync PTD (current) Last calculated value of the Packet Total Delay (PTD) experi- enced by IEEE 1588 Sync messages when they travel from the master to the test unit (with end-to-end delay mecha- nism) or from the peer entity to the slave (with peer-to-peer delay mechanism).
- Page 247 IEEE 1588 Analysis Table 9.7: IEEE 1588 Delay Statistics Result Description Sync PTD (range) Difference between the Sync PTD (maximum) and Sync PTD (minimum). This is an Sync PTD statistic but like it happens with the Sync PTD (std. dev.) it is more related with delay variation than with absolute delay.
- Page 248 User Guide Table 9.7: IEEE 1588 Delay Statistics Result Description Delay req. PTD Minimum value of Delay req. PTD (current) registered from (minimum) the beginning of the test. The Delay req. PDV (minimum) is computed both in slave emulation and test modes. Delay req.
- Page 249 IEEE 1588 Analysis Table 9.7: IEEE 1588 Delay Statistics Result Description Asymmetry (current) This result is computed as the difference of the Sync PTD (current) and Delay req. PTD (current). Delay asymmetry may cause a wrong time estimates in PTP slave clocks and for this reason this parameter has to be carefully controlled in PTP roll-outs for phase and time applications.
-
Page 250: Clock Status
User Guide Table 9.7: IEEE 1588 Delay Statistics Result Description Sync correction Current value of the correction field found in received Sync (current) messages. This value corresponds with correction field found in the last decoded Sync message. The Sync correction (current) metric is computed in slave emulation, pseudo-slave emulation (test mode) and passive monitor modes. - Page 251 IEEE 1588 Analysis fluctuations no the received phase. The phase and frequency errors are displayed in the Slave clock status panel. To display the phase and frequency errors, follow these steps: Table 9.8: Slave Clock Status Metrics Result Description PTP time If the unit is operating as a PTP grandmaster, this field shows the system time, which is the time the unit distributes to the remote PTP slaves.
-
Page 252: Unicast Negotiation Results
Phase offset Phase offset between the currently selected IEEE 1588 mas- ter and xGenius. If the equipment is working in slave emula- tion mode, it tracks the phase recovered from the master (and compensates for transmission latency using either the Delay request-response or the Peer delay mechanisms). -
Page 253: The Pseudo-Slave Emulation Mode
IEEE 1588 Analysis 9.3.The Pseudo-slave Emulation Mode The pseudo-slave emulation is similar to the slave emulation mode but the test unit now keeps an independent synchronization source. Typically, a GNSS reference is used but the test equipment could use any other reference such as ToD, 1 PPS, frequency inputs or even the internal oscillator in holdover / free running states. -
Page 254: Te Test
User Guide 9.3.1. TE Test The basic performance parameter for phase and time deployments is TE. Basically, TE tells how much time a certain clock is ahead or behind some reference time. TE is generated in PTP-aware and non-PTP-aware network entities. Moreover, the transmission medium could also contribute to the TE. -
Page 255: Wander (Mtie / Tdev) Test
IEEE 1588 Analysis Table 9.9: TE Statistics Result Description Low frequency Low frequency Time Error. This result expresses TE compo- nents that are immune to filtering. Such TE components are the result of, for example, asymmetry in the transmission medium between network elements or asymmetries within network elements. - Page 256 User Guide phase error. There are many performance figures defined to assess the quality of a timing signal but the most important of them are: Selection - Minimum - Maximum - Percentile - Band MTIE (k) Packet filter TDEV (k) selection TIE (n) Computes...
- Page 257 PTP messages. xGenius measures the pktFilteredTIE, pktFilteredMTIE and pktFilteredTDEV in the terms defined in ITU-T G.8260. The IEEE 1588 MTIE / TDEV is compatible with the Ethernet endpoint and IP endpoint operation modes (See section 2.1).
- Page 258 User Guide Table 9.10: Wander Test Configuration Parameters Setting Description Selection method Configures one of the packet selection method to be used to filter PTP samples to compute wander performance metrics. The selection method configured in this field constitutes a not linear filter applied to the timing input before it is trans- ferred to the wander metric calculation block.
- Page 259 IEEE 1588 Analysis Table 9.10: Wander Test Configuration Parameters Setting Description BW filter window Window length expressed in seconds for the linear filtering processing block placed before the MTIE and TDEV block. Unlike the selection filter, the linear filtering operates by aver- aging sample values before they are used to compute the MTIE and TDEV values.
- Page 260 User Guide Table 9.10: Wander Test Configuration Parameters Setting Description Standard • Masks for Synchronization Supply Unit (SSU) outputs. These are the SSU G.823 / SSU EN 300 462-3-1, SSU G.812 Noise Generation (CT), SSU G.812 Noise Genera- tion (VT), SSU G.812 Noise Tolerance and SSU G.812 Noise Transfer.
-
Page 261: Floor Delay Population Test
IEEE 1588 Analysis 1. From the Home panel, go to RESULTS, The test port results panel is displayed. 2. Select Port A to enter in the port specific results. 3. Enter in PTP to display results about the PTP protocol. 4. - Page 262 By definition, there are no packets with end-to-end delay below the floor delay. xGenius implement the floor delay population with the equipment configured in pseudo- slave mode. The procedure to configure the equipment in this mode is the same that for the MTIE / TDEV test (See section 9.3.2).
- Page 263 IEEE 1588 Analysis Table 9.11: Floor Delay Population Test Configuration Parameters Setting Description Overall min. floor This configuration field is not used in the current implementa- delay tion of the floor delay population test. FPC window length The floor delay population method is based on a sliding win- dow mechanism.
-
Page 264: Passive Monitoring
PTP slave. A typical example happens when an slave device exhibits poor performance for unknown reasons. A quick PDV measurement with xGenius could be useful to determine... - Page 265 Master device emulation Passive Monitor xGenius Figure 9.6: Connection of xGenius to the network in PTP Passive monitor mode: (a) Connection in pass-through mode (IP through operation mode). (b) Connection in endpoint mode (Ethernet endpoint or IP endpoint operation modes).
- Page 266 User Guide If you want to run the PTP monitor in IP endpoint or IP through modes, you will need to set your local profiles with correct IP addresses, network masks and gateways. For the specific case of the IP through mode, you will have to configure the local profile of both Port A and Port B.
-
Page 267: Chapter 10: Synchronous Ethernet Analysis
Chapter 10 Synchronous Ethernet Analysis xGenius may optionally support the ITU-T defined Synchronous Ethernet standard which enables these equipments qualify Synchronous Ethernet network equipment or to generate Ethernet signals synchronized to various timing sources, including GPS and TDM. 10.1.Introduction to Synchronous Ethernet... - Page 268 User Guide tion for SDH /SONET can be transported over Ethernet and the opposite is also true. • The ITU-T G.8262 defines Synchronous Ethernet clocks compatible with SDH / SONET clocks. Synchronous Ethernet clocks are based on ITU-T G.813 clocks and they are defined in terms of accuracy, noise transfer, holdover performance, noise tolerance, and noise generation.
-
Page 269: Ethernet Synchronization Messaging Channel
Synchronous Ethernet Analysis external timing or to supply timing to other subsystems. On the other hand, the conventional card is relegated to operate with its own ±100 ppm internal clock. Note that the conventional card is still able to use the clock from an external subsystem (for example the CPU) for data transmission but data reception is not coupled to the transmitter clock and it is also uncoupled to other transmitters in the network. - Page 270 User Guide bytes Preamble (0xaa-aa-aa-aa-aa-aa-aa) SDF (0xab) MAC DA (01-80-C2-00-00-02) MAC SA bytes Slow Protocol Ethertype (0x88-09) Type (0x01) Slow Protocol Subtype (0x0a) Length (0x00-04) ITU-OUI (00-19-a7) Reserved (0x0) SSM code ITU Subtype Version Reserved Future enhancement TLV 32~1486 ITU-T G.8264 ESMC PDU Figure 10.2: Ethernet Synchronization Message Channel (ESMC) protocol data unit.
- Page 271 Synchronous Ethernet Analysis while in 1000BASE-X or 100BASE-T you can theoretically have one synchronization signal propagating in each transmission direction. NIC clock RX clock recovery FIFO FIFO System clock RX clock NIC clock recovery FIFO FIFO System clock NIC clock RX clock recovery FIFO FIFO...
-
Page 272: Frequency Measurement
±100 ppm range specified by the IEEE 802.3 standard. However, Synchronous Ethernet frequency is important because this frequency is used by external elements as a synchronization source. xGenius includes a frequency measurement that can be used to verify that the frequency offset of the received signal lies within acceptable limits. - Page 273 Synchronous Ethernet Analysis 5. From the Home panel, go to TEST The test configuration panel is displayed. 6. In the SyncE wander test field, configure MTIE / TDEV. 7. Configure the Observation time to one of the allowed values. The test finishes automatically when the Observation time is reached.
-
Page 274: Frequency Offset Generation
The configuration procedure for frequency offset generation over Ethernet interfaces is as follows: 1. -
Page 275: Wander Generation
+ 10 ppm Frequency offset generation + 10 ppm xGenius Figure 10.4: If Synchronous Ethernet is used for transmission of timing signals, network elements in the chain should be transparent to offset generation at its input and therefore any frequency offset should be recovered at the output of the chain. -
Page 276: Operation In Ip Through Mode
You can use the test unit to forward and impair the Ethernet frequency in pass-through mode. Specifically, xGenius is capable of forwarding synchronization and traffic between port A and B and adding frequency offset to the signal forwarded to port A. -
Page 277: Esmc Generation And Analysis
= fi + 10 ppm xGenius + 10 Figure 10.5: With the help of xGenius it is possible to generate frequency offset in pass- through mode to stress the network. 10.7.ESMC Generation and Analysis The test unit can be configured to generate and analyse the ESMC in a Synchronous Ethernet interface. - Page 278 User Guide 3. Select Port A to enter in the port specific configuration. 4. Make sure that Port mode is configured to TX / RX Note: Depending on the unit global operation mode the TX / RX port mode may not be available.
- Page 279 Synchronous Ethernet Analysis 5. Check the Current QL, Current QL (hex), Message count and Event count param- eters. Table 10.3: ESMC analysis results Event Description Current QL Displays the ITU-T G.781 mnemonic corresponding to the current quality level received in SSM messages This result is referred to the last SSM message decoded by the test unit.
- Page 280 User Guide...
-
Page 281: Chapter 11: Test Management
Chapter 11 Test Management This chapter describes all those features available in your test unit that are not directly related with configuring your tester or reading measurement results but they are important for proper test management. Specifically, configuration and result management, report generation and test platform settings are covered in the following sections. - Page 282 User Guide text or PDF files from the USB slave connector and they can be exported through the USB master port, the SD card reader or the web interface. Table 11.1: Report Files Panel Setting Description Internal memory Displays report files stored in the internal tester memory. The test unit stores up to 50 report files.
-
Page 283: File Management
11.2.File Management xGenius stores configurations, event logs and reports in files. These files can be deleted, renamed or exported to an external USB memory or micro SD card. Configurations can be shared between different test units by means compatible storage devices. -
Page 284: Renaming Files
User Guide 11.2.2.Renaming Files Configurations, event logger files and report files can be renamed after they are created. To rename files follow these sequence: 1. From the Home panel, go to File ( ), The tester file manager base menu is displayed. 2. -
Page 285: Importing Configurations
Test Management 1. From the Home panel, go to File ( ), The tester file manager base menu is displayed. 2. Select Configuration files or Report files. 3. Select Internal memory, to list the files currently stored in the unit. 4. -
Page 286: Configuring What To Do When The Disk Is Full
User Guide 3. Optionally, select Configuration files, Report files or Event logger files and delete all files of these type with the appropriate contextual key. 11.2.7.Configuring What to Do When the Disk is Full Users decide what to do when the disk storage capacity is exhausted. The available options are: •... -
Page 287: Programming Tests
Figure 11.1: xGenius web interface: (a) Home panel (b) Event logger file management panel. 11.3.Programming Tests xGenius is able to start and finish tests without direct user intervention. All automatic testing features are included within the Autostart/stop menu. Follow these steps to program an automatic measurement in the test unit. - Page 288 User Guide 4. If you want the automatic test to stop at a specific time after it has started set Stop mode to Auto and enter test duration with the help of the Duration and User dura- tion controls. Note: Manual stop has precedence over autostop. That means that if a tester is stopped by pressing Run but there is an automatic test programmed the manual test will stop anyway.
-
Page 289: Using The System Menu
Test Management Table 11.2: Autostart / stop Panel Setting Description Last power down on Displays the date and time when the tester was powered down for last time. 11.4.Using the System Menu The System menu includes platform wide settings organized in four different sub- menus: •... - Page 290 User Guide Table 11.3: General Settings Panel Setting Description Time display Select the way the time is displayed in the graphical user interface. One of the following has to be selected: • Elapsed: Time from the beginning of the test is displayed with the following format hh:mm:ss.
-
Page 291: Using The Network
Table 11.4: System information panel Setting Description Model Name Shows the test unit model name: xGenius. Serial number Displays the test unit serial number. It is a 8 character alpha- numeric string Software version Displays the current software release. - Page 292 • Maintenance and factory configuration: The ALBEDO Telecom staff use the plat- form network interfaces to configure or verify the equipment in the factory. This feature is not available to ordinary users.
- Page 293 Test Management Table 11.6: Network Interface Configuration Setting Description Use DHCP Configures the mechanism used to set the interface IP address and mask (and also other system-wide settings like the gateway address and the DNS server). If Use DHCP is enabled, the IP profile is configured automatically using a DHCP server installed in the network.
- Page 294 User Guide Table 11.6: Network Interface Configuration Setting Description Ethernet address 48-bit physical address of the NIC attached to the test unit. In Ethernet interfaces, this address is assigned to the NIC when it is manufactured and it cannot be changed later. In wireless interfaces, the Ethernet address corresponds with the MAC address assigned to the external WiFi adapter by the manu- facturer.
- Page 295 Test Management If you are configuring a wireless interfaces there is an specific configuration to be done before you can set the IP layer. These configuration includes the setting of the wireless network Table 11.7: Wireless interface settings Setting Description Association mode Configures the way the test unit has to access to communi- cate to other devices through the wireless interface: There...
- Page 296 User Guide Table 11.7: Wireless interface settings Setting Description Type of key Configures the way the key for the WEP encryption is going to be entered. There are the possible configurations for this setting: • HEX: Configures the WEP key in hexadecimal format. For WEP-64 you have to enter exactly 10 hexadecimal digits (from 0 to 9 or A, B, C, D, E and F letters).
-
Page 297: Installing Software Options
Association mode is Infrastructure. 11.4.2.Installing Software Options New software for xGenius can be licensed after the unit as been purchased when new testing needs arise. To install new software options for your unit follow this procedure. -
Page 298: Upgrading The Power Management
2. Open the Licensing menu. 3. Enter the maintenance password for your unit in Service password. Note: This password is different for each unit and it is supplied by ALBEDO Tele- com on demand. 4. Press the back key to display the System panel again. -
Page 299: Using Ntp And Gps/Nmea For System Clock Synchronization
The system clock controls the date and time assigned to configuration and report files and controls the auto-start / stop function. xGenius users can manually set the system time and date by entering the correct values but they can also synchronize the clock with an external NTP server or GNSS. - Page 300 User Guide Table 11.9: Time Source Configuration Options Setting Description UTC offset (min) This is the value to be configured when the time offset between your local time zone and the UTC zone is not an integer value of hours. This setting makes sense only if Time Source has been con- figured to NTP or Time reference.
-
Page 301: Using The Remote Control
They must have a VNC client installed. Currently, there are VNC clients for most OS in the market. Some of them are free. The remote control is an optional feature for xGenius that is supplied by ALBEDO Telecom with an special license. - Page 302 User Guide 6. Use the keyboard or the mouse to browse the instrument panels, start measure- ments, insert events or any other action. Table 11.10: Remote Control Keys Description Home It is equivalent to the HOME key. It displays the Home panel. It is equivalent to the Esc key.
-
Page 303: Appendix A Technical Specification
Appendix A Technical Specification A.1. General 1. Operation over two SFP / SFP+ compatible interfaces and two 1 Gigabit Ethernet RJ45 connectors. Each set SFP / SFP+ and RJ-45 constitutes one logical port (Port A - Port B). 2. Supports concurrent synthetic traffic generation and analysis over Port A and Port B, including Ethernet / IP multistream traffic generation, PHY / ETH / IP / UDP traffic reflection and advanced QoS analysis. -
Page 304: Clock
User Guide 4. Through operation: The equipment does not generate traffic. Traffic received from port A is forwarded to port B. Traffic from port B is forwarded to port A. A.3. Clock 1. Internal time reference better than ±2.0 ppm. 2. -
Page 305: Clock Reference Outputs
2. 1 PPS, 1PP2S balanced (REF IN/OUT) and unbalanced (REF IN port) compatible with standard ITU-T G.8271. ToD balanced (REF IN/OUT) compatible with ITU-T G.8271, China Mobile and NMEA formats. 3. Ethernet through Port A and Port B (over any valid electrical / optical synchronous Ethernet interface). -
Page 306: Power Over Ethernet
User Guide 3. Fixed frequency offset generation on transmitted signals with maximum value of ±120 ppm as per ITU-T O.174 (11/2009) 8.2.1. 4. Sinusoidal wander generation on Ethernet interfaces following ITU-T O.174 Amendment 1 sections 8.4.2.1 and 84.2.2 and ITU-T O.174 (11/2009) section 8.4. 5. -
Page 307: Mpls
8. In Q-in-Q mode, configuration of the S-VLAN VID, DEI and PCP. Configuration of the C-VLAN VID and User Priority. 9. Configuration of the frame size. 10. Insertion of FCS errors using the following insertion modes: single, burst, rate and random. -
Page 308: Bandwidth Profiles
User Guide A.8.1. Bandwidth Profiles 1. Traffic can be generated in four different modes: Continuous, Periodic burst, Ramp and Random. 2. Continuous traffic is specified by a single parameter entered either as a percent- age of the channel capacity, a value in b/s or a value in frames/s. 3. -
Page 309: Ethernet Selection
Ethernet frames carry IP traffic it is possible to select frames by the contents of higher lever protocols of the TCP/IP stack. 4. The equipment supports a generic filter which can select frames by using a 16 bit mask and an arbitrary offset defined by the user. A.9.1. -
Page 310: Phy Results
User Guide 3. Operation and equipment connection to the network is as any IEEE 1588 Ordinary Clock. 4. Both Master and Slave operations are supported in endpoint mode. Ability to force Slave or Master roles. 5. Encapsulations: PTP over UDP over IPv4 (IP Endpoint mode) as defined in IEEE 1588-2008 Annex D, PTP over IEEE 802.3 / Ethernet as defined in IEEE 1588- 2008 Annex F. -
Page 311: Frame Analysis
3. Decoding of the QL transported in SSM as per ITU-T G.781 clauses 5.5.3.1 (Option I), 5.5.3.2 (Option II) and 5.5.3.3 (Option III). A.12.Frame Analysis 1. Simultaneous per port statistics. A.12.1.Ethernet Statistics 1. Frame counts: Ethernet, IEEE 802.1Q (VLAN), IEEE 802.1ad frames, Q-in-Q frames, control frames, pause frames. -
Page 312: Service Disruption Time
User Guide 2. Delay statistics are provided by means the point-to-point, Ethernet frame transfer delay (FTD): current, minimum, maximum, and mean values. FTD statistics follow definitions given in ITU-T Y.1563 3. Delay variation statistics are provided by the following statistics: standard devia- tion of the FTD, peak FDV (difference between maximum FDV and minimum FDV), current jitter (smoothed value of the jitter following RFC 1889 and RFC 3393), maximum jitter, mean jitter. -
Page 313: Ptp / Ieee 1588 Statistics
A.13.PTP / IEEE 1588 Statistics 1. Protocol state details: port state, best master clock protocol state, master identity, grandmaster identity, grandmaster BMC priorities, grandmaster clock class, grand- master accuracy, grandmaster clock variance, grandmaster time source, master IP or Ethernet address 2. -
Page 314: Itu-T Y.1564 Test
A.14.3.IETF RFC 6349 Test 1. Operation modes: active (client) or passive (server). 2. Accepted endpoints in client mode: Albedo and IPerf3. 3. Allows user configuration of the MTU and MSS. 4. User configuration of the Bottleneck Bandwidth (BB) in frames/s or as a percent- age of the nominal link capacity. -
Page 315: Icmp Processor
A.16.ICMP Processor 1. Generation of on demand ICMP echo request (RFC 792) messages with custom destination IP address, packet length and packet generation interval. 2. Analysis of ICMP echo reply (RFC 792) messages with measurement of round trip time and lost packets. 3. -
Page 316: Results
User Guide A.18.3.Results • Storage in TXT and PDF file formats. • File transfer to SD card and USB port. • File management through web interface and SNMP. • Configuration and report storage and export through attached USB port. A.18.4.Operational Ranges •... - Page 317 The following table summarizes some common configuration issues related with everyday use of xGenius. Some of them are applicable only to a very specific situations but some others are valid as a general use advises. For example it is always better to use the local IP address as the source address for test traffic than an spoofed (manual) address whenever is possible.
- Page 318 ARP does not resolve any des- • Your local proflie contains wrong settings. Your tination MAC address. xGenius unit decides where to send ARP requests using your local IP address, subnet mask and default gateway configuration. If there is an error with these settings your requests will be lost in the network or the destination will be unable to send the reply back to the origin.
- Page 319 NAT filter from the Internet. • The remote host should be able to reply to ARP requests. Note that xGenius is unable to respond to ARP requests from addresses different to the local one. In case you need to receive test traffic in addresses different from the local one, you will need to configure static ARP entries in the router.
- Page 320 User Guide Table B.1: Issue Solution No traffic detected in Filters • The traffic is being lost somewhere in the net- panel. work. Use the global result statistics to know if this is the case. Make sure that the remote loop- back device (if used) is properly configured.
- Page 321 Table B.1: Issue Solution eSAM Policing test always • You are running a policing test but there is not a fails. traffic admission mechanism configured in the network. The eSAM policing test is designed to test this mechanism and it fails if not conforming traffic is not dropped.
- Page 322 User Guide...
Need help?
Do you have a question about the xGenius and is the answer not in the manual?
Questions and answers