Table of Contents
Advertisement
I
NSTRUCTION MANUAL
SOMNOwatch™ plus
Caution-- Investigational device. Limited by Federal (or
United States) law to investigational use.
SOMNOmedics GmbH – Am Sonnenstuhl 63 – D-97236 Randersacker
Tel. +49 (0) 931 / 35 90 94 0 – Fax +49 (0) 931 / 35 90 94 49
E-Mail info@somnomedics.de
Internet www.somnomedics.de
Advertisement
Table of Contents

Related Manuals for SOMNOmedics SOMNOwatch plus

Summary of Contents for SOMNOmedics SOMNOwatch plus
- Page 1 Caution-- Investigational device. Limited by Federal (or United States) law to investigational use. SOMNOmedics GmbH – Am Sonnenstuhl 63 – D-97236 Randersacker E-Mail info@somnomedics.de Tel. +49 (0) 931 / 35 90 94 0 – Fax +49 (0) 931 / 35 90 94 49...
- Page 2 SOMNOmedics GmbH – Am Sonnenstuhl 63 – D-97236 Randersacker Tel. +49 (0) 931 / 35 90 94 0 – Fax +49 (0) 931 / 35 90 94 49 E-Mail info@somnomedics.de - Internet www.somnomedics.de Rev. 4 14.11.2019 All proper names marked with TM are protected copyright by SOMNOmedics.
-
Page 3: Table Of Contents
Index Introduction ............................ 7 About this instruction manual ..................... 7 Explanation of Symbols used in this Manual ................7 About the SOMNOwatch™ plus ....................8 Indication for Use: ........................8 Model and Device Number ......................9 Elements of keyboard ....................... 10 Configuration .......................... - Page 4 6.7.2 Sleep Wake Analysis ....................... 64 6.7.3 Tremor Analysis ....................... 68 6.7.4 PLM/RLS Analysis ......................69 6.7.5 Body Temperature ......................73 6.7.6 EDA ..........................75 6.7.7 Sleep Profile........................76 6.7.8 ECG Analysis ........................80 6.7.9 Training/Rehab ........................ 82 6.7.10 Flow/Snore ........................83 6.7.11 CPAP Control........................
- Page 5 7.4.2.2 Function of the Raw Data Pop-up Window ............129 7.4.3 Layouts for Data Display in Analysis Mode ..............131 7.4.4 Inserting and Editing Markers ..................131 7.4.5 Creating and Editing Samples ..................132 7.4.6 Creating, Deleting and Editing User areas ..............133 7.4.7 The Event List ........................
- Page 6 10.5 Warranty ..........................159 10.6 Disposal of Parts and/or the SOMNOwatch plus............159 10.7 Accessories and Spare Parts ..................... 160 10.8 Contact ..........................161 10.9 Notes ..........................162...
-
Page 7: Introduction
1 Introduction The SOMNOmedics team would like to thank you for purchasing this product. We are confident that you will enjoy using the SOMNOwatch™ plus for many years. The SOMNOwatch™ plus has been developed by SOMNOmedics to meet the highest quality control standards available. -
Page 8: About The Somnowatch™ Plus
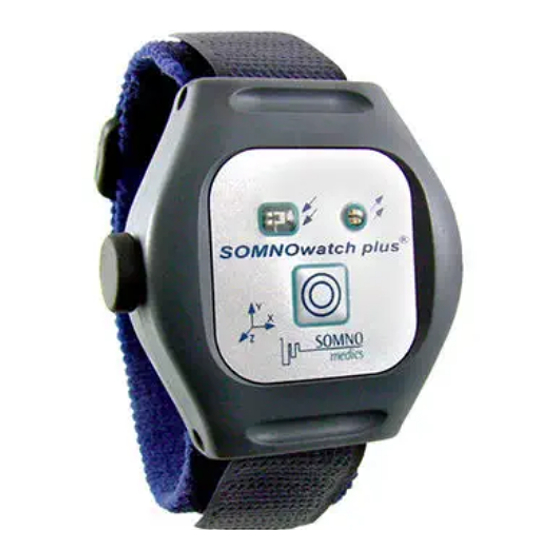
2 About the SOMNOwatch™ plus External Signal Status LED’s Light Sensor Input (AUX) Interface/Charger Connector Body Position Sensor Internal Buzzer Acceleration Sensor (x,y &z direction) Marker Button fig. 2-1: About the SOMNOwatch™ plus 2.1 Indication for Use: The SOMNOwatch plus is an Actigraph with the possibility to record Bio-Signals via the external signal input. -
Page 9: Model And Device Number
2.2 Model and Device Number When unpacking the SOMNOwatch™ plus, check to make sure that all items are in good condition and that all accessories correspond to the delivery note. Also compare the Model on the delivery note with the label on the bottom of SOMNOwatch™ plus. fig. -
Page 10: Elements Of Keyboard
2.3 Elements of keyboard Picture Description Function green LED yellow LED Idle Mode Waiting Mode flashes 1x /3s Recording Mode flashes 16x /s Initialisation / data transfer 2s on Error during initialisation + buzzer Recording with programmed sampling of external signal: Status LED’s sampling on flashes 16x /s... -
Page 11: Configuration
2.4 Configuration Scope of delivery of the basic set Actigraphy: SOMNOwatch™ plus Watch Strap size M Docking Station Battery Charger USB Cable Bag for device and sensors Manual Software DOMINO light (2 Licenses) You will find a list with additional sets and accessories in chapter 10.7. -11-... -
Page 12: Safety Instructions
Opening the case, repairing or modifying the SOMNOwatch™ plus in any way will void the guarantee. Only SOMNOmedics and its authorised distributors may repair the unit. Any intervention will result in an instant loss of warranty. - Page 13 Damaging the warranty seal will result in an instant loss of warranty. Always use the SOMNOmedics Docking Station (SOW106) to charge the internal battery. Otherwise the battery can be damaged. -13-...
-
Page 14: Installing The Domino Light Software
4 Installing the DOMINO light Software Please note the System Requirements for running DOMINO light Software (see chapter 7.1). Please also note that the Software must be activated by entering a Registration Code (see chapter 7.3.2). You will find the file on the installation CD. - Page 15 Accept the selection New Installation by clicking the Next button. Choose SomnoWatch Plus at Montage and click on the Next button. Start the installation process by clicking the Next button. -15-...
- Page 16 When the installation is complete the software will ask if you want to install the USB driver for the Docking Station. If you choose to Install SOMNOmedics USB Driver now, the manual selection of the driver file location will not be required in Chapter 5.
- Page 17 Updating the Software To update your software version please install the new version in the same directory as the basic version. During the installation you will be asked to choose one of the following installation types. -17-...
- Page 18 After the installation of the update you have to confirm your registration ID in the global preferences. Confirm the Code in the Tab “folder” by clicking on “Save and Exit” -18-...
-
Page 19: Docking Station Driver Installation
5 Docking Station Driver Installation Win XP The first time you connect the SOMNOwatch™ plus Docking Station to a USB-port the following window will occur: Click on Continue Anyway to start the installation of the driver. Please choose the option No, not this time and click on the Next button Click on Finish to complete the installation. -
Page 20: Operating Instructions
6 Operating Instructions Note: The SOMNOwatch™ plus automatically switches in idle mode when no measurement is running. Begin and End of recording are programmed by the delivered DOMINO software. The date and time of the PC system clock is transferred to the SOMNOwatch™ plus during initialisation. - Page 21 Patient Data Input: ▪ Enter the data into the corresponding fields. Type carefully as this information will be saved for later use. It is important to enter a Patient ID number. This number is used to store the Patient Data in the optional Patient Database.
- Page 22 Now select or create a montage for the particular application. The montage defines the channels that will be recorded. Depending on the application we recommend the following montages: Activity Analysis fig. 6-4: Montage “Activity Analysis” Sleep Wake Analysis fig. 6-5: Montage “Sleep Wake Analysis” -22-...
- Page 23 Tremor Analysis fig. 6-6: Montage “Tremor” PLM/RLS Analysis a) with external EMG Sensor b) with external Activity Sensor fig. 6-7: Montage “PLM/RLS” -23-...
- Page 24 Body Temperature fig. 6-8: Montage “Temperature” fig. 6-9: Montage “EDA” -24-...
- Page 25 Sleep Profile fig. 6-10: Montage “Sleep Profile” ECG-Analysis fig. 6-11: Montage “ECG” -25-...
- Page 26 Training/Rehab fig. 6-12: Montage “Training/Rehab” Flow/Snore fig. 6-13: Montage “Flow/Snore” -26-...
- Page 27 CPAP fig. 6-14: Montage “CPAP” → Used to create a new montage → An existing montage may be saved with a different name after modification. Template → Here it is necessary to choose an applicable analysis template for the recording. It is possible to create and change these analysis templates in the Global Settings (see chapter 7.3.4) Magnitude = Quantitative determination of activity by summing all X-Y-Z movements within one...
- Page 28 Start options: Manual start (1) → Measurement is started manually by pressing the marker button quickly 6 times consecutively. start immediately (2)→ Type in the recording duration. The measurement will be started immediately after initialisation. Auto Start (3)→ This option is used when the patient uses the SOMNOwatch™...
-
Page 29: Attaching The Sensors
6.2 Attaching the Sensors 6.2.1 Activity Analysis / Sleep Wake Analysis / Tremor Analysis a) Attach the Watch Strap to the SOMNOwatch plus. b) Apply the SOMNOwatch plus to the wrist of the non-dominant hand. If the SOMNOwatch plus is used for Tremor Analysis the SOMNOwatch plus should be applied to the affected hand. -
Page 30: Plm/Rls Analysis
6.2.2 PLM/RLS Analysis 6.2.2.1 Recording with external EMG Sensor a) Attach the SOMNOwatch plus at the Foot Strap. b) Apply the SOMNOwatch plus above the ankle of the right foot (external connector to the top). d) Clean the skin area on the left leg (Tibialis anterior). Connect three disposable Snap Electrodes to the EMG Sensor. -
Page 31: Recording With External Activity Sensor
6.2.2.2 Recording with external Activity Sensor a) Attach the SOMNOwatch plus at the Foot Strap. b) Apply the SOMNOwatch plus above the ankle of the right foot (external connector to the top). c) Attach the external Activity Sensor to the second Foot Strap and apply it to the ankle of the left foot. Lead the connecting cable along the legs and connect it to the SOMNOwatch plus. -
Page 32: Body Temperature
6.2.3 Body Temperature a) Attach the SOMNOwatch plus at the Body Belt and apply it to the patients thorax. b) Connect the Temperature Probe to the blue adapter box and than the box to the SOMNOwatch plus. Slip a protection cover over the end of the Temperature Probe and insert it rectally. -
Page 33: Eda
6.2.4 a) Attach the Watch Strap to the SOMNOwatch plus. b) Apply the SOMNOwatch plus to the wrist of the non-dominant hand. c) Attach the EDA Sensor to the Watch Strap and connect the cable to the SOMNOwatch plus. Clean the skin areas at the palm of the hand. Connect two electrodes to the EDA Sensor and remove the protective foil. -
Page 34: Sleep Profile
6.2.5 Sleep Profile a) Attach the SOMNOwatch plus at the Body Belt and apply it to the patients thorax. b) Clean the skin areas at forehead and behind the left ear. Attach disposable Snap Electrodes to the connectors of the sensor, remove the protective foil and apply them to the head. Lead the connecting cable along the back of the head and connect it to the SOMNOwatch plus. -
Page 35: Ecg Analysis / Training Control / Rehab
6.2.6 ECG Analysis / Training Control / Rehab a) Attach the SOMNOwatch plus at the Body Belt and apply it to the patients thorax. b) Clean the skin areas at the upper part of the body. Attach disposable Snap Electrodes to the connectors of the sensor, remove the protective foil and apply them. -
Page 36: Flow/Snore
6.2.7 Flow/Snore a) Attach the SOMNOwatch plus at the Body Belt and apply it to the patients thorax. b) Apply the Nasal Cannula and lead the tubes along the back side of the ears. Fix the Nasal Cannula by moving the sleeve under the chin. Fix the Pressure Sensor to the Body Belt and connect the cable to the SOMNOwatch plus. -
Page 37: Cpap
6.2.8 CPAP a) Attach the SOMNOwatch plus at the Body Belt and apply it to the patients thorax. b) Connect the cable of the Pressure Sensor to the SOMNOwatch plus and screw the Silicone Tube onto the Luer-Lock Connector of the Pressure Sensor. Attach the open end of the Silicone Tube to the O connector of the mask. -
Page 38: Data Transfer From Somnowatch™ Plus To Pc
6.3 Data Transfer from SOMNOwatch™ plus to PC Once there are one or more measurements on the SOMNOwatch™ plus, it is possible to transfer these with the DOMINO light software and the Docking Station. Please proceed as follows: Connect the SOMNOwatch™ plus to the Docking Station. Press the Marker Button Click the Transfer icon on the DOMINO light Panel. -
Page 39: Open A Recorded Measurement
Open a Recorded Measurement To open a recording, click on the Analysis symbol of the DOMINO light panel. The following window will open: Click on Name or Start to sort measurements alphabetically Processing Status or chronologically Saved measurements Search Options fig. - Page 40 If you open a measurement, which has not previously been analysed, the Preferences Window will open. Choose a matching Analysis Template or create one in the Analysis menu of the Global Settings: Activity Analysis fig. 6-18: Analysis Template “Activity Analysis” Sleep-Wake Analysis fig.
- Page 41 Tremor Analysis fig. 6-20: Analysis Template “Tremor” Please ensure that only one of the axes (x, y or z) is selected. Please do not select Magnitude. PLM/RLS Analysis fig. 6-21: Analysis Template “PLM/RLS” -41-...
- Page 42 Body Temperature fig. 6-22: Analysis Template “Temperature” fig. 6-23: Analysis Template “EDA” -42-...
- Page 43 Sleep Profile fig. 6-24: Analysis Template “Sleep Profile” -43-...
- Page 44 ECG Analysis fig. 6-25: Analysis Template “ECG-Analysis” Training/Rehab fig. 6-26: Analysis Template “Training/Rehab” -44-...
- Page 45 Flow/Snore fig. 6-27: Analysis Template “Flow/Snore” CPAP Control fig. 6-28: Analysis Template “CPAP ” -45-...
- Page 46 The measurement is automatically analysed according to the predefined parameters in the Global Preferences (see Chapter 7.3.4). The DOMINO light software marks analysed events in the Raw Data window by placing a coloured frames around each event. Parameter Indicates position in the Time Bar Raw Data Window Analysis...
-
Page 47: Analysis
6.5 Analysis 6.5.1 Define the Begin and the End of the measurement Set Start Marker: Right click on the Raw Data area where you wish the Recording to Begin → left click on “Define Start” Set End Marker: Right click in the Raw Data area where you wish the Recording to End → left click on “Define End”... -
Page 48: Sleep Wake Analysis
6.5.2.2 Sleep Wake Analysis Define TIB (=Time In Bed) and Day areas: a) Define TIB/Day areas manually: Mark a section in the Analysis Window by holding the left mouse button pressed. Right-click in the marked section and choose Define area as…. Type in TIB or Day as description and choose a colour for the mark. -
Page 49: Rasterviw
a) Automatic definition of TIB/Day areas: Activate the Light Analysis (Tools→Preferences→Analysis). The TIB areas will automatically be determined by the recorded data of the Light Sensor. The areas will be marked in blue colour. 6.5.2.3 Rasterviw If you want to depict the Raster View in your report, you can choose between three different displays. You can also add other parameters to the rasterview. - Page 50 In this menue the different channels can be choosen and removed via Drag&Drop or via using the „finger-icon“ (1). For the time basis of the Raster View, there are time intervals from 5 seconds up to 2 days available. In addition, a double plot can be displayed. -50-...
- Page 51 Through this disturbances of the circadian rhythm can be documented. If you want to depict the Raster View in your report, you can choose between three different displays. In case your manually modified Raster View shall be displayed within the report, this has to be saved as a sample.
-
Page 52: Plm/Rls Analysis
6.5.2.4 PLM/RLS Analysis One night recording: Define TIB (Time In Bed): The markers “Lights OFF” (patient in bed) and “Lights ON“ (patient out of bed) define the relevant analysis data. Set Lights OFF: Right click on the raw data area at the time the patient goes to bed (check body position, activity or marker) →... -
Page 53: Body Temperature
6.5.2.5 Body Temperature Define TIB (Time In Bed): The markers “Lights OFF” (patient in bed) and “Lights ON“ (patient out of bed) define the relevant analysis data. Set Lights OFF: Right click on the raw data area at the time the patient goes to bed (check body position, activity or marker) →... -
Page 54: Flow/Snore
6.5.2.6 Flow/Snore Define TIB (Time In Bed): The markers “Lights OFF” (patient in bed) and “Lights ON“ (patient out of bed) define the relevant analysis data. Set Lights OFF: Right click on the raw data area at the time the patient goes to bed (check body position, activity or marker) →... - Page 55 In order to obtain the Poincaré-Plot of the heart rate variability, one should open the corresponding window via going through “Tools” -> “Poincaré Plot”. -55-...
-
Page 56: Sleep Profile
6.5.2.8 Sleep Profile Define TIB (Time In Bed): The markers “Lights OFF” (patient in bed) and “Lights ON“ (patient out of bed) define the relevant analysis data. Set Lights OFF: Right click on the raw data area at the time the patient goes to bed (check body position, activity or marker) →... - Page 57 To edit the Sleep Stages, use the Keys on the keyboard that were assigned in the Keys menu in Global Preferences (see chapter 7.3.9). These keys or key combinations are used to edit the study in this mode. It is also possible to change these Keys while analysing a study in Tools →...
- Page 58 b) Advanced Sleep Edit Mode Select Edit Mode in the Mode menu. This edit mode allows editing the automatically determined Sleep Stages very quickly by defining a threshold for Wake in the Alpha+Beta FFT and for deep sleep in the Delta FFT. Scroll in the Raw Data Window to the transition from Wake to Sleep.
- Page 59 Select “Check threshold” to readjust the threshold value. The “Advanced Sleep Edit Mode” window appears. fig. 6-34: Readjust of the threshold value Now you can set the exact value in the “A+B FFT” channel by placing the cross-hair with a left mouse button click.
- Page 60 Select Check threshold to do an adjustment to the threshold. The window Advanced Sleep Edit Mode will be displayed. fig. 6-36: Readjust of the threshold value Now you can set the exact value in the Delta FFT channel by placing the cross-hair with a left mouse button click.
-
Page 61: Enter The Findings And The Diagnosis
6.6 Enter the Findings and the Diagnosis Select Patient Info in the Tools menu → left click on the tab sheet Diagnosis → enter the Findings and the Diagnosis in the corresponding text fields The Choose Finding and Choose Diagnosis buttons offer lists of selectable predefined findings and diagnosis. - Page 62 mean Activity in the selected area mean Activity in all areas defined as “school“ (in due consideration of the duration of the separate areas) mean Activity in all areas defined as “school“ (without consideration of the duration of the separate areas) ± standard deviation Total Activity in all defined areas (calculated based on an area with one hour length).
- Page 63 Choose the item „Activity profil“ within the „Select Report“ window. -63-...
-
Page 64: Sleep Wake Analysis
6.7.2 Sleep Wake Analysis a) Manual definition of TIB and Day areas: Select the following parts in the report selection: Click on the button View to display the selected report. The report shows information regarding to the marked Sleep and Wake Areas. Sleep Time Time in stage NONREM during TIB Wake Duration... - Page 65 Period of time between the “Lights off”- marker and the beginning of Latency the first NONREM stage WASO Time of Wake epochs during the TIB after sleep onset (Wake after sleep onset) MAI (Index) Number of vegetative arousals b) Automatic detection of TIB and Day areas: Select the following parts in the report selection: Click on the button View to display the selected report.
- Page 66 NAP number = Number of times the patient fall asleep during day. Additionally it is possible to get displayed information on sleep in a fixed 24 hour raster. In this case the analysis steps shown in chapter 6.5.2.2 are not necessary. Select the following parts in the report selection: Click on the button View to display the selected report.
- Page 67 SD = standard deviation A day by day Sleep Wake Profile can also be displayed.. Select Raster view in the Tools menu Select Analysis, the Sleep-Wake channel and a 1 day Time base. It is possible to document disturbances of the Circadian Rhythm. -67-...
- Page 68 6.7.3 Tremor Analysis Select the following parts in the report selection: Click on the button View to display the selected report. -68-...
-
Page 69: Plm/Rls Analysis
6.7.4 PLM/RLS Analysis Analysis of a single night: Select the following parts in the report selection: recording on both legs: Click on the button View to display the selected report. Please Note: Only events during TIB will be evaluated in the report. Definitions: Recorded Time Complete recording time. - Page 70 recording on both legs: Definitions: Leg Movements during TIB which do not meet the PLM criteria Isolated-LMs (Index) (index: per hour of sleep). PLMs (Index) Leg Movements during TIB which meet the PLM criteria. Body Position-LMs (Index) Leg Movements caused by changes of the Body Position during TIB. PLM distribution (bar graph): The index for the PLM distribution is shown in lying and upright body position.
- Page 71 Analysis of more than one night or Analysis of specific periods: Select the following parts in the report selection: recording on both legs: Click on the button View to display the selected report. -71-...
- Page 72 recording on both legs: -72-...
-
Page 73: Body Temperature
6.7.5 Body Temperature Select the following parts in the report selection: Click on the button View to display the selected report. Definitions: Recorded Time Complete recording time. Time in Bed (TIB) Period of time between the Lights off and Lights on markers. -73-... - Page 74 Definitions: Average Temp. (˚C) Average Body Temperature during TIB. Max. Temp. (˚C) Maximum Body Temperature during TIB. Min. Temp. (˚C) Minimum Body Temperature during TIB. − Temp Temp [ Gradient (˚C/h) Min. Temp -74-...
-
Page 75: Eda
6.7.6 Select the following parts in the report selection: Click on the button View to display the selected report. The determined values will be displayed as conductance values (unit: Siemens [S]) in a graph. The electrodermal activity is affected by the sympathetic nervous system e.g. emotional reactions. Thus it comes to a higher creation of sweat and this result in a change of the conductance value of the skin. -
Page 76: Sleep Profile
6.7.7 Sleep Profile Select the following parts in the report selection: Click on the button View to display the selected report. Definitions: Recorded Time Complete recording time. Time in Bed (TIB) Period of time between the Lights off and Lights on markers. -76-... - Page 77 Definitions: Total Sleep Time (TST) Period of time between the Lights off and Lights on markers (in h) excluding all the Wake stages. TotalSleep Time Sleep Efficiency TotalSleep Time Sustained sleep efficiency − (in %) SleepLaten cyStage Period of time between the Lights off marker and the beginning of Sleep Latency Stage 1 Sleep Stage 1 (minimum of 3 epochs in stage 1 required).
- Page 78 In the figure above the progression of delta frequency components during the recording is displayed. This diagram indicates the Sleep Fragmentation of a patient’s sleep caused by Microarousals. It shows how “Disturbed” or “Undisturbed” a patient’s sleep is. Disturbed: Sleep fragmentation mainly in the intervals 0-1 min and 1-5 min Undisturbed: Sleep fragmentation mainly in the intervals 10-30 min and >30 min...
- Page 79 Definitions: Percentage of individual Body Positions (Prone, Supine, Left, Right Sleep Time Fraction (%) and Upright) during TST. Time which the patient spent in each respective Body Position during Duration during sleep sleep. Time which the patient spent in the respective Body Position during Duration during REM REM sleep.
-
Page 80: Ecg Analysis
6.7.8 ECG Analysis Select the following parts in the report selection: Click on the button View to display the selected report. Distribution of the Heart Rate Values based on the complete recording time. -80-... - Page 81 Definitions: Number of Increases in the Heart Rate (index: per hour of Acc. (Index) recording). Dec. (Index) Number of Decreases in the Heart Rate. Arrhythmia (Index) Number of Arrhythmia occurring. Maximum HR (bpm) Maximum Heart Rate with indication of the moment of the event. Minimum HR (bpm) Minimum Heart Rate with indication of the moment of the event.
-
Page 82: Training/Rehab
6.7.9 Training/Rehab Select the following parts in the report selection: Click on the button View to display the selected report. It is possible to derive conclusions about the training effect, the training efficiency, exhaustion and reactions before stress, out of the relationship between the rising motor activity and the change of the heart frequency during physiological stress. -
Page 83: Flow/Snore
6.7.10 Flow/Snore Select the following parts at the report selection: Click on the button View to display the selected report. Definitions: Apnoea Number (Index) Number of Apnoea (index: per hour of recording). Hypopnoea Number (Index): Number of Hypopnoea. Apn. + Hyp. Number (Index=AHI): Number of Apnoea and Hypopnoea. - Page 84 Max. Apnoea Duration (s) Maximum duration of Apnoea. Max. Hypopnoea Duration (s) Maximum duration of Hypopnoea. Average Apnoea Dur. (s) Average duration of Apnoea. Average Hypopnoea Dur. (s) Average duration of Hypopnoea. Definitions: Percentage of time in a Single Body Position (Prone, Supine, Left, Sleep Time Fraction (%) Right and Upright).
- Page 85 Definitions: Number of Snore events in a single body position (Prone, Supine, Snore (Index) Left, Right and Upright) (index: per hour of recording). Absolute Snore (min) Total duration of Snore events in each respective Position. If the duration between two snore events is smaller than 10 seconds, the duration of the first event and the time lag will be counted as an Snore Episodes (min) episode.
-
Page 86: Cpap Control
6.7.11 CPAP Control Select the following parts at the report selection: Click on the button View to display the selected report. The graph displays the percentage of the adjusted pressure stage(s). Definitions: Average CPAP Average value of all recorded pressure values. -86-... -
Page 87: Domino Light Software
New releases of the DOMINO light Software are issued once or twice a year, as a result of our continued commitment to improving the system. These manuals are available free of charge for SOMNOmedics customers. The DOMINO light Software is intended for use exclusively with the SOMNOwatch™ plus. -
Page 88: Domino Light Panel
Before starting to use the Analysis Section of the software, it is necessary to activate it with a Registration Code. Please contact SOMNOmedics by fax, e-mail or telephone to obtain this. Please refer to chapter 7.3.2 for instructions on how to obtain and enter the Registration Code. -
Page 89: Global Preferences
7.3 Global Preferences Please note: Always use the button Save or Save and Exit to save changes made (e.g. entry of the registration code). 7.3.1 Selection of device type It is necessary to select the device type when changing settings. There are two types to select from: a) SOMNOwatch b) SOMNOwatch plus... -
Page 90: Menu - Folders
Following preferences can be Preferences will be imported: saved to a file. Computer-ID – phone SOMNOmedics support. Quote this number and you will be given the Registration Code to enter here. fig. 7-2: Global Preferences – Menu - Folders The default folder can be chosen from the Recordings Directory using the symbol. -
Page 91: Menu - Channels
Menu – Channels 7.3.3 In the Channels Menu the characteristics of the Raw Data Signal can be adjusted. Colour, Signal Scaling, Signal Direction and Channel Order can all be configured. The Channel Order can be changed by using the Drag & Drop function. Limit values for Auto scaling Invert... -
Page 92: Menu - Analysis
7.3.4 Menu - Analysis In this menu, all parameters of the built-in algorithms can be changed. It is also possible to set the display colour for each analysis trace and set the colour of the classification box for each event. See the areas marked with a red box in the figures below. -
Page 93: Sleep Wake Analysis
7.3.4.1 Sleep Wake Analysis The software determines periods of Sleep and Wake based on the motor activity. It is possilbe to configure the Activity Threshold a period is scored as Wake. It can be used for Sleep Wake estimation during a sleep episode or the detection of sleep episodes during the day (e.g. -
Page 94: Sleep Profile
7.3.4.2 Sleep Profile The one channel EEG gives the possibility to detect graphoelements in the EEG and therefore a classification of the sleep stages according to Rechtschaffen and Kales (Vertex Spike→ Stage 1; Spindles and K-Complex → Stage 2; Stage 3 and Stage 4 according to the percentage of slow waves). - Page 95 The value “Max. Non-REM Epochs Number within REM Periods” is needed for the detection of REM phases. If the period between two REM epochs does not exceed the set number of 5 Non-REM epochs, these epochs will be reclassified as REM (Note: Wake Non-REM). „Min.
- Page 96 fig. 7-8: Signal Setting Section The table shows the minimum and maximum values of the different parameters for all stages (Wake to Movement). To set parameters, please note the following: Delta: Proportion of Delta frequency in the epoch [%] Alpha+Beta: Proportion of Alpha and Beta frequency in the epoch in relation to the maximum value in the recording [%] AFV: The Average Frequency Value is the mean frequency of the EEG [Hz] in the epoch Spindle: number of spindles per epoch...
-
Page 97: Spindle And K-Complex Analysis
7.3.4.3 Spindle and K-Complex Analysis The spindle analysis is used to determine spindles and K-complexes in an EEG channel. fig. 7-9: Spindle Analysis 1) Min. Spindle [Hz] Minimum frequency of the EEG signal (to determine Spindle). 2) Max. Spindle [Hz] Maximum frequency of the EEG signal (to determine Spindle). - Page 98 12) tmax SS [s] Maximally duration of a peak-to-peak drop, in order to determine a K-complex. 13) Max. Amplitude [µV] If the amplitude of the EEG signal is higher than the entered value, no K-complex is recognized. 11 / 12 fig.
-
Page 99: Sleep Fft Analysis
7.3.4.4 Sleep FFT Analysis fig. 7-11: Sleep FFT Analysis The limits for the frequency bands can be changed: fig. 7-12: Frequency bands 1) Artefact Amplitude [µV] The maximum EEG Amplitude is determined. All values above this limit will be detected as artefact. 2) Sweat artefact A sweat artefact is detected if –... - Page 100 The sleep FFT analysis is also used to determine Microarousals (MA). There are two methods for determining Microarousals: a) MA from AFV - Detection of frequency increases in the EEG (cortical arousal), increase in AFV (Average Frequency Value) b) MA from Sigma – Detection of increase in Sigma frequency band Cortical Microarousal 1) Min.
-
Page 101: Activity Analysis
7.3.4.5 Activity Analysis It is possible to display periods of motor activity. The Timeframe and the Activity Threshold can be set individually. This allows the diagnosis of Attention Deficit Hyperactivity Disorder (ADHD) or to monitor rehabilitation progresses (e.g. stroke patient). fig. -
Page 102: Light Analysis
7.3.4.6 Light Analysis The Light Analysis is used for the automatic detection of TIB (Time In Bed) and Day areas (see chapter 6.7.2). fig. 7-15: Light Analysis TIB Threshold [lm] The recorded light values are compared with this threshold. If the recorded value is smaller or equal to the preset threshold the area will be defined as TIB. -
Page 103: Flow Analysis
7.3.4.7 Flow Analysis fig. 7-16: Flow Analysis 1) Analysis Window [s] Time period used by the analysis to determine the baseline. 2) Min. Signal Minimum value of the signal (in digit). An artefact will be detected as soon as the signal falls below this value. -
Page 104: Snore Analysis
9) % Snore time If the percentage of snoring, during an apnoea phase, exceeds this value, a hypopnoea will be detected. 10) Body position correlation [s] With this function the correlation of a flow event is checked with body position change. The adjustable delay gives the maximum time between a Flow event and a body position change. -
Page 105: Leg Movements (Lm) Analysis
7.3.4.9 Leg Movements (LM) Analysis The PLM/RLS Analysis detects periodic leg movements during sleep and restless legs during the day. Periodic leg movements can be the reason for disturbed sleep and require further diagnostic. This motor analysis can provide the diagnosis of Restless Legs together with the clinical symptoms. fig. - Page 106 7) Min. Signal The mean activity is calculated during a detected LM. If this value is higher than the value Min. Signal a LM will be scored. 8) Compensation Act. [%] The duration of LM detected in the internal activity channel of the SOMNOwatch plus (Magnitude) will be reduced by this value (elimination of post oscillations).
-
Page 107: Heart Rate Analysis
7.3.4.10 Heart Rate Analysis The one channel ECG allows the ECG pattern to be analysed. Arrhythmias, Accelerations, Deceleration and Asystolies are automatically detected. fig. 7-20: Heart Rate Analysis 1) Min. Duration [s] Minimal duration of a continuous period of Heart Rate increase or decrease. 2) Min. -
Page 108: Fft Analysis
7.3.4.11 FFT Analysis The FFT Analysis can be used for the detection of Tremor. The report shows Average Tremor Frequency and the Tremor Intensity during the observation period. The Analysis is used for the detection of Tremor (e.g. Parkinson Tremor), the monitoring of therapy or the adaption of drug giving. -
Page 109: Movement Analysis
7.3.4.12 HR-Movement Analysis The Heart Rate Analysis can be used together with the Activity Analysis to display e.g. the training status by calculating the ratio of Hear Frequency and Activity. fig. 7-23: HR-Movement Analysis The Analysis displays the Heart Frequency changes during motor Activity [bpm/mG]. Smoothing The detected curve is smoothed using this value. -
Page 110: Temperature Analysis
7.3.4.14 Temperature Analysis The Body Temperature Analysis displays the temperature curve during the night or the complete day and can provide indicators for disturbance of the circadian rhythm. fig. 7-25: Temperature Analysis This Parameter shows the Body Temperature between 34°C and 39°C. Min. -
Page 111: Eda-Analysis (Eda: Electro Dermal Activity)
7.3.4.16 EDA-Analysis (EDA: Electro Dermal Activity) The electro dermal Activity shows changes in the skin resistance which are triggered by the stress of the person. Short changes (e.g. emotional stress) and also fluctuations with long duration will be measured. fig. 7-28: EDA-Analysis The EDA analysis smoothes the raw data signal by averaging the value (every 250ms a new average value is formed). -
Page 112: Menu - Analysis Channels
7.3.5 Menu - Analysis Channels Within the Menu Analysis Channels the presentation of the analysis window can be formatted. The Channel Order can be changed by using the Drag & Drop function. Full Chart: Upon activating this option the respective curve will be displayed in full chart mode. -
Page 113: Menu - Raw Data Profiles
7.3.7 Menu - Raw Data Profiles In the Raw Data Profiles, the display window can be configured to your own requirements. A Raw Data Profile is the collection of channels which are predefined for a specific recording. Please note: You can set different time bases (display) for each profile (see red box in fig. 7-31) It is possible to change, delete or rename existing profiles. -
Page 114: Menu - Analysis Profiles
7.3.8 Menu - Analysis Profiles The Analysis Profiles Menu allows you to adapt the Analysis Display Screen to your needs. An analysis profile is the collection of analysis channels which can be predefined for different recordings and diagnosis protocols. For example: For a Sleep Stage Analysis, simply setup a profile to include the following Analysis channels: Sleep Profile Reliability, Sleep Profile, Average Frequency Value, Alpha + Beta FFT, Delta FFT, Sigma FFT, Spindle, Microarousal and Position. -
Page 115: Menu - Keys
7.3.9 Menu - Keys The Keys menu allows you set the keyboard keys to be used during manual editing. Define and add events: Within the Keys Menu, predefined events can be associated to the programmed keys. These defined keys are available in the Edit mode of the Raw Data display to edit, add or delete events. -
Page 116: Menu - Area Definition
7.3.11 Menu – Area Definition It is possible to define own area definitions in the Analysis window. Adding areas: Enter the name of the area in the field and click the button “Add Area”. marked Renaming areas: Please select an existing area from the list and click the button Edit Area. -
Page 117: Menu - Report
7.3.13 Menu – Report 7.3.13.1 Standard Report In the Reports Menu, it is possible to configure Standard Report Templates to your specific needs. You can set the contents, the format and the order of the report items. As many reports as are required can be created by clicking on the symbol A template may be renamed by clicking on the symbol... -
Page 118: User Defined Report
7.3.13.2 User defined Report Click on Symbol (1) to create a User defined Report. Type in the name for the report template and click on the symbol (2) on the right side. fig. 7-38: Create User Defined Report Now choose if the draft should be displayed in portrait or landscape format. At the top of the draft you will find the following symbols: fig. - Page 119 It is also possible to open the Standard Report (click the button ) to copy a desired placeholder. This placeholder can be pasted in the label by right click and selecting Paste. Functions in the Label Editor: Here the background-colour of the label can be selected. A certain type and seize of font can be selected.
- Page 120 Adds an Analysis Channel to the report, displayed over complete night or only during TIB. fig. 7-42: Analysis Channels selection Additional functions: full → short → only legend → without → Activates/Deactivates the timeline. The graphic can be rotated in pre-defined steps. Select if the analysis channel(s) are displayed showing the whole night, or only during TIB.
- Page 121 A new page can be added or an existing page can be deleted by right clicking on the Page tab. It is also possible to change the orientation of the page. fig. 7-43: Tab functions By Right clicking on an object, the following selection menu will appear: fig.
- Page 122 Creating Tables The function “Add table” provides the possibility to display analysis results in a table in the report. Tables can only be generated in the Custom Report. To start the Custom Report Designer, open the “Report” tab in the “Global Preferences” and then click the button “New Custom Template”. After defining a name for the new Custom Template, generate or edit the new custom report using the “Edit”...
- Page 123 After confirming with OK, define the position of the table inside the report by clicking on the start position where you want the table to appear. Editing of Text Fields In order to write into text fields, the corresponding text field just must be activated by selecting it with the mouse cursor.
- Page 124 Now, select the Preview Button and click on the item “Use as new custom template” (upper right of menu bar) to transfer the selected items to the Custom Template. After transferring the Standard Report items, the generated Custom Template can be modified and edited.
-
Page 125: Analysis
7.4 Analysis 7.4.1 The quick start toolbar With the quick start toolbar, standard functions of the software can be accessed with only one click. fig. 7-45: The quick start toolbar adjust quick start toolbar, click command button select fig. 7-46: Customising the toolbar With the command button a function from the quick start toolbar can be removed. -
Page 126: Setting Analysis And Channels
Here the time base for the display can be chosen manually. Here the time base can be set for the display of predefined times (1s, 2s, 5s, 10s, 1s .. 30m 30s, 1 min., 3 min., 5 min., …). With this button you can Auto scroll. This advances in either direction in Auto scroll adjustable speeds. -
Page 127: Functions Of The Analysis Pop-Up Window
7.4.2.1 Functions of the Analysis Pop-up Window To open the pop-up window use the right mouse button and click on the Analysis Window. fig. 7-49: Selection in Analysis Window (1) Save as saves the current analysis channel layout as a new analysis profile. Enter a name for the analysis profile and click “OK”. - Page 128 (3) Selecting None, none of the analysis channels will be displayed. (4) Selecting All, all of the analysis channels will be displayed. (5) Add Raw Data will add a selected raw data channel to the analysis window. (6) Averaging: Recurring signals can be selected and averaged (see chapter 7.4.8). (7) Print will print the current analysis display window.
-
Page 129: Function Of The Raw Data Pop-Up Window
7.4.2.2 Function of the Raw Data Pop-up Window To open the pop-up window use the right mouse button and click on the Raw Data Window. fig. 7-51: Pop-up Window Raw Data (1) Save as saves the current raw data channel layout as a new raw data profile Enter a name for the analysis profile and click “OK”. - Page 130 (3) None or All will remove either all analysis channels or none of them. (4) Add Anaylsis Channel will add a selected analysis channel to the raw data window. (5) Set marker will open the Markers window (see chapter 7.4.4). (6) Set Info-marker allows you to add markers with several text lines (free text comments).
-
Page 131: Layouts For Data Display In Analysis Mode
7.4.3 Layouts for Data Display in Analysis Mode Several different display layouts are selectable for efficient data processing by clicking on tab View: A) View ➝ Analysis displays the Analysis curves only. B) View ➝ Raw Data displays the Raw Data curves only. C) View ➝... -
Page 132: Creating And Editing Samples
7.4.5 Creating and Editing Samples It is possible to select and save Interesting Events from both the Raw Data and the Analysis Data. These Samples will be saved and can be added to the Reports. Samples are automatically stored in the Optional Data Base. -
Page 133: Creating, Deleting And Editing User Areas
7.4.6 Creating, Deleting and Editing User areas With User areas you can define special parts in a recording. In the report these areas can be considered as separate parts of Activity Analysis, Sleep Wake Analysis and the PLM/RLS Analysis. Define a User area: Highlight a section in the Analysis or Raw Data Window by holding the left mouse button. -
Page 134: Averaging
7.4.8 Averaging Certain recurring signals may not be clearly identified because they are too small. However, by Averaging the signal a number of times, it is possible to improve the quality of the signal. First, select Averaging in the Raw Data pop-up window (right click on the raw data). The following window appears: Time data before and after cursor Cursor position... -
Page 135: Manual Editing
7.5 Manual Editing When a recording is opened for the first time, it is automatically analysed according to the predefined parameters in the Global Preferences (see Chapter 7.3.4). The DOMINO light software marks analysed events in the Raw Data window by placing a coloured frame around each event. -
Page 136: Quick Edit Mode
Jump to the beginning Keyboard layout of the recording Repeat Mode Jump to the end Quick Edit Mode of the recording Page Backward Page Forward Half Epoch Forward Reduce Time Base Increase Time Base Half Epoch Backward fig. 7-59: Keyboard Layout for Analysis 7.5.1.2 Quick Edit Mode The Quick Edit Mode allows an event to be marked without using the keyboard. -
Page 137: Define A Global Artefact
7.5.1.5 Define a Global Artefact Choose one of the four Edit Modes in the Mode menu. Mark the significant area in the Analyis Window by holding the left mouse button pressed. Right-click on the marked area and choose Define Artefact. Now you can select if the area is a global artefact (all analysis) or an artefact at a single analysis channel. -
Page 138: Reports
Reports There are Two ways to generate a report in the DOMINO light software: 1. Using the DOMINO light Report Generator (Standard or User Defined Report). 2. Exporting the entire result list to MS Excel. 7.6.1 Reports using the DOMINO light Report Generator Click on Report…... -
Page 139: Form Letters
7.7 Form Letters The DOMINO light Software incorporates the facility to generate Form Letters. These Form Letters can be used to send Diagnostic information to Referring Physicians, Healthcare Workers, Insurance Companies and the Patients. 7.7.1 Creating a Form Letter To create a new Form Letter, first open the required Patients Study. -
Page 140: Opening A Form Letter
7.7.2 Opening a Form Letter To create a new Form Letter, first open the required Patients Study. Now select Open Form Letter from the Reports menu. Double-click on the required Form Letter and it will be opened in MS Word automatically. -
Page 141: Data Exchange
7.8 Data Exchange 7.8.1 Data Export as Picture, in RIFF or ASCII Format Analysis and Raw data can be exported As a Picture (BMP or JPEG format) or As Data (RIFF or ASCII format) via the menu File → Export Analyses Data or Export Raw Data. 7.8.2 EDF+ Export EDF+ Export and EDF Import make it possible to exchange data between different Sleep Labs... - Page 142 The following window will open: = There is no EDF+ name assigned to the channel. = There is an EDF+ name assigned to the channel Save As Template from the translation table. Delete Template = An EDF+ name was manually assigned to the channel.
- Page 143 A click on the Translate Table button opens the following window: fig. 7-68: EDF+ Translation Table Click on the button Add to add a new channel to the translation table. To enter the EDF+ Label or the Transducer Type it is necessary to double-click in one of the fields next to the Channel name.
-
Page 144: Archiving
7.9 Archiving SOMNOmedics recommends archiving all successfully analysed recordings on a regular basis. We also recommend deleting the records from your hard drive once the data is archived. This process should be done regularly to ensure that there is sufficient storage space on the hard drive and that the data is protected from any damage. - Page 145 The window will display all marked recordings which were added to the archives. Check that the capacity of the disk (3) (see fig. 7-71) has not been exceeded. Finally, click on the button Burn CD to start burning. Clicking on the Prepare Data button, all marked recordings will be saved to the folder which was defined as the Archive Folder in the Global Preferences (see chapter 7.3.2).
-
Page 146: Archiving Database
Archives, Form Letters and SOMNODB (Default Location: C:\SOMNOmedics\Somnowatch). Now select the files and copy them to a local directory (for example, C:\Backup\...). Save this directory to a CD using the CD burning programme that was supplied with your CD drive. -
Page 147: Patient Database (Option)
In order to use the Database, a registration code is required. Please contact SOMNOmedics Support to obtain this code. Please contact SOMNOmedics by fax, e-mail or telephone to obtain this. Please refer to fig. 7-72 for instructions on how to obtain and enter the Registration Code. -
Page 148: Search Function
7.10.2 Search Function The Search window will immediately open after starting the data base function. It can also be opened by selecting Search in the main menu. The following window appears: fig. 7-73: search in database You can search for patients or records using different criteria, e.g. name. When searching for recordings you can also search by means of results (1). -
Page 149: Menu - History
7.10.3 Menu – History Here you can create a PDF Click those buttons document, consisting of: to delete a Patient or patient picture a Recording from the results of questionnairs Click here to edit database. notes the Patients Data Patient data and corresponding measurements Add additional information to... -
Page 150: Menu - Recording
7.10.4 Menu – Recording This menu will display the entries of Anamnese, Findings, Diagnosis and Comment. Results can be displayed in the list on the right side (see green box in fig. 7-75). Only results that are selected in the Default Template will be displayed. Select Result Templates in the Tools menu to create or define a Default Template. - Page 151 fig. 7-75: Measuring data The report selection can be opened by selecting Report… in the main menu. It is possible to select pre-defined report templates (see chapter 7.3.13.1) or only single reports. The order can be changed by Drag&Drop and it is possible to add page breaks. Display the report by clicking the View button.
-
Page 152: Menu - Summary Picture
7.10.5 Menu – Summary Picture fig. 7-76: Menu - Summary Picture This Menu shows the Summary Graphics from the Patients’ Analyses Curves. -152-... -
Page 153: Trend Function
7.10.6 Trend Function If two or more recordings of a patient are saved in the data base it is possible to get displayed a Trend of every analysis result. Switch to the tab History or Recording and select Results from the Tools menu. fig. -
Page 154: Compare Sleep Stages
7.10.7 Compare Sleep Stages If two or more recordings of a patient are saved in the data base, including the hypnogram, it is possible to display a sleep stage comparison. Switch to the tab History or Recording and select Results from the Tools menu. Select Compare Sleep Stages…... -
Page 155: Troubleshooting
Possible Reason What to do? Analysis Unable to start Registration code Contact SOMNOmedics Support and request the Analysis. not entered. registration code. Enter the registration code into the Global Preferences in the Folders menu. After entering the code, click on the Save and Exit button. -
Page 156: Maintenance Of Somnowatch™ Plus
9 Maintenance of SOMNOwatch™ plus 9.1 Cleaning and disinfection Regularly clean the device to ensure trouble free operation. Cleaning the device: Wipe the case using only mild detergents. DO NOT use a wet or fluffy cloth. Other disinfectants, approved by DGHM, may be used after testing that they do not damage the surface of the device. -
Page 157: Use And Maintenance Of The Rechargeable Battery (Internal)
External Adapter of Wipe disinfection: After use Remove adhesives if Temperature Probe For example: necessary. Follow manufacturer’s instructions! Terralin Liquid Ready to use 5min Mikrozid AF Cloth Ready to use 5 min EDA Sensor Wipe disinfection: After use Remove adhesives if For example: necessary. -
Page 158: Service
10 Service 10.1 Technical specification Channels Name Measuring Frequency Accuracy Range Range 6 internal DC – 10Hz 3x motor Aktivity ±6g (x,y &z direction) Body Position right, left, supine, prone, upright 0 - ∞ not linear Ambient Light Marker Button 0,1Hz –... -
Page 159: Lifetime
The device is not working correctly (poor measurements) Components are loose or fit poorly Connectors are damaged (crushed or cut cables) Please contact your local distributor for a fast response or contact SOMNOmedics for a fast and efficient response. Please see chapter 10.8. 10.4 Storage and Transport Keep the SOMNOwatch™... -
Page 160: Accessories And Spare Parts
10.7 Accessories and Spare Parts Please request our latest catalogue from your local Distributor or contact SOMNOmedics. resp. Actigraphy both legs both legs Screening (ext. Acti) (ext. EMG) Sensors, Accessories Part no. SOWP200 SOWP210 SOWP211 SOWP212 SOWP220 SOWP230 SOWP240 ●... -
Page 161: Contact
You can send us important information quickly by fax: +49 (0) 9 31 / 35 90 94 49 We also provide service and support via e-mail: service@somnomedics.de With our Service-Login you have free of charge access to our latest software-updates: www.somnomedics.de... -
Page 162: Notes
10.9 Notes -162-...
Need help?
Do you have a question about the SOMNOwatch plus and is the answer not in the manual?
Questions and answers