
Related Manuals for LP Technologies LPT-6000


Summary of Contents for LP Technologies LPT-6000
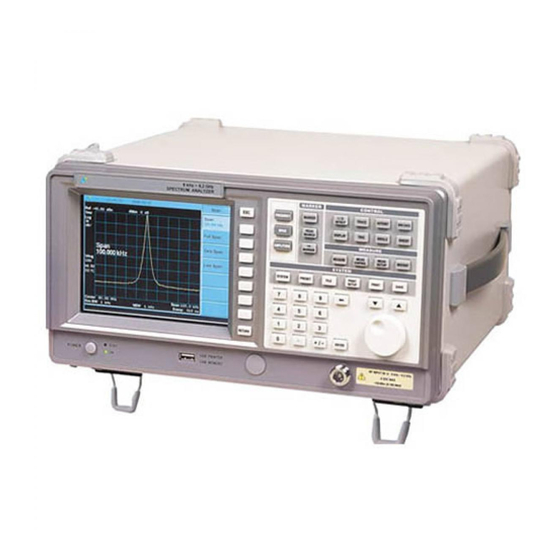
- Page 1 99 Washington Street Melrose, MA 02176 Phone 781-665-1400 Toll Free 1-800-517-8431 Visit us at www.TestEquipmentDepot.com LPT-6000 LPT-6000 9 kHz -6.2 GHz Digitally Synthesized RF Spectrum Analyzer LP Technologies, Inc.
-
Page 2: Table Of Contents
2-2. Power Requirements ..................10 2-3. Fuse Check .....................11 2-4. Power Cable ....................11 2-5. Environmental Conditions ................11 2-6. Turning ON the LPT-6000 ................12 Chapter 3. Starting ..............13 3-1.Front Panel Overview ..................14 3-2. Rear Panel Overview ..................17 3-3. Display Overview ...................18 3-4. - Page 3 4-9. BW/Avg ......................29 4-10. Trig .......................29 4-11. Display ......................30 4-12. Sweep ......................31 4-13. Measure ......................31 4-14. Measure Control ..................32 4-15. Measure Setup ....................32 4-16. System ......................33 4-17. File .......................34 4-18. File ( Save ) ....................35 4-19. File ( Load ) ....................36 4-20.
- Page 4 5-12. Preset......................57 5-13. Print ......................59 5-14. Print Setup ....................59 5-15. Return ......................60 5-16. Peak Search ....................60 5-17. Single Sweep ....................61 5-18. SPAN ......................61 5-19. Sweep ......................62 5-20. System ......................62 5-21. Trig .......................65 5-22. Trace ......................66 Chapter 6. Options ..............68 6-1.
-
Page 5: Chapter 1. Product Specifications
Product specifications In this Chapter, we will review the LPT-6000 Spectrum Analyzer’s specifications pg. 5... - Page 6 Chapter . Product Specifications 1-1. Product Specifications Frequency ► Range : 9 kHz to 6.2 GHz ► Resolution : minimum 1 Hz ► Span Range : 100 Hz / div to 300 MHz / div Selection of 1,2,5 steps (automatic), ZERO Span, FULL Span (9 kHz to 6.2 GHz) ►...
- Page 7 ► Second Harmonic Distortion : ≤−60 dBc, −40 dBm input ► Intermodulation Distortion : ≤−70 dBc, −40 dBm input ► Residual Spurious : ≤−85 dBm (Input terminated, 0 dB attenuation) ► Other Input Spurious : ≤−60 dBc, −30 dBm input ►...
- Page 8 Standard Frequency (10 MHz, Ref.) ► Temperature Stability : ±0.5 ppm ► Aging : ±0.5 ppm / Year ► Connector : BNC female ► Input Level : −5 dBm to +15 dBm ► Output Level : 10 MHz, +8 dBm nominal Interface ►...
-
Page 9: Chapter 2. Preparation For Use
Preparation for Use In this Chapter, we will review the following: • Initial inspection • Power requirements • Fuse check • Power cable • Environmental conditions • Turning ON the LPT-6000 pg. 9... -
Page 10: Initial Inspection
LPT 3000 Spectrum Analyzer is complete. Table 2-1 (below) shows all accessories offered with the LPT-6000 Spectrum Analyzer. Please contact LP Technologies Customer Support for any damaged parts, missing items or any other issue that you may need assistance with. -
Page 11: Fuse Check
Input Voltage 220 - 240 VAC ( 50 - 60 Hz ) Power Consumption Less than 80W When Using 2-3. Fuse Check When there is no spare fuse offered along with the device, the fuse to change should A fuse should be established in the fuse holder located in the upper part of the power switch on the back board. -
Page 12: Turning On The Lpt-6000
2-6. Turning on Power Please connect the power cord to the back panel of the LPT-6000 Spectrum Analyzer, before use, and then press the “On” button on the front panel. Allow the unit to warm up for approximately 10 minutes before operating. -
Page 13: Chapter 3. Starting
Getting started In this Chapter, we will review the following: • Front panel overview • Rear panel overview • Display overview • Menu and soft key overview • Measurement methods • Summary of measurements pg. 13... -
Page 14: 3-1.Front Panel Overview
Chapter 3. Starting 3-1. Front Panel Overview [Figure 3-1] Front panel 1. 6.4″ TFT-LCD. Displays the wave type, parameter set-up, indicated value, and menu key label. 2. Unlabeled soft keys next to the screen. Allow the user to perform several different functions using the menu displayed on the LCD screen. - Page 15 Controls markers, reads frequency and amplitude on the trace and automatically detects the signal with the highest amplitude. MARKER key activates the marker function. PEAK SEARCH key activates the peak search functions. MARKER → Sets the marker value as a specific parameter. 5.
- Page 16 PRINT key immediately sends printing data to a printer. 8. The power button turns ON/OFF the LPT-6000 Spectrum Analyzer. The Green light indicates the unit is ON and the Red light indicates it is in a STANDBY mode. The main power switch on the back of the unit must be ON to operate the unit. When the unit is ON, press and hold the POWER button for 3 seconds to turn it OFF.
-
Page 17: Rear Panel Overview
3-2. Rear Panel Overview [Figure 3-2] Outline of the Function of a Rear Panel 1. Ventilation fan is installed to discharge heat generated inside equipment. 2. External trigger input connector 3. Ethernet connection interface 4. RS-232C connection interface 5. AC main power switch (including fuse) 6. -
Page 18: Display Overview
9. Printer connection AC power switch (including a fuse) 3-3. Display Overview This is a screen shot of the actual LPT-6000 display. A description of each item listed is provided below. ③ ④ ⑤ ⑥ ⑨ ⑦ ⑧ ② ①... - Page 19 Item Explanation Function Key Screen title DISPLAY >> Title >> Change Title Time and date SYSTEM >> Time/Data Attenuation AMPLITUDE >> Attenuation Marker frequency Marker Marker amplitude Marker Subject to change according to the key Menu title selection Subject to change according to the key Menu selection Frequency span or...
-
Page 20: Menu And Softkey Overview
There are several keys labeled (FREQUENCY, SYSTEM and MARKER…etc) on the front panel of the LPT-6000 Spectrum Analyzer designed to execute specific different functions. Pressing a front panel key accesses a soft key menu that is located along the right side of LCD display. -
Page 21: Measurement Methods
Factory Preset. 3. Press I/O DETECT >> Ref Out (On) to turn on the 80 MHz standard signal generated inside the LPT-6000 Spectrum Analyzer. 4. Please set the frequency by pressing the FREQUENCY key. The Frequency softkey menu is now activated on the right side of the LCD and the Center Frequency will be displayed on the screen. -
Page 22: Summary Of Measurements
The figure 3-4 fully shows the relationship between the Central Frequency and Reference Fevel. The box in the figure shows a display of the analyzer. Changing of the Center Frequency changes the location of horizontal line on the display. Changing the Reference level changes the vertical position of the signal on the display. - Page 23 4. Set a Span Frequency to 500 kHz 5. The 80 MHz standard signal of the inside of the analyzer is about -40 dBm, so using the scroll knob, step keys or the numeric keypad, adjust reference level to -30 dBm. 6.
-
Page 24: Chapter 4. Configuration Of A Menu
Menu structure In this Chapter, we will review the following: • Menu Functions • Menu Structures pg. 24... -
Page 25: Frequency
Chapter 4. Menu Structure 4-1. Frequency 4-2. Span pg. 25... -
Page 26: Amplitude
4-3. Amplitude 4-4. Marker pg. 26... -
Page 27: Peak Search
4-5. Peak Search 4-6. Marker → pg. 27... -
Page 28: I/O Mode
4-7. I/O DETECT 4-8. Trace pg. 28... -
Page 29: Bw/Avg
4-9. BW/Avg 4-10. Trig pg. 29... -
Page 30: Display
4-11. Display pg. 30 Test Equipment Depot - 800.517.8431 - 99 Washington Street Melrose, MA 02176 TestEquipmentDepot.com... -
Page 31: Sweep
4-12. Sweep 4-13. Measure pg. 31... -
Page 32: Measure Control
4-14. Measure Control 4-15. Measure Setup a. Channel Power b. Occupied BW c. ACP pg. 32... -
Page 33: System
4-16. System pg. 33... -
Page 34: File
4-17. File pg. 34... -
Page 35: File ( Save )
4-18. File ( Save ) pg. 35... -
Page 36: File ( Load )
4-19. File ( Load ) 4-20. File ( Delete ) pg. 36... -
Page 37: File ( Copy )
4-21. File ( Copy ) 4-22. File ( Rename ) pg. 37... -
Page 38: File ( Create Dir )
4-23. File ( Create Dir ) 4-24. Print Setup pg. 38... -
Page 39: Chapter 5. Explanation Of A Front Board Key
Key descriptions In this Chapter, we will review the following: • Key descriptions • Menu and soft menu overview pg. 39... -
Page 40: Amplitude
Chapter . Explanation of Keys on the Front Panel 5-1. AMPLITUDE The amplitude key allows the user to activate amplitude related functions such as changing reference level, input attenuation, vertical scale, reference level offset, amplitude units and pre Ref Level ■... -
Page 41: Bw/Avg
Ref Level Offset ■ It adds the offset value to the currently indicated reference level. The reference level offset value can be changed only by using the numeric keypad. Changing the Reference Level Offset value does not change the trace or the input attenuation value. - Page 42 BW/AVG >> Res BW Video BW Auto Man ■ You can change the analyzer post-detection filter from 10 Hz to 3 MHz in a 1. 3. 10 sequence by using the scroll knob or the step keys. Decreasing the Video Bandwidth increases the Sweep time in order to maintain the amplitude calibration.
-
Page 43: Display
will be indicated on the left of display LCD. BW/AVG >> Avg Type >> Video ▪ Pwr After taking the average by converting data in the current trace memory, to a linear power level, then convert it again to a log scale, and then display it. When the average type is selected, PAvg will be indicated on the left of display LCD. -
Page 44: File
Title ■ It allows the user to name or re-name titles on the display. ▪ Change Title It enables you to write a title on a title indication line on the upper part of a display. If you press Change Title, the Alpha Editor menu including usable letters and signs will appear. - Page 45 2. Pleases select a format you want in a Format conversation box 3. If you intend to change a file name to save, please change the name by using a name menu key. 4. Please press a save now menu key after determining a location to save. When changing a directory to save, please change the location to save by using a step key and a dir select menu key.
-
Page 46: Frequency
▪ Trace Trace can be loaded along with the analyzer state when saved. If you load Trace, it will be in View mode. If you load Trace, it will go to Trace 1 except for Trace All returning to a location of the state that each trace is saved. Trace + State type only can be loaded. - Page 47 knob and numeric key pad. If you press any number among 0 ~ 9 on a number key pad, a unit menu will appear. FREQUENCY >> Start Freq Stop Freq ■ It sets the Stop Frequency. The left and right of the lattice conform to the start and stop frequencies.
-
Page 48: I/O Mode
the sweep is over. Signal Track function gets inactivated in a zero span. FREQUENCY >> Signal Track 5-6. I/O DETECT 10 MHz ■ It selects the use of the 10 MHz standard signal of the analyzer. When INT(Internal) is selected, the spectrum analyzer uses the standard signal of the inside of the analyzer, and outputs the 10 MHz standard signal through the port on the back panel. -
Page 49: Marker
display. The detection of a sample is used for indicating noise or a signal similar to noise. The inspecting signal level on the current display point is saved on a trace memory. ▪ Normal When selected, the Norm is shown up on the upper part of the left of the display. - Page 50 Select Marker 1 2 3 4 ■ Select one marker among 4 markers. Then, a marker already on, is activated when selected. When the marker is designated to a different trace while it is already on, the marker will be inactivated on trace concerned when selected. MARKER >>...
- Page 51 Span Pair Span Center ■ It converts to a mode that allows the two markers can be independently adjusted. If you press Span pair, there is a conversion between a span and the center marker. The reference marker number is indicated on the marker as R, (for instance, 1R) and Delta marker is indicated as a marker number.
-
Page 52: Marker
Marker Table On Off ■ It shows a marker table on the display. The information includes marker number, trace number, X axis value, and the amplitude. MARKER >> Marker Table Marker All Off ■ It turns off all markers. Also, it deletes the marker indication. MARKER >>... -
Page 53: Meas Control
Mkr → Stop ■ It sets the marker frequency as the stop frequency. On delta marker mode, Mkr → Stop sets the stop frequency as the marker delta value. Mkr → Stop cannot be used when it is on zero span. MARKER →... -
Page 54: Meas Setup
Measure Cont Single ■ Measure(Single) indicates the measurement result through one-time measurement sweep. Measure(Cont) successively performs measurement, and shows the result by every measurement sweep. MEAS CONTROL >> Measure Pause ■ It temporarily stops measurement. If you press Pause, it makes conversion between the temporary pause of measurement and resume. - Page 55 ▪ Ch Integ BW It designates the scope used in calculating the power on the center channel. MEAS SETUP >> Ch Integ BW ▪ Offset BW It designates the scope used in calculating the adjacent channel power. MEAS SETUP >> Offset >> Offset BW ▪...
-
Page 56: Measure
In order to designate the average number, please press Avg Number (On). The average value will appear when each sweep is over. Avg Number (Off) inactivates the average measurement. MEAS SETUP >> Avg Number ▪ OBW span It sets the span of the analyzer on the occupied bandwidth measurement. MEAS SETUP >>... -
Page 57: Preset
Channel Power ■ It calculates power and power spectrum density on a channel bandwidth designated by a user. A marker on the display indicates the end of the channel bandwidth. The marker selects Channel Power, and can be established as a Meas Setup menu. - Page 58 Start Frequency 0 Hz Stop Frequency 3.0 GHz CF Step 10% of a span Detect Normal Display Line -25 dBm, display turns off. Frequency Offset 0 Hz Log Scale 10 dB per sector Reference Level 0 dBm Reference Level Offset 0 dB Marker Resolution Bandwidth...
-
Page 59: Print
5-13. Print Please press the Print key if you want to print a copy of screen using a recommended printer. The screen will remain temporarily suspended until the data transmission is completed.(there is no more sweep proceeded.) 5-14. Print Setup It defines a printer, and selects a printer option. -
Page 60: Return
5-15. Return It returns to the previous menu 5-16. Peak Search It automatically places a marker on the highest amplitude signal of the trace and displays the marker’s amplitude and frequency. If there is no peak, the marker will not move. If there is no marker indicated, marker 1 will appear. -
Page 61: Single Sweep
tracer point and the lowest tracer point (or when the span is 0), and the amplitude. PEAK SEARCH >> PK-PK Search Continuous Pk On Off ■ When it is ON, the marker is located on the highest level of trace, and when the sweep is over, it successively detects the highest level, and locates the marker. -
Page 62: Sweep
It changes the frequency span as 0. SPAN >> Zero Span Last Span ■ It changes the frequency span of the analyzer to the previous span. SPAN >> Last Span 5-19. Sweep Accesses the sweep time menu and accesses the sweep-time softkey functions. Sweep Time Auto Man ■... - Page 63 the function of turning on power is established as Preset, the state of the analyzer becomes the same of pressing Preset while the analyzer is turned on. When the function of turning on power is established as Last, the state of the analyzer will be restored to the previous state where the power was still on.
- Page 64 numeric keypad, than press Enter. The effective time values ( HH ) are 00 ~ 23. The effective MM and SS values are 00 ~ 59. SYSTEM >> Time/Date >> Set Time ▪ Set Date It sets a date. Please enter a date in YYYYMMDD format by using the numeric keypad, than press Enter.
-
Page 65: Trig
Program Update ■ LPT-6000 offers convenient ways to update firmware. Copy firmware update file downloaded from a corporate website on a USB flash memory. Equip the USB flash memory to the front USB port, and press a menu key concerned. Then you will see a file list, and then press an update menu key while placing a file selection bar on an update file. -
Page 66: Trace
Line ■ It is synchronized with AC power frequency, it will start sweep. Line trigger is conveniently used when observing waves related to power. TRIG >> Line External Pos Neg ■ It is synchronized with external trigger source, thus, it will start sweep. The sweep starts from the ascending/descending angle of the signal wave form inputted on EXT TRIG input connector of the back panel. - Page 67 TRACE >> Clear Write Max Hold ■ The Max Hold function displays and continuously updates the trace to display the highest peak amplitude of signal level. TRACE >> Max Hold Min Hold ■ The Min Hold function displays and continuously updates the trace to display the lowest amplitude of signal level.
-
Page 68: Chapter 6. Options
Options In this Chapter, we will review the LPT-6000 Spectrum Analyzer’s additional options pg. 68... -
Page 69: Specifications
Chapter 6. Options 6-1. Specifications ► Opt-1 : GPIB interface IEEE 488 Bus ► Opt-2 : ETHERNET interface ; for Internet Remote Control ► Opt-3 : SOFT CARRYING CASE ► Opt-4 : General KIT SET SMA-N adapter × 2 10 dB attenuator × 1, 20dB attenuator × 1 RF cable (SMA-SMA, RD316, 300 mm) ×... - Page 70 pg. 70 Test Equipment Depot - 800.517.8431 - 99 Washington Street Melrose, MA 02176 TestEquipmentDepot.com...
Need help?
Do you have a question about the LPT-6000 and is the answer not in the manual?
Questions and answers