
Related Manuals for LP Technologies LPT-3000


Summary of Contents for LP Technologies LPT-3000
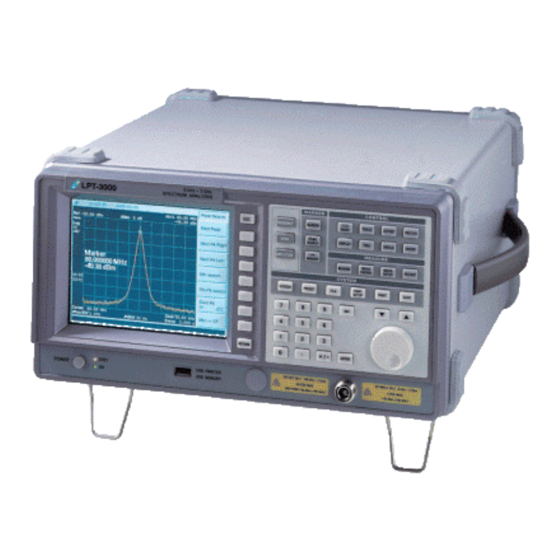
- Page 1 LPT-3000 9 kHz -3.0 GHz Digitally Synthesized RF Spectrum Analyzer 99 Washington Street Melrose, MA 02176 Phone 781-665-1400 Toll Free 1-800-517-8431 Visit us at www.TestEquipmentDepot.com Page | 1...
-
Page 2: Table Of Contents
Chapter 1. Product Specifications ..........5 1-1. Product Specifications ....................6 Chapter 2. Preparation for Use ............. 9 2-1. Initial Inspection ......................10 2-2. Power Requirements ....................10 2-3. Fuse Check......................... 11 2-4. Power Cable ......................11 2-5. Environmental Conditions ..................11 2-6. - Page 3 4-5. Peak Search ........................27 4-6. Marker → ........................27 4-7. I/O Mode ........................28 4-8. Trace ...........................28 4-9. BW/Avg ........................29 4-10. Trig ...........................29 4-11. Display ........................30 4-12. Sweep ........................31 4-13. Measure ........................31 4-14. Measure Control ......................32 4-15. Measure Setup ......................32 4-16. System ........................33 4-17.
- Page 4 5-3. Display ........................43 5-4. File ..........................44 5-5. FREQUENCY ....................... 46 5-6. I/O Mode ........................47 5-7. Marker ........................49 5-8. Marker → ........................51 5-9. Meas Control ......................53 5-10. Meas Setup......................54 5-11. MEASURE ........................ 56 5-12. Preset ........................57 5-13.
-
Page 5: Chapter 1. Product Specifications
Product specifications In this chapter we will review the LPT-3000 Spectrum Analyzer’s specifications Page | 5... -
Page 6: Product Specifications
Chapter . Product Specifications 1-1. Product Specifications Frequency ► Range : 9 kHz to 3.0 GHz ► Resolution : minimum 1 Hz ► Span Range : 100 Hz / div to 300 MHz / div Selection of 1,2,5 steps (automatic), ZERO Span, FULL Span (9 kHz to 3.0 GHz) ►... - Page 7 ► Second Harmonic Distortion : ≤−60 dBc, −40 dBm input ► Intermodulation Distortion : ≤−70 dBc, −40 dBm input ► Residual Spurious : ≤−85 dBm (Input terminated, 0 dB attenuation) ► Other Input Spurious : ≤−60 dBc, −30 dBm input ►...
- Page 8 Standard Frequency (10 MHz, Ref.) ► Temperature Stability : ±0.5 ppm ► Aging : ±0.5 ppm / Year ► Connector : BNC female ► Input Level : −5 dBm to +15 dBm ► Output Level : 10 MHz, +8 dBm nominal Interface ►...
-
Page 9: Chapter 2. Preparation For Use
Preparation for Use In this chapter we will review the following: Initial inspection Power requirements Fuse check Power cable Environmental conditions Turning ON the LPT-3000 Page | 9... -
Page 10: Initial Inspection
LPT 3000 Spectrum Analyzer is complete. Table 2-1 (below) shows all accessories offered with the LPT-3000 Spectrum Analyzer. Please contact LP Technologies Customer Support for any damaged parts, missing items, or any other issue that you may need assistance with. -
Page 11: Fuse Check
2-5. Environmental Conditions The LPT-3000 Spectrum Analyzer will operate normally between the temperatures of 0 ℃ and 40 ℃. However, for best performance, it is important to avoid exposing the unit to conditions involving severe vibration, high moisture, direct sun rays, or areas where the source voltage changes constantly. -
Page 12: Turning On The Lpt-6000
2-6. Turning on Power Please connect the power cord to the back panel of the LPT-3000 Spectrum Analyzer before use, and then press the “On” button on the front panel. Allow the unit to warm up for approximately 20 minutes before operating. -
Page 13: Chapter 3. Starting
Getting started In this chapter we will review the following: Front panel overview Rear panel overview Display overview Menu and soft key overview Measurement methods Summary of measurements Page | 13... -
Page 14: 3-1.Front Panel Overview
Chapter 3. Starting 3-1. Front Panel Overview LPT-3000 [Figure 3-1] Front panel 1. 6.4″ TFT-LCD. Displays the wave type, parameter set-up, indicated value, and menu key label. 2. Unlabeled soft keys next to the screen. Allows the user to perform several different functions using the menu displayed on the LCD screen. - Page 15 The MARKER key activates the marker function. The PEAK SEARCH key activates the peak search functions. MARKER → Sets the marker value as a specific parameter. 5. CONTROL functions. Allows access to menus that control the spectrum analyzer display and other functions necessary for measurement.
- Page 16 8. The power button turns ON/OFF the LPT-3000 Spectrum Analyzer. The Green light indicates the unit is ON and the Red light indicates it is in a STANDBY mode. The main power switch on the back of the unit must be ON to operate the unit.
-
Page 17: Rear Panel Overview
3-2. Rear Panel Overview LP Technologies, Inc [Figure 3-2] Outline of the Functions of the Rear Panel 1. Ventilation fan is installed to discharge heat generated inside the analyzer. 2. External trigger input connector 3. Ethernet connection interface 4. RS-232C connection interface 5. -
Page 18: Display Overview
9. Printer connection AC power switch (including a fuse) 3-3. Display Overview This is a screen shot of the LPT-3000 display. A description of each item listed is provided below. [Figure 3-3] Screenshot [Table 3-1] Explanation of a Screen Item... - Page 19 Item Explanation Function Key Screen title DISPLAY >> Title >> Change Title Time and date SYSTEM >> Time/Data Attenuation AMPLITUDE >> Attenuation Marker frequency Marker Marker amplitude Marker Subject to change according to the key Menu title selection Subject to change according to the key Menu selection Frequency span or...
-
Page 20: Menu And Soft Key Overview
There are several keys labeled (FREQUENCY, SYSTEM and MARKER…etc) on the front panel of the LPT-3000 Spectrum Analyzer designed to execute specific different functions. Pressing a front panel key accesses a soft key menu that is located along the right side of LCD display. -
Page 21: Measurement Methods
Factory Preset. 3. Press I/O DETECT >> Ref Out (On) to turn on the 80 MHz standard signal generated inside the LPT-3000 Spectrum Analyzer. 4. Please set the frequency by pressing the FREQUENCY key. The Frequency soft key menu is now activated on the right side of the LCD and the Center Frequency will be displayed on the screen. -
Page 22: Summary Of Measurements
The figure 3-4 fully shows the relationship between the Central Frequency and Reference level. The box in the figure shows a display of the analyzer. Changing the Center Frequency changes the location of horizontal line on the display. Changing the Reference level changes the vertical position of the signal on the display. If you increase the span, the scope of frequency shown horizontally on the display will increase. - Page 23 4. Set the Span Frequency to 500 kHz 5. The 80 MHz standard signal of the inside of the analyzer is about -40 dBm, so using the scroll knob, step keys, or the numeric keypad, adjust the reference level to -30 dBm. 6.
-
Page 24: Chapter 4. Configuration Of A Menu
Menu structure In this chapter we will review the following: Menu Functions Menu Structures Page | 24... -
Page 25: Frequency
Chapter 4. Menu Structure 4-1. Frequency 4-2. Span Page | 25... -
Page 26: Amplitude
4-3. Amplitude 4-4. Marker Page | 26... -
Page 27: Peak Search
4-5. Peak Search 4-6. Marker → Page | 27... -
Page 28: I/O Mode
4-7. I/O DETECT 4-8. Trace Page | 28... -
Page 29: Bw/Avg
4-9. BW/Avg 4-10. Trig Page | 29... -
Page 30: Display
4-11. Display Page | 30... -
Page 31: Sweep
4-12. Sweep 4-13. Measure Page | 31... -
Page 32: Measure Control
4-14. Measure Control 4-15. Measure Setup a. Channel Power b. Occupied BW c. ACP Page | 32... -
Page 33: System
4-16. System Page | 33... -
Page 34: File
4-17. File Page | 34... -
Page 35: File ( Save )
4-18. File ( Save ) Page | 35... -
Page 36: File ( Load )
4-19. File ( Load ) 4-20. File ( Delete ) Page | 36... -
Page 37: File ( Copy )
4-21. File ( Copy ) 4-22. File ( Rename ) Page | 37... -
Page 38: File ( Create Dir )
4-23. File ( Create Dir ) 4-24. Print Setup Page | 38... -
Page 39: Chapter 5. Explanation Of A Front Board Key
Key descriptions In this chapter we will review the following: Key descriptions Menu and soft menu overview Page | 39... -
Page 40: Amplitude
Chapter . Explanation of Keys on the Front Panel 5-1. AMPLITUDE The amplitude key allows the user to activate amplitude related functions such as changing reference level, input attenuation, vertical scale, reference level offset, amplitude units, and pre Ref Level ■... -
Page 41: Bw/Avg
Ref Level Offset ■ This adds the offset value to the currently indicated reference level. The reference level offset value can be changed only by using the numeric keypad. Changing the Reference Level Offset value does not change the trace or the input attenuation value. - Page 42 Video BW Auto Man ■ You can change the analyzer post-detection filter from 10 Hz to 3 MHz in a 1. 3. 10 sequence by using the numeric keypad or the step keys. Decreasing the Video Bandwidth increases the Sweep time in order to maintain the amplitude calibration. When it is not connected, a “#”...
-
Page 43: Display
▪ Pwr This function takes the average by converting data in the current trace memory to a linear power level, then converts it again to a log scale, and then displays it. When the average type is selected, PAvg will be indicated on the left of display LCD. -
Page 44: File
▪ Change Title This enables you to write a title on a title indication line on the upper part of a display. If you press Change Title, the Alpha Editor menu, including usable letters and signs, will appear. The title of the display will be kept until you press Change Title again, or withdraw the trace saved along with the previous title. - Page 45 When changing a directory to save in, please change the location by using the Dir Select menu key and the step keys. ▪ State The state file saves the set-up of the device. You can save the analyzer state in the memory with State.
-
Page 46: Frequency
Delete ■ This deletes a file in the memory of the analyzer. Copy ■ This copies a file to other directories of the internal analyzer or the USB flash memory. Rename ■ This allows you to change a file name. Create Dir ■... -
Page 47: I/O Mode
scroll knob and numeric key pad. If you press any number from 0 ~ 9 on the number key pad, a unit menu will appear. FREQUENCY >> Stop Freq CF Step Auto Man ■ This allows the operator to change the center frequency step. The center frequency step function is useful for finding out harmonics or side band exceeding the current frequency span of the analyzer. - Page 48 the back panel. When EXT(External) is selected, the spectrum analyzer uses the signal coming into the standard frequency input/output port on the back as the 10 MHz standard frequency. I/O DETECT >> 10 MHz Ref Out ( f = 80MHz ) On Off ■...
-
Page 49: Marker
the average data between the detection of the Peak and the Neg Peak. It is used for reducing VBW or irregular noise without using the trace average function. This function indicates the averaged value with faster sweep speed. ▪ Neg Peak When selected, the NPk is shown on the upper left side of the display. - Page 50 Delta ■ The second marker is activated on the location of the first marker. ( When there is no marker, two markers appear on the center of the display.) The amplitude and frequency of the first marker are fixed. The marker number is indicated on the Delta marker, and the same number is indicated on the standard marker as R.
-
Page 51: Marker
activated, press Marker Trace Auto 1 2 3 until there is an underline on 1, 2, or 3. The current activated marker will move to the selected trace. If you select Auto mode, the marker will automatically move to the selected trace. MARKER >>... - Page 52 it is on zero span. MARKER → >> Mkr → CF Mkr → CF Step ■ This changes the scale of the center frequency step so that it can match the activated marker value. In order to see the scale of the step, please press FREQUENCY >>...
-
Page 53: Meas Control
Mkr → Ref Lvl ■ This sets the analyzer so that reference level can be the amplitude of a marker. On delta mode, Mkr → Ref Lvl sets the reference level as the difference of amplitudes between markers. MARKER → >> Mkr → Ref Lvl 5-9. -
Page 54: Meas Setup
conversion between Pause and Resume. MEAS CONTROL >> Resume 5-10. Meas Setup This indicates the measurement set-up menu. The indicated set-up menu varies based on the selected measurement (ACP, Channel Power, Occupied BW, etc.) on the measure menu. ACP Meas Setup ■... - Page 55 ▪ Avg Number On Off In order to designate the average number, please press Avg Number (On). The average value will appear when each sweep is over. Avg Number ( Off ) inactivates the average measurement. MEAS SETUP >> Avg Number ▪...
-
Page 56: Measure
5-11. MEASURE This performs diverse measurement functions including the Adjacent Channel Power, Channel Power, and Occupied Bandwidth Meas Off ■ This turns off the measurement function. MEASURE >> Meas Off ■ This calculates the power in the center and adjacent channel of a signal. A marker point can be established as a measurement set-up menu while ACP is selected. -
Page 57: Preset
If you press Meas Set-up after selecting Occupied BW, you can set the occupied bandwidth power measurement parameter. If you press Meas Control after selecting Occupied BW, you can temporarily suspend or resume measurement or make conversion between continuous or single sweep modes. MEASURE >>... -
Page 58: Print
Sweep Continuous Title Clear Trace 1 Clear-Write Trace 2 Blank Trace 3 Blank Trigger Free Run 5-13. Print Please press the Print key if you want to print a copy of the screen using a recommended printer. The screen will remain temporarily suspended until the data transmission is completed. (No more sweeps are initiated). -
Page 59: Return
5-15. Return This returns you to the previous menu. 5-16. Peak Search This automatically places a marker on the highest amplitude signal of the trace and displays the marker’s amplitude and frequency. If there is no peak, the marker will not move. If there is no marker indicated, marker 1 will appear. -
Page 60: Single Sweep
Continuous Pk On Off ■ When this is ON, the marker is located on the highest level of trace, and when the sweep is over, it successively detects the highest level, and locates the marker. PEAK SEARCH >> Continuous Pk Mkr →... -
Page 61: Sweep
SPAN >> Zero Span Last Span ■ This changes the frequency span of the analyzer to the previous span. SPAN >> Last Span 5-19. Sweep This Accesses the sweep time menu and accesses the sweep-time soft key functions. Sweep Time Auto Man ■... - Page 62 allows the analyzer to revert to the most recent state it was in when it was powered down. You must use the Power on/Preset menu key to change the preset state that is loaded upon powering on the analyzer. ▪ Preset Type Factory User If you press Preset (Factory), the analyzer resets to factory defaults upon startup.
- Page 63 following keys. SYSTEM >> Time/Date >> Set Date Alignments ■ This enables you to accurately acquire frequency and level by arranging the internal circuit of the analyzer. ▪ Align Now This immediately starts the arrangement of the system. SYSTEM >> Align Now ▪...
-
Page 64: Trig
A message reading “Program update success. Reboot LPT-3000.” should appear in a status window on the lowest part of display LCD, when the update was successful. Turn off the power to the analyzer and turn it on again to apply the updated file. -
Page 65: Trace
sweep starts from the ascending/descending angle of the signal wave form inputted from the EXT TRIG input connector on the back panel. To start the trigger, a TTL input signal is required. TRIG >> External Trig Delay On Off ■ You can set the delay of the time that the analyzer is waiting, or turn it on or off before starting a sweep after receiving the external trigger signal. - Page 66 Min Hold ■ The Min Hold function displays and continuously updates the trace to display the lowest amplitude of signal level. TRACE >> Min Hold View ■ The View function freezes the trace and displays trace information. The trace information is not updated even after a seep. To return to a continuous trace, press the “Clear Write”...
-
Page 67: Chapter 6. Options
Measurement Guide In this chapter we will review the LPT-3000 Spectrum Analyzer’s additional options Page | 67... -
Page 68: Specifications
Chapter 6. Options 6-1. Specifications ► Opt-1 : TRACKING GENERATOR Scope of Frequency : 100 kHz ~ 3 GHz Scope of the Amplitude : 0 dBm ~ -50 dBm Accuracy of the Amplitude : ±3 dB, Typically ±1.5 dB Flatness of the Amplitude : ±2 dB, Typically ±1.5 dB Distortion of Harmonics : <-20 dBc (10 MHz ~ 2.8 GHz), Typically <-30 dBc Reverse Power : +30 dBm Impedance : 50Ω... - Page 69 RF cable (N-N, RD223, 1000 mm) × 2 Kit box × 1 ► Opt-8 : RETURN LOSS BRIDGE KIT SET Termination 50Ω × 1 Cap with chain × 1 RF cable (N-N, RD223, 1000 mm) × 2 Kit box × 1 99 Washington Street Melrose, MA 02176 Phone 781-665-1400...
Need help?
Do you have a question about the LPT-3000 and is the answer not in the manual?
Questions and answers