
Subscribe to Our Youtube Channel
Related Manuals for Fluid Imaging Technologies FlowCAM

Summary of Contents for Fluid Imaging Technologies FlowCAM
- Page 1 ® FlowCAM Manual Version 3.0 September 2011 Fluid Imaging Technologies, Inc. 65 Forest Falls Drive ∙ Yarmouth, Maine 04096 USA Tel: 207.846.6100 ∙ Fax: 207.846.6110 ∙ info@fluidimaging.com www.fluidimaging.com...
- Page 2 - 2 -...
-
Page 3: Table Of Contents
Preface ......................................5 FlowCAM Safety..................................6 Standard Factory Limited Warranty............................7 SECTION ONE-INTRODUCTION............................8 The Scope of this Manual ................................8 SECTION TWO-MODES OF OPERATION ........................13 Understanding AutoImage Mode ............................13 Understanding Trigger Mode (Fluorescence & Scatter) ......................16 SECTION THREE-INSTRUMENT SETUP ........................19 Instrument Setup ..................................19 Model C50 & C51 Peristaltic Pump ............................23 Model C70 &... - Page 4 Appendix I: Flow Cells and Tubing Specifications......................116 Appendix II: Glossary of Particle Properties & Other Terms...................117 Appendix III: How VisualSpreadsheet Determines Parts/Million and Particles/mL ............120 Appendix IV: FlowCAM Trigger Mode Guide ........................122 Appendix V: FlowCAM Calibration Verification Procedure ....................125 FlowCAM Size & Count Calibration Verification Report....................129 Appendix VI: FlowCAM Quick Start Guide........................130...
-
Page 5: Preface
Thank You Fluid Imaging Technologies, Inc. would like to thank you for making the important decision to purchase ® the FlowCAM system. We are committed to manufacturing quality products and providing unsurpassed customer service. Copyright Notice ® ® FlowCAM and VisualSpreadsheet are registered trademarks of Fluid Imaging Technologies, Inc. -
Page 6: Flowcam Safety
· There are no user serviceable parts inside this unit. Do not attempt any repairs yourself. Doing so will void your Standard Factory Limited Warranty. Should your FlowCAM require service, please contact Fluid Imaging Technologies, Inc. for additional instructions. This product must not be disposed of in normal household waste. -
Page 7: Standard Factory Limited Warranty
Standard Factory Limited Warranty ® Fluid Imaging Technologies, Inc. (“Seller”) warrants that the FlowCAM product (“Product”) purchased by you (“Customer”) shall be free from material defects in workmanship and material for a period of one (1) year from the date of shipment by the Seller (the “Limited Warranty”); provided, however, that the Limited Warranty does not cover any consumables (flow cells, flow cell holders, or tubing) or third party manufactured/customer purchased items incorporated in the Product. -
Page 8: Section One-Introduction
The Scope of this Manual ® Throughout the pages of this manual, you will learn how to set up and operate your FlowCAM . This manual is intended to be used with both the Benchtop and Portable Series of FlowCAM models. Minor differences exist between the models and as such, will not affect the usefulness of this manual. - Page 9 · Scatter Detection for Low Particle Concentrations Basic Overview of the FlowCAM In the FlowCAM system, sample is drawn into the flow chamber by a pump. Using the laser in Trigger Mode, the photomultiplier tubes (PMTs) and scatter detector monitor the fluorescence and light scatter of the passing particles.
- Page 10 · Fluidics · Electronics Optics Figure 1 is a block diagram of the FlowCAM architecture. The following section explains the operation of the components illustrated when using laser dependent Fluorescence and/or Scatter Trigger modes. As the particles are drawn into the flow chamber they pass through a “laser fan”...
- Page 11 The Digital Signal Processor (DSP) and trigger circuitry are central to the operation of the instrument. They provide a critical interface between the software and all other components of the FlowCAM. This complex circuit board measures the parameters of the fluorescence and/or light scatter signals and provides these parameters to the processor upon request.
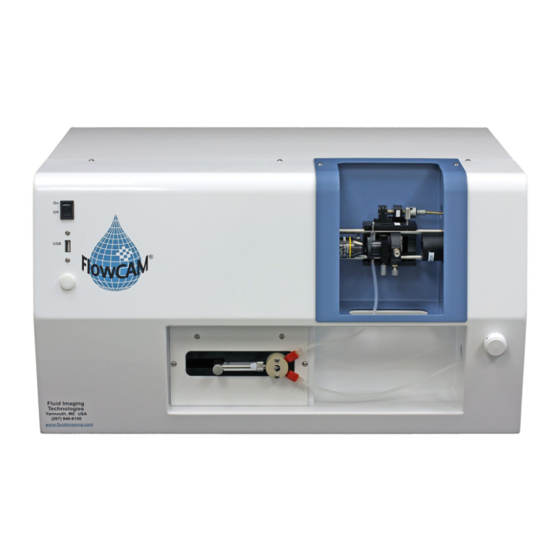
- Page 12 The first step in understanding the potential of the instrument is learning the components of the FlowCAM assembly. Figure 2 is a picture of one version of the VS-IV Open Bench Top Model (this unit can AutoImage, Scatter Trigger, has two Fluorescence Trigger channels and has a color camera.) While this particular unit pictured below uses a 532 nm laser, and is set up to detect red (>650 nm) and...
-
Page 13: Section Two-Modes Of Operation
Understanding AutoImage Mode AutoImage Mode Definition AutoImage Mode is an image analysis mode in which the FlowCAM captures images of the moving fluid at a regular, user-defined interval (Frames Per Second or FPS). This mode is used when processing samples with high particle concentrations. The total number of particles imaged is a function of the following: ·... - Page 14 Typical values for camera pixels are 1024 x 768 and 1280 x 960. The FlowCAM will arrive with factory default settings that include the correct values for the installed digital camera. VisualSpreadsheet determines the acceptable region within the camera’s field of view by the following process.
- Page 15 The Setup and Focus window (Setup Menu or Hotkey = F6) is used to adjust the focus, camera, and context settings of the FlowCAM while sample is present in a flowcell. By default, in AutoImage Mode, the camera images the field of view at a regular interval-determined by the AutoImage Rate setting in frames per second (Setup >...
-
Page 16: Understanding Trigger Mode (Fluorescence & Scatter)
Understanding Trigger Mode (Fluorescence & Scatter) Trigger Mode Definition Trigger Mode is an image analysis mode on the FlowCAM in which the scattering of laser light is measured and/or two photo multiplier tubes (PMT) are used to measure fluorescent particles, and those measurements are compared against a threshold value. - Page 17 Important Information Regarding Trigger Mode As you attempt to optimize an analysis done in Trigger Mode, it is important to note that there are a few factors that may affect the performance of your FlowCAM in Trigger Mode. - 17 -...
- Page 18 When using a FlowCAM, your objective lens does not view the entire width of the flow cell. If you are using the FlowCAM for counting purposes, you might want to consider using a field-of-view (FOV) flow cell - this will allow you to image the entire fluid stream. The FOV flow cells are available for purchase from Fluid Imaging Technologies, Inc.
-
Page 19: Section Three-Instrument Setup
Power Configuration for a Portable FlowCAM Due to the portable nature of this model of the FlowCAM, it includes a power cord that will plug into a 12V power supply (for example, a power outlet in a vehicle). There are up to three other power cords for the Portable FlowCAM. - Page 20 Although the laser may now have power, it is not activated until the optics door is shut and the user opens VisualSpreadsheet (the laser is software activated). For other FlowCAM models, the power is enabled to the laser via the “Laser” or “L” switch found on the switch plate.
- Page 21 Install the objective (typically 2X, 4X, 10X, or 20X) by threading it into the appropriate optics cube (see Figure 2, letter K). The appropriate optics cube on the Benchtop FlowCAM is located on the left in the optics area. Be sure not to touch the face of the lens.
- Page 22 These particles are captured by VisualSpreadsheet and the images are saved as a collage file. A FlowCAM-XPL model (or optional XPL upgrade) utilizes two cross polarizing filters to properly detect particles that exhibit birefringence when subjected to cross-polarized light (CPL). One of the filters is fixed and the other filter is adjustable (via an index).
-
Page 23: Model C50 & C51 Peristaltic Pump
The only difference between the C50 and C51 pumps is the C50 is installed into the FlowCAM instrument (see Figure 7), and the C51 is a stand-alone pump external to the instrument. All performance and operations of the pumps are identical. Like any other peristaltic pump, the C50 uses occlusion tubing to draw the sample through the pump. - Page 24 Figure 7. A C50 Peristaltic pump installed in the FlowCAM Occlusion Tubing There are three sizes of occlusion tubes used with the peristaltic pumps. Each tube has a specific length and tube diameter that determines the appropriate flow rate (and an associated part number for reordering).
- Page 25 Operating the Pump There are only a few controls on the control panel of the pump (see Figure 9). First, the arrows on the right side of the pump indicate the flow when the pump is in ‘Forward’ mode. ‘Reverse’ will switch these directions.
- Page 26 C50 & C51 Pump Settings and Flow Rates Dial Setting Pump Tube Flow Cell Flow Rate (ml/min) Dial Setting Pump Tube Flow Cell Flow Rate (ml/min) FC600 or Greater FC50 0.019 FC50 0.05 FC600 or Greater FC50 0.08 FC600 or Greater FC50 0.12 FC600 or Greater...
-
Page 27: Model C70 & C71 Syringe Pump
Figure 10. The C70 & C71 syringe pumps The addition of the syringe pump to the FlowCAM allows for more accurate and precise fluid handling and results in new modes of priming and operating the FlowCAM. Flow rates are selectable from 0.005 - 200 mL/min and sample volumes as low as 35 µL are acceptable. - Page 28 FlowCAM there are bulk head connectors that are installed in the instrument case. These connectors allow for the sample container to be located outside of a closed instrument case (e.g., the Portable FlowCAM case). Sample fluid should enter the top of the flow cell and flow down through and exit at the bottom.
- Page 29 Figure 13. An example of the pipette tip holder installed on the FlowCAM Figure 14. Tubing to Funnel Connection and connection to Pump for a Benchtop FlowCAM (also see Figure 15 below) - 29 -...
- Page 30 Out to waste container Pump Tubing & Tubing Port Figure 15. Tubing to Pump Connection and Tubing to Waste Installation for Benchtop FlowCAM Engage the Pump to Forward Using the software controls (See Section Four) engage the syringe pump to move the sample down into and through the flow cell.
- Page 31 Optimizing the Field of View and Focus Start the VisualSpreadsheet software by double-clicking on the icon located on the desktop. When prompted, select the appropriate magnification. A notification will open to remind the operator to ensure that the correct objective and collimator/diffuser (if required) is installed. Figure 16.
- Page 32 Course/Rough focus To coarse focus the field of view, loosen the rail lock thumb screw (see Figure 18). Slide the entire Flow Cell Holder Assembly to bring any part of the flow cell into focus. When the flow cell has been located, tighten the rail lock thumb screw.
- Page 33 Micrometer (Fine Focus) Course Focus Adjustment Screw X-Axis Adjustment Knob Y-Axis Adjustment Knob Figure 19. Course and Fine focus adjustment screw and knobs for the open bench top model Adjust the field of view illumination (if necessary) There are two ways to adjust the light intensity passing through the flow cell to the objective (note that the flow cell should contain sample diluent or sample of interest before adjusting illumination and focus).
- Page 34 The values for (Camera) Gain and Flash Duration can be adjusted to optimize the intensity of the field of view illumination. · Adjust the Gain. The higher the value, the brighter the field of view. However, when this value is too high, there is a loss of contrast between particles and the background. ·...
- Page 35 Now that the FlowCAM has been set up with the correct field of view illumination and particles of interest are in focus, you are ready to adjust context settings in Visual Spreadsheet and collect data.
- Page 36 If there is no objective or collimator installed use removable tape or similar to cover the holes, thereby keeping dust and other miscellaneous particles out of the optics system. · Never attempt to clean the mirrors located inside the FlowCAM. · Only clean objectives and collimators with an appropriate lens cloth or lens paper.
- Page 37 · The FlowCAM has a specialized PC built into the instrument. · Never install additional software on the system unless instructed by Fluid Imaging Technologies. · Do not connect the FlowCAM to the Internet unless instructed to do so by Fluid Imaging Technologies.
-
Page 38: Section Four-Visualspreadsheet
· Post-processing of collected data Run Files and Folders General Run File Name Information By default, the FlowCAM software generates filenames based on the Julian day of the experiment. The program stores data in files named as follows: JJJ-hhmmss.xxx where JJJ is the Julian day (1-365) and hhmmss represent the hours, minutes, and seconds for the start of the experiment. - Page 39 A “.lst” (list) file is generated for each experimental analysis. List files are the primary data files for FlowCAM experiments. List files are ASCII text files recording the fields of data collected for each particle. The format of this file has changed several times but the VisualSpreadsheet program can always read list files created by earlier versions of VisualSpreadsheet or older FlowCAM software.
- Page 40 · Context Settings: This location is provided as a place to save custom context settings. General Computer Specifications The FlowCAM typically utilizes a Core 2 Duo, 2GB RAM and 500GB+ HD (larger hard drives are preferred for image storage). The Operating System presently used is Windows 7 but older systems employ Windows XP Pro.
- Page 41 Main Window and View Window Examples Figure 22. The Main Window for VisualSpreadsheet (left) and an example of the separate View Window (right) including the Particle Properties Display. - 41 -...
- Page 42 Main Window Main Window Menu X-Axis Lower and Upper Limit Set Buttons Toggle Button (ESD/ABD) Interactive Graph (one of four) Analysis Start/End Times Particle Counts Summary Statistics, Filters, Cumulative Stats, Context Summary tabs Figure 23. The Main Window for VisualSpreadsheet with the main sections highlighted and described for reference.
- Page 43 Interactive Graphs The Main window can be configured to display none, one, two, three or four interactive graphs using the Preferences menu. Changing Graph Type Changing the type of graph being displayed is accomplished by right-clicking on a graph and choosing another graph from the popup menu.
- Page 44 Figure 25. Right-clicking an interactive graph to display the Custom Graph window To create a new Histogram, select the parameters from the menu list for both the X and Y-Axis. Specify the Bin Size and click “OK”. The new custom Histogram will be displayed on the Main Window in the location of the original graph.
- Page 45 Figure 26. Example of how to select particles from a Bar Style Histogram Figure 27. Highlighted Count area, since the entire data set is not displayed Selecting Particles (Additional Information) Bar Style Histograms: Drag the mouse horizontally to the right (or left) across the graph. The entire vertical area of the graph is selected for the length of the horizontal line or rectangle selection area and the particles in the selection area are shown in the View window.
- Page 46 of any graph. Left click and drag the mouse over the entire graph area to create a rectangle selection area containing all particles. Again, particles selected are displayed in the View window. Selecting Particles without opening the View Window: To select particles without opening the View window, press and hold the Ctrl key down before dragging the cursor across or around the particles of interest in a graph.
- Page 47 Figure 30. An example of the Cumulative Stats tab from the Main Window Figure 31. An example of the Context Summary tab from the Main Window - 47 -...
-
Page 48: Main Window
VisualSpreadsheet file types and detailed information on each kind of file. Open List… Use this function to open a previously generated FlowCAM list file. When Open List is selected, a file open dialog box will be displayed showing only List (.lst) files available in the current directory (usually the last directory opened). - Page 49 VisualSpreadsheet as a new list file. This is typically used after editing an original list file to save the results (such as after deleting unwanted particles). In order to prevent inadvertent modifications to FlowCAM data, VisualSpreadsheet will not allow saving changes to a list file using the same filename.
- Page 50 Close List Close List closes the currently open List file. If the View Window is open, the Close List menu option in the Main window is disabled (grayed out). To close the current list file, first close the View Window and the Close List menu command can be selected.
- Page 51 Export as PDF… Exports the displayed Main Window into a Portable Document Format (PDF) file. PDF is a popular file format for which many viewing programs exist. Export Data… Exports the data selected in the Main window. Note: Only the data fields defined in the Preferences > Export >...
-
Page 52: Edit Menu
Exit All VisualSpreadsheet windows close and the application is ended. Note: if any changes have been made to the List file during a session (such as deleting particles), a dialog will open indicating this and asking if you wish to save the data prior to closing. Edit Menu Open View Window…... -
Page 53: Analyze Menu
The Analyze Menu is the primary control window for the FlowCAM to begin data acquisition. AutoImage Mode… (F4) In this mode, the FlowCAM captures images at a user-set time interval until a Stop Criteria is met or the user terminates the analysis. -
Page 54: Setup Menu
Setup Menu Context… The Context… menu item accesses the settings used by the FlowCAM to capture particles of interest during a sample analysis. This includes settings for the camera, fluorescence gains and thresholds and other various parameters. The settings are stored in a file with .ctx file extension within the folder containing all the files for a particular analysis. - Page 55 Context… Load Load Factory Default Context: Allows the user to load in the most basic software settings for the particular instrument configuration (examples include 2X, 4X, 10X, or 20X objectives), as determined by the manufacturer. Load Local Default Context: Allows the user to load in the context file that had been saved previously as the local default (see below).
- Page 56 Context… Capture Particle Capture Distance to Nearest Neighbor - Any particles that are equal to or less than this distance in microns from each other will be imaged as one particle when the software analyzes a raw camera image and segments out particles.
- Page 57 Context Settings. Acceptable Region Left, Right, Top, Bottom - The resolutions of the standard FlowCAM digital cameras are 1024 x 768 or 1280 x 960 pixels. Entering values into these fields that are less than the maximum range will effectively constrain the field of view.
- Page 58 Context… Flow Cell Flow cell Flow Cell Type – From the available menu, select the part number of the flow cell currently in use. The Flow Cell Depth and the Flow Cell Width will automatically populate. These measurements can be adjusted if necessary.
- Page 59 Flow rate – A user-entered value for the rate of flow of sample through the flow cell during the analysis. The flow rate is accurately controlled by the FlowCAM software when a syringe pump is used. But when a peristaltic pump is used, it is up to the user to accurately set the flow rate as the software has no direct control over a peristaltic pump.
- Page 60 Estimated Efficiency and Run Time Efficiency (%) and Run Time (minutes) are automatically calculated based upon the values entered in the Settings section. If the calculated efficiency percentage results in a situation where multi-imaging of particles is likely to occur, an error message will be displayed. The Flow Rate and/or the AutoImage Rate will need to be adjusted to produce a set of conditions that does not potentially result in the multi- imaging of particles.
- Page 61 Context… Camera Settings Shutter - This parameter controls the duration of time that the camera shutter is open during image capture. The larger the value, the longer the camera shutter is open. In general, the user should not adjust this factory set parameter. Gain - The higher the value for Gain, the more light the camera allows during “exposure”.
- Page 62 Quadrant II – Orange Quadrant I – Purple Quadrant III – Green Quadrant IV – Blue Color Coordinates for U (X-Axis) and V (Y-Axis) Settings Gamma, Hue (if available), and Saturation (if available) - These are inter-related adjustment parameters that can be used to fine tune the color of the camera field of view (after the major factors White Balance U and White Balance V have been adjusted).
- Page 63 Context… Filter Basic Size Acquisition Filter - This function is the primary image filtration step that occurs during the processing of the raw camera image. The user can choose to filter using ESD (Equivalent Spherical Diameter) or ABD (Area Based Diameter) or can choose No Size Filter (these terms are defined in more detail below).
- Page 64 ABD (Area Based Diameter) - The diameter calculated as the diameter of a circle with an area that is equal to the ABD Area. The ABD Area is the combined area of all the pixels that are deemed part of the particle so the ABD Diameter is the diameter of the circle obtained by arranging these pixels in a solid circle.
- Page 65 Exports As the field names indicate, enabling these options will result in automatic export of list data spreadsheet and/or the list summary data spreadsheet when the analysis terminates. Classification These options allow the user to automatically generate a classification or export a classification summary at the end of a run.
- Page 66 Context… Run Summary This section contains information summarizing an analysis and is automatically populated when an analysis ends. This data is saved on disk in a '_run_summary.txt' file stored with the other analysis files. The following information is contained: Run: ·...
- Page 67 Context… Stop Stop Conditions The user may check and use any of the listed stop conditions to terminate the analysis automatically. In addition, more than one condition can be checked in which case the analysis will stop as soon as one of the selected multiple conditions are met.
- Page 68 Context… Fluorescence/Scatter This section allows the user to select and refine the settings for the Trigger Modes of the FlowCAM if the unit in question is a model equipped to run in Trigger Mode. See Section Two for more information on Trigger Mode.
- Page 69 Threshold: The value needed by a fluorescence or scatter measurement to cause the FlowCAM to take a raw image. The threshold value should be set above the background noise level which is usually around 150-200.
-
Page 70: Setup Menu
Trigger Mode channels. These settings have been factory determined and preset to the optimal default values. Typically, the FlowCAM user should not adjust these settings. However, a brief description of this feature and each parameter is as follows: The PMT/Scatter detectors are not monitored simultaneously but are instead sampled by the DSP in a cyclical fashion taking approximately one µsec per measurement. - Page 71 The system can also be set to a manual, non-syringe pump by selecting the “Other” button. If an external syringe pump is connected to the FlowCAM, the software can be instructed to search for the new pump by selecting the “Syringe Pump” option.
-
Page 72: Setup Menu
The checkbox labeled “Automatically send sample to waste bottle” is an optional setting that when enabled instructs the FlowCAM to evacuate any remaining sample from the system to the waste container at the end of each run. Note that the volume of sample to evacuate is partially calculated from the length of the lower tubing entered in the Context >... - Page 73 Setup and Focus Mode… File Menu Save Image… If the camera is Paused, this menu item saves the image currently displayed in the Setup and Focus window. Select a folder location to save the image. Enter a file name for the image. The image is saved in a TIF format with a .tif file extension.
- Page 74 Setup and Focus Mode… Show Menu Collage Window: Selecting this option will open a separate Collage Window. Boxes: Displays a square box around particles that VisualSpreadsheet is segmenting and capturing (to the collage window) in the current image. Ruler: When checked VisualSpreadsheet displays a Ruler in the bottom right of the Setup and Focus Mode window.
- Page 75 Show frame rate: Displays the actual frame rate value (which may be different than the value set in the camera dialog window). Show fluid volume imaged: Displays the fluid volume actually imaged by the FlowCAM. Show sample volume processed: Displays the fluid volume processed by the FlowCAM (available only if a syringe pump is used).
- Page 76 Show Efficiency: Displays the actual efficiency (available only if a syringe pump is used). Setup and Focus Mode… Tools Menu Recalibrate: This function is not relevant when in Setup and Focus Mode. This function is employed when doing an analysis. During the analysis, the user can select the Recalibrate function on this menu to immediately generate a new calibration image.
-
Page 77: Autoimage Mode (No Save)
Note the smooth shape of the curve. As a general summary, the intensity is maximized while the curve maintains a smooth appearance. In certain cases, it may not be desired to have the intensity maximized (depending upon the sample being measured). The Raw Image Pixel Intensity tool is also helpful for setting the intensity close to a predetermined intensity level based on a previous sample run-when the test conditions are the same between runs (same magnification, flow cell size, camera gain setting and other parameters). -
Page 78: Trigger Mode Setup
AutoImage analysis. Trigger Mode Setup… (F8) Trigger Mode Setup runs the FlowCAM in scatter and/or fluorescence triggered mode to quickly test the settings for triggering sensitivity on the current sample. This mode does not run a background calibration so particles are not extracted. -
Page 79: Tools Menu
Tools Menu Time Series Graph The Time Series Graph (as seen in the example above) is a basic tool to display various information about the sample being analyzed in real time. For example, the Time Series Graph can be open during an analysis and set to display Frequency Count. - Page 80 maximum Y-Axis value) to access a dialog box. In this dialog box, the user can type in a new value that will be used as the new maximum Y-Axis value. Recalculate If VisualSpreadsheet attempts to open a List file collected with an earlier software version (2.2 or older) the following window is displayed: Selecting “Yes”...
-
Page 81: Preferences Menu
Preferences Menu Main Window Settings… Layout Graphs: The user can select one of seven options for the number and size of graphs to display on the Main Window (from zero up to four small graphs). Grids: This section contains six different options that can be selected by the user. When selected, the appropriate information is displayed on the Main Window. - Page 82 Histogram Bin Sizes: This section allows the user to modify the bin sizes for the Histograms displayed on the Main Window. The bin sizes that can be adjusted include: · Diameter · Aspect Ratio or Transparency · Fluorescence or Scatter ·...
- Page 83 Main Window Settings… Filter Grid Calculated Values: The user determines which column values to display in the filter grid on the Main Window. The Calculated Values include: · Count · Count percentage · Volume percentage · Particles per mL · Parts per million ·...
-
Page 84: Help Menu
Display Settings… Image Windows Ruler: The user may adjust the Ruler length, color, and pixel width. Binarization Overlay: The pixel color can be determined for this overlay (i.e. for the pixels that the software determines constitute part of a particle) in the same manner as for other color selections. Click the color box to open the Color dialog box to select a new color. - Page 85 The Advanced Settings window contains three different sections. Two sections (Logging and Particle Limits) may be of interest to the FlowCAM user. The other section (Image Acquisition Delay) contains parameters that typically should not be adjusted by the user because they are factory set to default values.
- Page 86 The DSP Monitor window is an advanced area that is for use by Fluid Imaging Technologies trained personnel. It is not recommended that the FlowCAM user adjust any of these values or settings unless directly instructed to do so by customer service personnel.
-
Page 87: View Window
The Multiple Camera Setup window is an advanced area that is for use by Fluid Imaging Technologies trained personnel. It is not recommended that the FlowCAM user adjust any of these values or settings unless directly instructed by customer service personnel. -
Page 88: Tool Bar
The View Window displays the particle images for all particles selected using the interactive graphs in the Main window (see Figure 26). VisualSpreadsheet arranges all of the particles selected into pages of image collages. When the View window is first opened, the particles are sorted by the ID number that was assigned to the particles in the order they were captured. -
Page 89: Status Bar
track to a particle. Therefore when the window is zoomed, scroll bars appear on the outside of the window to enable scrolling horizontally and vertically through the zoomed window. Zoom In Zoom Out Zoom to 100% Show Selected: The Show Selected button will cause only those particles selected (having a red border around the image) to be displayed. -
Page 90: View Window
View Window… File Menu Save As List… This menu item saves all of the particles in the View window (all image collages) to a new List file (.lst). Note that only the currently viewable particle images are saved, not necessarily all the particles originally selected using the Interactive Graphs in the Main window. -
Page 91: View Window
The individual particle data or summary data exported is for the particle images being viewed. This includes particle images that have been included in one or more Classes which removes them from view in the View Window unless Show > Classified Images menu option is enabled. Particles that have been filtered out or deleted are not included. -
Page 92: View Window
Delete Images NOT Selected Deletes all particles that are NOT currently selected (images without the red border) in all image collages. When particles are deleted from the View Window, they are removed from the list of particles available in this window and can only be recovered by reselecting them using the Interactive Graphs from the Main Window or by selecting Edit >... -
Page 93: View Window
Particle Properties The list of Particle Properties contains 22 different properties including two submenus (see Appendix II for a list of particle property definitions). There are six parameters associated with the Color submenu: Average Blue, Average Green, Average Red, Ratio Blue/Green, Ratio Red/Blue, and Ratio Red/Green. There are ten parameters associated with the PMT/Scatter submenu: Ch1 Area, Ch1 Peak, Ch1 Width, Ch2 Area, Ch2 Peak, Ch2 Width, Ch2/Ch1 Ratio, Scatter Area, Scatter Peak, and Scatter Width. - Page 94 The other type of filtering (relative) used by VisualSpreadsheet is called Statistical filtering. Statistical filtering uses a simple procedure where the user provides a representative training set of particles and VisualSpreadsheet uses this set to generalize an ideal target particle. This target particle is then compared against the entire data set and each particle is scored based on their ‘likeness’...
- Page 95 Constructing a Filter: Particle parameters can be selected from the Available Fields list and moved over to the Currently Using list by highlighting the parameter and clicking the right arrow. Parameters can be moved in a reverse direction by selecting the left arrow. The user can also select the Add All and Remove All buttons to move the entire list.
- Page 96 Tolerance: The requirements for a value filter can be relaxed by entering a tolerance. An example best describes this process: Suppose the value filter is currently using two fields: Diameter (ESD) and Aspect Ratio. Field 10.0 20.0 Aspect Ratio Setting the tolerance value to 50% would result in new constraints for the filter to be calculated when it is applied.
-
Page 97: View Window
to add a tolerance to the filter or to remove or adjust the ranges of some of the fields in the filter. The filter can also be saved using the Filter Dialog. Like Selected Particles (Statistical) (F5) This option uses the currently selected particles as a training set and builds a Statistical filter as described previously. -
Page 98: View Window
The View Window Summary provides statistics on the particle properties for particle images currently being viewed. The window has the same appearance and features as the Summary Stats and other grids section displayed on the Main Window. Therefore the appearance of the View Window Summary can be changed via the Main Window >... - Page 99 same particles without and with the Binary Image Overlay. Note that by using this overlay, it is easily observed that the context settings are not optimized as various parts of some particles are not being captured. Thus the user can adjust Context settings attempting to improve the overall analysis data and statistics.
-
Page 100: Right Click Popup Menu
Colored Filter Scoring Colored Filter Scoring is used in conjunction with Show Particles Properties. After filtering particles in the View Window (via the functions in the Filter menu), selecting this function allows the user to see why particles were or were not sorted together by the use of various shades of colors. If parameters (as seen in the Particle Properties window) are lightly colored, then their differences from filtering values were minimal;... -
Page 101: Library Window
Library Window Tool Library Tabs Image Collage Status The Library window is used to create, view, and edit one or more Libraries. Each Library is viewed by selecting the associated Library Tab. Libraries are for grouping similar particles in order to create a filter. -
Page 102: Library Window
Status Bar The Status Bar at the bottom of the Library Window provides information about the status of the particle images. Saved / Modified: The word Saved in the first section of the Status Bar indicates that the current changes to the currently selected Library have been saved. The word Modified indicates that some changes to the currently selected Library have not been saved;... - Page 103 tab in the Library Window in the Library Tabs row. After one or more particle images have been added to the Library, the Status Bar will indicate Modified. Close Library Once selected, closes the currently open Libraries. However unlike the Close Window option described below, the Library Window will remain open.
-
Page 104: Library Window
Library Window… Edit Menu The edit menu is used to select, deselect, and delete specific particle images. Select All (Ctrl+F2) Selects all particle images currently displayed in all image collages. This will place a red border around each particle image. Deselect All (F2) Deselects all particle images. -
Page 105: Library Window
Find Duplicates When working with a large number of particle images and files, it is possible to erroneously add the same particles to a Library more than once. Find Duplicates searches for duplicate particle images. If any are found, the duplicate images are selected and only the selected particles are shown. To delete the duplicate images, use the Edit >... -
Page 106: Library Window
Library Window… Show Menu Particle Properties (F8) Shows or hides the Particle Properties window. Moving the cursor over any particle image causes particle properties to be displayed in this window. Images (F9) Shows or hides the display of particle images. This menu command does not affect the number of particle images included in the Summary Statistics calculations (or the exporting of particle property data). -
Page 107: Classification Window
Classification Window Tool Class Tabs Image Collage Status The Classification window is used to create, view and edit one or more Classes within a Classification. Particle images within a List file can be assigned to a Class within a Classification. Classification is used when you must have all particles in a known identification category, such as species or morphotype. -
Page 108: Classification Window
Saved / Modified: The word Saved in the first section of the Status Bar indicates that the current changes to the currently selected Class have been saved. The word Modified indicates that some changes to the currently selected Class have not been saved; if the Classify window were to be closed without saving, the user would be presented with an option to save any changes before closing. - Page 109 The Open Classification dialog box contains two sections. The Open an Existing Classification section allows the user to highlight a Classification from the list of Existing Classifications. Once highlighted, click on the Open button. The Create a New Classification section allows the user to create and name a new, empty Classification.
-
Page 110: Classification Window
Classification Window… Edit Menu The edit menu is used to select, deselect, and delete specific particle images. Select All (Ctrl+F2) Selects all particle images currently displayed in all image collages of the open Class. This will place a red border around each particle image. Deselect All (F2) Deselects all particle images. -
Page 111: Classification Window
Classification Window… Classes Menu New Class… A Class is a subset of a Classification. Every Classification has at least one Class. More than one Class can be opened in the Classification Window. To create a New Class, enter the new Class Name and click the OK button. - Page 112 Edit Class… Selecting this menu command will reopen the Particle Class Setup dialog box for the currently selected Class Tab. Changes can then be made and saved to the Class. Delete Class Permanently deletes the currently selected Class tab. Warning: A Confirm Delete? message box will NOT appear and the deletion cannot be undone.
-
Page 113: Classification Window
Classification Window… Operation Menu Run Auto Classification This function will automatically scan an open View Window (containing particles), apply the filter(s) specified in the New Class… > Filters (section), and move the particles which match the filter(s) into the Class Tab. For this function to successfully locate and move particles, a filter(s) must be defined for the Class Tab. -
Page 114: Classification Window
Build Value Filter… Selecting this function will open a Filter dialog box and automatically populate the Currently Using section with all available fields and their corresponding values. These values are derived from the Class Tab that is highlighted. This menu item allows the user to build a filter using the particle properties/characteristics of a Class. -
Page 115: Keyboard Commands
Move to Class: Moves the particle to another Class within the currently open Data set. More than one Class must be open in the Classify window. Keyboard Commands Selecting Multiple Particle Images: To select a group of particle images within the Classification Window, press and hold the Ctrl key, click to the left of the first particle of interest, hold down on the mouse button and drag across the remaining particle(s) of interest. -
Page 116: Appendix I: Flow Cells And Tubing Specifications
Flow Cells and Tubing Specifications Depth Width Tubing Inner Flow Cell Type (µm) (µm) Diameter (cm) Matching Objective(s) FC50 1000 0.16 20X or 10X FC80FV 0.16 FC80-7FV 0.16 FC90FV 0.16 FC100 2000 0.16 10X or 20X FC200 2000 0.16 10X or 4X FC300 3000 0.16... -
Page 117: Appendix Ii: Glossary Of Particle Properties & Other Terms
Glossary of Particle Properties & Other Terms The following list of definitions applies to VisualSpreadsheet Version 3.0 particle property fields. Note that most of these definitions also apply to older versions of VisualSpreadsheet, including 2.4, 2.2, 2.1 and 2.0 software. After each definition, the numbers or values listed in ( ) are the possible range of values for that particle property. - Page 118 Circle Fit: Deviation of the particle edge from a best-fit circle, normalized to the range [0,1] where a perfect fit has a value of 1. (real [0, 1]; 1 is the value for a perfect circle; values near zero are for particles that are not at all circular) Compactness: A shape parameter derived from the perimeter and the area.
- Page 119 PPC (Particles Per Chain): The number of particles that were grouped into one particle based on the nearest neighbor distance. (integer > 0; always 1 if nearest neighbor distance is 0) Perimeter: Total length of the edges making up a particle including the edges of any holes. (real > 0) Ratio Blue/Green: Average Blue / Average Green.
-
Page 120: Appendix Iii: How Visualspreadsheet Determines Parts/Million And Particles/Ml
Typical values for camera pixels are 1024 x 768 and 1280 x 960. The FlowCAM has factory default settings that include the correct values for the installed digital camera. VisualSpreadsheet determines the acceptable region within the camera’s field of view via the following process. - Page 121 VisualSpreadsheet can determine the total volume it imaged with the following calculation: Total Volume Imaged = Number of Images Taken during the Run × Volume per Picture (µm VisualSpreadsheet can calculate PPM using either the Volume (ESD) or Volume (ABD) particle volume measurements.
-
Page 122: Appendix Iv: Flowcam Trigger Mode Guide
What is the Proper Sample Preparation for Trigger Mode? For a sample to be properly run through the FlowCAM in Trigger Mode, the sample should be screened through the appropriate sized mesh (available from Fluid Imaging Technologies) for the flow cell you will be using. - Page 123 FlowCAM in Trigger Mode. When using a FlowCAM, your objective lens does not view the entire width of the flow cell. If you are using the FlowCAM for counting purposes, you may want to consider using a Field of View (FOV) flow cell - this will allow you to image the entire fluid stream (for more information please contact the Fluid Imaging Technologies, Inc.
- Page 124 settling. Note that you can view this graph in “real time” as you are running your sample. It is possible to capture images of particles that did not trigger the laser or the PMT. This happens because once the threshold level is met or exceeded, the camera takes a raw image, and collages the raw image based on your context settings.
-
Page 125: Appendix V: Flowcam Calibration Verification Procedure
FlowCAM Calibration Verification Procedure Purpose: To describe the proper procedure to verify the calibration of the FlowCAM. Two individual procedures below will test the instrument’s ability to measure the size of various particles in solution, and to determine the concentration of particles in solution. - Page 126 Dispense 1 mL of sample for 20x, 10x, and 4x objectives or 3 mL for 2x objectives into the FlowCAM. Start an AutoImage analysis and save the file with an appropriate name (i.g. Instrument Serial Number_Date_Size_Run Number). If necessary start the pump and run the sample through until the trailing meniscus reaches the top of the flow cell.
- Page 127 manufacturer/supplier) then the calibration factor value should be checked to ensure it is set to the factory default value. Note that changing the calibration factor value from the factory default value will change the particle size and volume reported. Counting Procedure: The acceptable region (Setup > Context > Capture > Acceptable Region) should be constrained by one pixel on the Top and Left side only.
- Page 128 Post process the resulting data (saving the new data set as a separate list file) to remove any non-bead or particles that might have been imaged during the run (either by using a pre-defined filter, or manually selecting particles from the View Window). Open the newly saved post-processed list file. The Particles/mL value will be displayed on the Main Window and via the ‘Statistics’...
-
Page 129: Flowcam Size & Count Calibration Verification Report
20X Bead Mix Count Procedure Bead Size Listed Count Objective (µm) (P/mL) FlowCAM Count (P/mL) Pass/Fail If a particular objective was not required/available for testing enter “N/A” Notes (reagent lot numbers, etc.): Testing Performed By: __________________________________________ _________________________________ Signature / Printed Name... -
Page 130: Appendix Vi: Flowcam Quick Start Guide
FlowCAM. Step-By-Step Instructions 1. Insure that the license dongle is plugged into a USB port on the FlowCAM (not applicable to all FlowCAM models). 2. Turn on the FlowCAM using the power switches located on the rear and front of the instrument. - Page 131 · Add the sample and turn on the pump until the sample can be seen in the Setup and Focus window. Note: Proper sample preparation is critical to having a successful FlowCAM analysis. It is important to get the proper particle size distribution and sample dilution to ensure that the best possible data are obtained.
- Page 132 No Save mode. · Determine if the FlowCAM is identifying particles of interest to you and segmenting them correctly. · Close the No Save run and make changes in the Context Settings and repeat as needed §...
-
Page 133: Appendix Vii: Standard Flowcam Hardware Configurations
® Standard FlowCAM Hardware Configurations Collimator/Diffuser Objective Recommended Diffuser/Collimator 1/2X Diffuser or N/A Diffuser or N/A Diffuser or N/A Collimator Collimator Flow Cell Objective Recommended Flow Cells 1/2X Custom, FC4000, FC3000, FC2000x6, FC2000x4, FC1000FV, FC1000 Custom, FC4000, FC3000, FC2000x6, FC2000x4, FC1000FV,... - Page 134 Flow Cell Holder Objective Recommended Flow Cell Holders 1/2X Custom, QCFC4000, QCFC3000, QCFC2000, QCFC1000, QCFC FOV10 Custom, QCFC4000, QCFC3000, QCFC2000, QCFC1000, QCFC800, QCFC FOV10 Custom, QCFC4000, QCFC3000, QCFC2000, QCFC1000, QCFC800, QCFC700, QCFC600, QCFC FOV10 QCFC600, QCFC300, QCFC FOV10, QCFC FOV5 QCFC300, QCFC FOV10, QCFC FOV5 QCFC300 Pump Tubing C50/51...
- Page 135 Pipette Tips Objective Recommended Pipette Tip 1/2X NF5010 (10ml) NF5010 (10ml) NF5010 (10ml), NF505 (5ml) NF505 (5ml), NF502 (2.5ml), NF501 (1ml) NF502 (2,5ml), NF501 (1ml) NF502 (2,5ml), NF501 (1ml) Nitex Filter Size Objective Recommended Filter Media Pore Size 1/2X NM-1000 (1000µm) NM-1000 (1000µm) NM-1000 (1000µm), NM-600 (600 µm) NM-600 (600 µm), NM-300 (300µm), NM-100 (100µm)
-
Page 136: Appendix Viii: Frequently Asked Questions (Faq)
The calibration constants are determined during the manufacturing of the instrument and should never need to be changed. Fluid Imaging Technologies, Inc. uses a proprietary optical calibration device to determine the calibration factor of each objective for every instrument. The only time a unit should be recalibrated is if a major component along the optics path inside the instrument is replaced or damaged. - Page 137 The laser and PMT/Filter set is specified at the time of purchase for each FlowCAM. However, depending on the model of the FlowCAM, it may be possible to upgrade or use other lasers and/or filter sets. At this time, Fluid Imaging Technologies, Inc. builds FlowCAMs equipped with 532 nm or 488 nm lasers.
- Page 138 An example is an oceanographic cruise where the ship is scheduled to visit 10 research stations. At station I, you collect a water sample and analyze it with the FlowCAM. During the transit from station I to station II, you classify all of the particles imaged into species A, B, C, etc.
- Page 139 Filter Dialog window: click Save button, then name and save filter Filter Dialog window: click OK button Close the Library and the View windows To load a filter into the Main window (or use it to filter particles via the View window): Main window: Preferences >...
- Page 140 I. Creating the Classification 1. Main Window > File > Open List 2. Main Window > File > Open Classification Window 3. Classification Window > File > Open Classification 4. Classification Window > Open Classification Dialog > Type the name you want for the Classification, then select Create 5.
-
Page 141: Index
.CTX file extension, 54 Context Setting, 56 Setup and Focus Mode, 73 Context Setting, 64, 137 Change Syringe, 71 Accept Full Screen Particles, 86 Changing Graph Type, 43 Acceptable Region Channel 1, 68 Context Setting, 57 Channel 2, 68 Add To Class, 100 Classes Menu, 111 Add To Library, 100, 114 classification, 65... - Page 142 Manual Prime with Sample, 60 Flow rate, 59 Masked Image Pixel Intensity, 77 ® FlowCAM Masked Pixel Intensity Summary, 9 Setup and Focus Mode, 77 FlowCAM-XPL, 22 Max Raw Images Fluid Volume, 58, 59 Context Setting, 57 - 142 -...
- Page 143 Measurements, 70 Setup and Focus Mode, 76 Microscope Objective, 12 Recalculate, 80 Microsoft Windows 7, 21 Recalibrate Minimum Trigger Pulse Width, 70 Setup and Focus Mode, 76 Modes of Operation, 13 Recalibration, 68 Move to Class, 115 Recalibration interval Multiple Camera Setup, 87 Context Setting, 68 Navigating Collage Pages, 88 Red, Green, Blue Gain, 62...
- Page 144 Show frame rate, 75 Trigger Mode: Fluorescence, 17 Show Menu, 98, 106, 114 Tubing, 58 Show particle count Turn Off FlowCAM Setup and Focus Mode, 75 Shutting Down, 35 Show particles per used image Unit and Laser Power Switches, 12...
-
Page 145: Notes
- 145 -...
Need help?
Do you have a question about the FlowCAM and is the answer not in the manual?
Questions and answers