Table of Contents
Advertisement
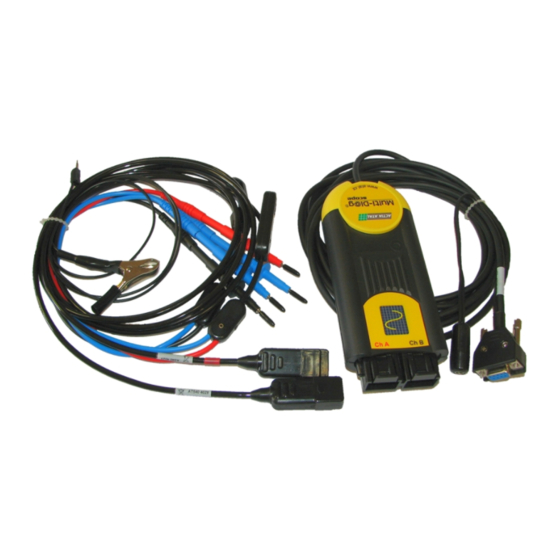
Multi-Diag Scope
since software version – 11.0 EN
USER'S MANUAL
Last updated: April 29. 2016
The right is reserved to change the Manual
ref. T540 0301
ACTIA CZ s.r.o., Lesní 47, 390 01 Tábor - Horky, Czech Republic
Phone: 420 381 410 100; Fax: +420 381 253 043
e-mail: info@actia.cz; web: http://www.actia.cz
Scope_manual_en-v110.docx
Advertisement
Table of Contents

Related Manuals for Actia Multi-Diag Scope

Summary of Contents for Actia Multi-Diag Scope
- Page 1 Last updated: April 29. 2016 The right is reserved to change the Manual ref. T540 0301 ACTIA CZ s.r.o., Lesní 47, 390 01 Tábor - Horky, Czech Republic Phone: 420 381 410 100; Fax: +420 381 253 043 e-mail: info@actia.cz; web: http://www.actia.cz...
-
Page 2: Table Of Contents
CONTENTS CHAP. I - MULTI-DIAG SCOPE BASIC USER’S MANUAL ..................... 4 INTRODUCTION ................................................... 4 SAFETY PRECAUTIONS ..............................................4 AMBIENT CONDITIONS ............................................... 4 IMPORTANT WARNING ............................................... 4 WASTE DISPOSAL ................................................5 PC REQUIREMENTS ................................................5 MULTI-DIAG SCOPE CONNECTION WITH PC........................................5 VARIANTS POWER SUPPLY OF MULTI-DIAG SCOPE ...................................... - Page 3 Contents 5.4.4 ALL CYLINDERS MEASUREMENT ............................................ 61 NOTE FOR FIG. 140 (ACCOUNT OF BUTTON SYNC): ........................................62 5.4.4.2 CONNECTION OF HV SENSOR C4 ........................................... 62 5.4.4.3 DOUBLE COIL MEASUREMENT ............................................62 MANUAL MODE .................................................. 62 AUTO MODE ..................................................63 5.4.5 SELECTED CYLINDER MEASUREMENT ..........................................
-
Page 4: Chap. I - Multi-Diag Scope Basic User's Manual
Chap. I - Multi-Diag Scope Basic User’s Manual INTRODUCTION The Multi-Diag Scope measuring system is designed for the diagnostics and repairs of motor vehicles. It enables to measure and follow the courses of electrical voltage signals or of signals (e.g. current, pressure, ...) which can be conversed in the voltage signal by appropriate sensors. -
Page 5: Waste Disposal
Free RS 232 or USB port MULTI-DIAG SCOPE CONNECTION WITH PC Fig. 1 – Multi-Diag Scope connection through RS 232 to Fig. 2 – Multi-Diag Scope connection through USB using USB- Notebook. Variant 1 (oldest version). RS 232 converter. Variant 1 (oldest version). -
Page 6: Variants Power Supply Of Multi-Diag Scope
Note: All device connectors shall be connected and disconnected with caution and without excessive force! VARIANTS POWER SUPPLY OF MULTI-DIAG SCOPE Fig. 7 – Power supply of Multi-Diag Scope – Variant 1 (oldest Fig. 8 – Power supply of Multi-Diag Scope – Variant 2, VCI version), VCI (vehicle communication interface) module is powered... -
Page 7: Software Installation
SOFTWARE INSTALLATION DESCRIPTION OF INSTALLATION CD AND ITS RUNNING The attached CD contains all the necessary software for the use of Multi-Diag Scope system including the accompanying files such as user’s manuals, prospectuses. Insert the CD in your CD-ROM drive. If the CD does not run automatically, run the MultiScopeInstall program which you will find on the CD. -
Page 8: Program Auto Update
In the case of computer “freezing“ we recommend restarting the computer. 9.4.1 AUTO UPDATE INDICATION ON THE SCREEN When the auto update is in progress in Multi-Diag Scope or in the Motortester module, this state is indicated “Loading firmware“ flashing message - see the cursor in Fig. 12. -
Page 9: Installation Of The Usb-Rs 232 Converter
10.2.1 INSTALLATION OF DRIVERS FOR THE USB-RS 232 CONVERTER P After you have clicked on the “Finish” button to complete the Multi-Diag Scope installation, it is also necessary to pre-install the drivers for the RS232-USB converters. After the start of the installation wizard (see Fig. 16) , as the first step, the search for older (invalid) drivers takes place (see Fig. -
Page 10: Adapter Usb-Rs 232 Final Installation
(Ano/Yes) 10.2.2 ADAPTER USB-RS 232 FINAL INSTALLATION Initiation of the converter installation is conditioned by previous successful Multi-Diag Scope installation. Connect the converter to the PC (insert it into an arbitrary free USB connector) The device has been detected, see Fig. 14. -
Page 11: Technical Specifications
PROGRAM MULTI-DIAG SCOPE START UP To start the program up, click on the Multi-Diag Scope icon on the monitor desktop (see Fig. 24), or on the Multi- Diag Scope option from the „Start\Programs Multi-Diag “ program group (see Fig. 23). -
Page 12: Error Message When Multi-Diag Scope Is Disconnected
Chap. I - Multi-Diag Scope Basic User’s Manual Fig. 23 – Multi-Diag Scope program group (Windows Vista - Start \ Programs \ ...) Fig. 24 – Multi-Diag Scope program icon on the monitor desktop After its activation, the initialization window is displayed and then you can see the Multi-Diag Scope screen Fig. -
Page 13: Information About Software
Fig. 27 – Information about software version (the picture is for illustration, the right is reserved to change the Fig.) CLOSING THE MULTI-DIAG SCOPE PROGRAM Press <Esc> on the keyboard (top left) or click the cross in the running Multi-Diag Scope program to close the program (see Fig. 28) Fig. -
Page 14: Oscilloscope
Notice: The following set of figures describes the independent oscilloscope. The figures were mostly taken from the Multi-Diag Scope 1.00 version, eventually from 4.0, 5.1, 6.1, 7.3 or 10.1 versions. However the description is identical for all versions. ... - Page 15 Fig. 33 – Multi-Diag Scope window after the program is started (figure applies to version 10.1) Note to Fig. 33 - Links to the chapters describing the specific function: 1 ....see Chap. II - Multi-Diag Motortester 2 ....
-
Page 16: Showing/Hiding (Minimizing) The Control Panel
Chap. I - Multi-Diag Scope Basic User’s Manual 14.2.2 SHOWING/HIDING (MINIMIZING) THE CONTROL PANEL The oscilloscope's control panel can be minimized by clicking the white triangle icon (pos.1-Fig. 34). The graph window then fills the entire screen (see Fig. 35). - Page 17 Chap. I - Multi-Diag Scope Basic User’s Manual Maximization icon of the control panel Maximization icon of the control panel Fig. 35 – The oscilloscope's workspace is now significantly larger thanks to the minimization of the control panel. Hovering the cursor near the black arrow (pos.2-Fig. 35): the panel is automatically shown after 2 seconds but it is again automatically hidden after 5 seconds.
-
Page 18: Description Of Individual Parts
Visualization of set oscilloscope parameters, control of cursors and results of cursor measurements Fig. 36 – Description of individual parts of Multi-Diag Scope window in the Oscilloscope mode for two-channel measurement with switched-on cursors (figure applies to version 7.3) Buttons with no significance for the selected mode will change their appearance (go blind). -
Page 19: Description Of Record Control And Setting
Chap. I - Multi-Diag Scope Basic User’s Manual 14.2.4 DESCRIPTION OF RECORD CONTROL AND SETTING Trigger level position in the Trigger level position within Selected trigger Setting of trigger level displayed window. the entire record mode position of the record. -
Page 20: Description Of The Control And Setting Of A (B) Channel Parameters
Chap. I - Multi-Diag Scope Basic User’s Manual 14.2.5 DESCRIPTION OF THE CONTROL AND SETTING OF A (B) CHANNEL PARAMETERS Information about the probe type connected to the A and B channel input. Input sensitivity setting Note *) Setting of the record Position of channel A record. -
Page 21: Description Of The Control And Setting Of Time Base
Chap. I - Multi-Diag Scope Basic User’s Manual 14.2.6 DESCRIPTION OF THE CONTROL AND SETTING OF TIME BASE Visualization of the size and position of the displayed part of the record within the entire record. Time scale (time base) setting... - Page 22 Chap. I - Multi-Diag Scope Basic User’s Manual Fig. 42 – Waveform prior to the use of the Invert function (the screen Fig. 43 – Waveform after the use of the Invert A function (the shot is taken from the 10.1 version for illustration channel A inverted) Fig.
-
Page 23: Cursor Measurements
Chap. I - Multi-Diag Scope Basic User’s Manual 14.2.8 CURSOR MEASUREMENTS Left cursor position. Right cursor position. Time distance of cursors. Cursor position towards the record start. Control of right cursor position. Switching on/off of cursor measurements. Control of left cursor position. -
Page 24: Description Of The Function Of Other Control Buttons
Chap. I - Multi-Diag Scope Basic User’s Manual 14.2.9 DESCRIPTION OF THE FUNCTION OF OTHER CONTROL BUTTONS Information about course recording state. Automatic setting of oscilloscope parameters according to the course character of input signal. The button starts/stops course recording. -
Page 25: Control Of Oscilloscope Parameters By The Mouse Or Pointer In The Case Of Touch Screen
Chap. I - Multi-Diag Scope Basic User’s Manual 14.2.10 CONTROL OF OSCILLOSCOPE PARAMETERS BY THE MOUSE OR POINTER IN THE CASE OF TOUCH SCREEN This green field and all blue-circled arrows can be moved with the cursor (controlled by the mouse or pointer) and in this way oscilloscope parameters can be set. -
Page 26: Saving Waveforms
Chap. I - Multi-Diag Scope Basic User’s Manual This green field corresponding to the position and size of the displayed record can be also moved directly by the mouse cursor. By placing the mouse cursor on the arrow and left-clicking, the... -
Page 27: Opening Waveforms
Chap. I - Multi-Diag Scope Basic User’s Manual Fig. 52 – Waveforms saving (figure applies to version 10.1) Fig. 53 – Naming the actual waveform or leaving the suggested filename and saving the file It is no longer necessary to switch the oscilloscope into the STOP mode prior to saving the displayed waveform. - Page 28 Chap. I - Multi-Diag Scope Basic User’s Manual If there is only one waveform, it is marked as “E” As it is possible to display only two registered waveforms at once, the button for opening another waveform becomes blocked (does not respond to a mouse click) if two waveforms are already opened (see Fig.
-
Page 29: Removal Of The Stored Waveforms From The Screen Only
Chap. I - Multi-Diag Scope Basic User’s Manual 14.2.13 REMOVAL OF THE STORED WAVEFORMS FROM THE SCREEN ONLY If only one registered waveform is displayed (see Fig. 61) and you press the button, the waveform is immediately deleted (see Fig. 62). -
Page 30: Printing Of Displayed Waveforms
Chap. I - Multi-Diag Scope Basic User’s Manual Note: This button is shown only if you have chosen to display two registered waveforms Fig. 65 – Deleting all saved and displayed waveforms Fig. 66 – Terminating the function of waveform deletion 14.2.14... -
Page 31: Oscilloscope User Setup Saving / Loading
Chap. I - Multi-Diag Scope Basic User’s Manual Fig. 69 – Sample of printed document 14.2.15 OSCILLOSCOPE USER SETUP SAVING / LOADING Maximum 10 oscilloscope settings are possible to save by user. Remark: The function is not supported in HV measurement! The saving steps (Fig. - Page 32 Chap. I - Multi-Diag Scope Basic User’s Manual Fig. 70 – Saving the oscilloscope user setup Fig. 71 – Choose one of the ten positions for saving the setup or click the right mouse button to rename it You can rename the original setup name by right-clicking the relevant button (see Fig. 71). the setup in a newly opened window (see Fig.
- Page 33 Chap. I - Multi-Diag Scope Basic User’s Manual Fig. 75 – When you click this option, you can save the setup e.g. to Fig. 76 – Name your setup (e.g. Test) and save the change your Hard-Disk USER SETUP LOADING OPTIONS Run the user setup loading function by clicking the button (see Fig.
-
Page 34: Description Of Control Buttons
Fig. 81 – Description of control buttons 14.2.17 DESCRIPTION OF SELECTED FUNCTIONS The Multi-Diag Scope window uses English names, descriptions and messages. Hereinafter their meanings are defined. – The menu of functions for the control of record triggering (see Fig. 38). -
Page 35: Example Of Using The Mode For Opening Both Channels (Two-Pole Coil)
Chap. I - Multi-Diag Scope Basic User’s Manual – The position of a place within the entire recording where the synchronization of the Trigger position input signal record is carried out during its transition through the trigger level. The position is expressed in percentage (0% ~ synchronization at the record start, 50% ~ synchronization in a half of the record). - Page 36 Chap. I - Multi-Diag Scope Basic User’s Manual 1sth driving signal 1sth driving signal 2nd driving signal 2nd driving signal Fig. 84 – By changing the launching channel it is possible to Fig. 85 – By using the launching from both channels it is possible...
-
Page 37: Error Messages
(see Fig. 87) Bad probe on channel warning message is displayed if other probe is connected (see Fig. 88) Fig. 87 – Multi-Diag Scope as voltmeter when no measurement Fig. 88 – Multi Diag Scope as voltmeter when bad measurement probe is connected (figure applies to version 7.2.4) -
Page 38: Amperemeter
MAX voltage values. Fig. 89 – Multi-Diag Scope in the Voltmeter mode with the visualization of the minimum and maximum values of measured voltage (figure applies to version 7.2.4) 14.4 AMPEREMETER The current probe plugged into connector Ch-B is required for the measurement (see Fig. 90) Fig. -
Page 39: Current Probe - 5/50 A
Extended measuring jaws allow measurements in tight spaces. The probe is powered directly from Multi-Diag Scope, so there is no need to use a battery. The switch on the current probe is used for switching from 5 A / 50 A ranges. -
Page 40: Ohmmeter
Resetting of current probe MAX current values and MAX current values offset Fig. 94 – Multi-Diag Scope in the Amperemeter mode with the visualization of the minimum and maximum values of measured current (figure applies to version 7.2.4) 14.5 OHMMETER The oscilloscope cable (probe) Channel A plugged into connector Ch-A is required for the measurement (see Fig. -
Page 41: Probe Contact Resistance Zeroing
Switch-over to the Switch-over to the Resetting of contact diode test mode resistance conductivity test resistances of the measurement mode mode measuring probe Fig. 96 – Multi-Diag Scope in the Ohmmeter mode (figure applies to version 7.2.4) — 41 — Scope_manual_en-v110.docx... -
Page 42: Conductivity Test
“Circuit open” is displayed over 15 Ohm Fig. 99 – Multi-Diag Scope in the conductivity test mode (figure applies to version 7.2.4) 14.5.4 DIODE MEASUREMENT Diode test – it is designed for the control of the semiconductor junction of diodes both in the forward and reverse directions. -
Page 43: Measurement On The Hv Coil - Secondary Winding (Since Sw Version - 11.0)
Chap. I - Multi-Diag Scope Basic User’s Manual Fig. 100 – Multi-Diag Scope in the diode test mode (figure applies to version 7.2.4) MEASUREMENT ON THE HV COIL – SECONDARY WINDING (SINCE SW VERSION – 11.0) 14.6 The measuring is carried out by means of HV sensors that are connected to HV cables or to the ignition module. -
Page 44: Hv Sensor C1 (At111 4017) + Hv Reference Cable (At 111 4056)
Chap. I - Multi-Diag Scope Basic User’s Manual 14.6.2 HV SENSOR C1 (AT111 4017) + HV REFERENCE CABLE (AT 111 4056) Option for Multi-Diag Scope HV probe C1 is used for measuring of the high voltage on the spark plugs by fitting the vehicle HV cable – see Fig. 103. -
Page 45: Signalling That Saturation Areas At The Input Have Been Reached
Chap. I - Multi-Diag Scope Basic User’s Manual Switchable sensitivity Higher sensitivity (see pos 1) curve monitoring on ignition modules Lower sensitivity (see pos 2) curve monitoring on ignition cables Fig. 106 – Switchable sensitivity on the HV Touch sensor 14.7... -
Page 46: Universal Interconnection Kit
T-adapter Adapter The set includes several adapters allowing connecting an Multi-Diag Scope to the measured element or cabling connector. The measured element can be disconnected from or connected to the circuit, and the measurement may be performed during its functioning, i.e. for example during a driving test. -
Page 47: Print Queue Preview
Chap. I - Multi-Diag Scope Basic User’s Manual Fig. 111 – Main print queue window 1 - States the current number of records in a print queue 2 - Button used for printing the entire print queue on a printer – printing will be performed on a default printer (the one which is set as the default printer in your Windows operation system). - Page 48 Chap. I - Multi-Diag Scope Basic User’s Manual Individual items are separated by horizontal line and display only the information to be actually printed. There are three control buttons for each item: Enables or disables printing of the item Enables modifications to a comment for...
-
Page 49: Chap. Ii - Multi-Diag Motortester
MOTORTESTER PROGRAM INITIALIZATION After installing the Multi-Diag Scope program (see Chap. I - 9.2), connecting the Motortester module (see Chap. I - 2) and starting up the program (see Chap. I - 12), the application can be initialized by clicking on the “M“ icon (see the cursor in Fig. -
Page 50: Error Message When Multi-Diag Scope Is Disconnected
Spark ignition engine measurement, see Chap. I - 5 b) Diesel engine measurement, see Chap. I - 6 ERROR MESSAGE WHEN MULTI-DIAG SCOPE IS DISCONNECTED If the motortester is not connected, an error message regarding this problem will be displayed (see Fig. 116) Fig. -
Page 51: Advance Meter
Chap. II - Multi-Diag Motortester Fig. 117 – Spark ignition engine measuring menu ADVANCE METER The Advance Meter function can be used to measure speed, ignition advance and oil temperature. Measured values are displayed on the screen (see Fig. 118). Fig. - Page 52 Chap. II - Multi-Diag Motortester Fig. 120 – Stroboscope keyboard Button for switching ON/OFF the auxiliary source of light Button for the positive movement of the mark on the engine pulley (to detect the advance) Button for the negative movement of the mark on the engine pulley (to detect the advance) If you press the button (e.g.
-
Page 53: Voltage And Current Measuring
Chap. II - Multi-Diag Motortester Button for selecting the inductive sensor Button for selecting the semiconductor sensor Button for selecting the stroboscope Fig. 122 – Buttons for the selection of crankshaft position sensors If no speed measuring sensor is connected, it is not possible to measure the advance. Error messages (such as ”Faulty sensor“).will inform you about this fact. -
Page 54: Measurement On The Hv Coil - Primary Winding
Chap. II - Multi-Diag Motortester Because two current sensors can be connected simultaneously to the Motortester, you can select these sensors by pressing the buttons and switch them over. If a single sensor is connected, buttons for the current sensor selection are not available. -
Page 55: Primary Winding Voltage
Chap. II - Multi-Diag Motortester Fig. 124 – Coil primary winding measurement menu 5.3.1 PRIMARY WINDING VOLTAGE If you confirm the first option, you will see the voltage course on the coil primary winding displayed in the form of an oscilloscope course (the motortester is switched over to the oscilloscope mode). To return to the motortester mode, click on the Motortester tab (see the cursor in Fig. -
Page 56: Measurement On The Hv Coil - Secondary Winding
Chap. II - Multi-Diag Motortester Fig. 126 – Dwell angle measurement Note to Fig. 126: Missing button see Chap. I - 15 - PRINT QUEUE MEASUREMENT ON THE HV COIL – SECONDARY WINDING This menu contains high voltage measurement on spark plugs of the car. The measuring is carried out by means of HV sensors that are connected to HV cables or to the ignition module. -
Page 57: Hv Sensor (At111 4007)
Chap. II - Multi-Diag Motortester Fig. 128 – HV sensor N (AT111 4018) 5.4.1.2 HV SENSOR (AT111 4007) For ignition systems containing ignition coil, distributor and HV cables. Connection examples can be found at Fig. 129. HV sensor C4 Fig. 129 – HV sensor C4 (AT111 4007) 5.4.2 HV MEASUREMENT SYNCHRONIZATION If you measure on one cylinder (see Fig. -
Page 58: Probe Connection For One Cylinder Measurement
Chap. II - Multi-Diag Motortester 5.4.2.1 PROBE CONNECTION FOR ONE CYLINDER MEASUREMENT HV sensor N Probe grounding Ignition sensors N2 (black color) Fig. 130 – HV measurement on one cylinder - twin-spark coil with cables (HV probe type N and black ignition probe of type N2) HV sensor N Probe grounding Ignition sensor N2... - Page 59 Chap. II - Multi-Diag Motortester HV semsor N Probe grounding Ignition sensor N2 (grey color) Ignition sensor N2 (black color) Fig. 133 – HV measurement on all cylinders - system with distributor (HV probe type N and double ignition probe type N2) HV sensor C4 Ignition sensor N2 (grey color)
-
Page 60: Measurement Of Spark Voltage On The Reference High-Voltage
Chap. II - Multi-Diag Motortester 5.4.2.3 MEASUREMENT OF SPARK VOLTAGE ON THE REFERENCE HIGH-VOLTAGE In case when very accurate values of spark voltage are required High-voltage reference cable (AT111 4056) should be inserted between spark and its cable. The appropriate sensor is then placed on this reference cable (see Fig. -
Page 61: All Cylinders Measurement
Chap. II - Multi-Diag Motortester The displayed course shows the spark burn time and HV peak (ignition) value (2). Fig. 139 – HV oscilloscope measurement– secondary winding on a single cylinder If you enter parameters for the twin-coil ignition with HV cables, two columns will be displayed in the bar chart of the HV for one cylinder. -
Page 62: Note For Fig. 140 (Account Of Button Sync)
Chap. II - Multi-Diag Motortester NOTE FOR FIG. 140 (ACCOUNT OF BUTTON SYNC): In two-spark coils he button switches between spark voltage measured during compression and exhaust phase, respectively. The former (real, useful spark) is higher than the latter. If you press the button, the program goes to the oscilloscope measurement of all high voltages simultaneously (see Fig. -
Page 63: Auto Mode
Chap. II - Multi-Diag Motortester Fig. 142 – After selecting Type of HV coil (Double) a more detailed menu appears. Demonstration of a wrong correction. The polarity of the third (blue) course was selected incorrectly, because the course appears in the negative level. AUTO MODE Selecting this mode (see Chap. -
Page 64: Selected Cylinder Measurement
Chap. II - Multi-Diag Motortester Fig. 145 – Spark voltage bar graph - polarity detected, inversion into Fig. 146 – Spark voltage bar graph - compression/exhaust positive done, compression/exhaust phase unknown phase recognized Fig. 147 – Oscilloscope display of the HV course after the polarity Fig. -
Page 65: Oil Temperature Measurement
Chap. II - Multi-Diag Motortester Cylinder selection buttons Fig. 149 – Selected cylinder measurement The selected cylinder is highlighted in red and displayed under the column of the chart. After pressing the button, you go to the HV oscilloscope measurement. Here a new menu for switching over between cylinders is displayed (see Fig. -
Page 66: Frequency Measuring Oscilloscope
Fig. 151 – Oil temperature measurement FREQUENCY MEASURING OSCILLOSCOPE The visualization and control are the same as those of the Multi-Diag Scope oscilloscope without the Motortester, moreover, the measured signal frequency is displayed in the status bar of the oscilloscope, see Fig. 152. -
Page 67: Diesel Engine Measurement
Chap. II - Multi-Diag Motortester Engine speed Fig. 153 – Engine speed measuring oscilloscope DIESEL ENGINE MEASUREMENT The following measurement group is used exclusively for diesel engines and includes the following types of measurement: Preinjection measurement Simultaneous voltage and current measuring ... -
Page 68: Voltage And Current Measurement
Chap. II - Multi-Diag Motortester Fig. 155 – Preinjection measurement A pressure sensor mounted on the engine injection pipe of the first cylinder is used to scan the fuel transport start. To determine the top dead centre, you can either use the stroboscope, the inductive sensor or the semiconductor sensor. -
Page 69: Oscilloscope
Chap. II - Multi-Diag Motortester OSCILLOSCOPE This function is identical with the function described in Chap. I - 5.6. SPEED MEASURING OSCILLOSCOPE This function is identical with the function described in Chap. I - 5.7. ENGINE AND SENSOR PARAMETER SETTING (MOTORTESTER DEFAULT SETUP) As already mentioned in Chap. -
Page 70: Description Of Buttons In Motortester Setup - Param Menu
Chap. II - Multi-Diag Motortester DESCRIPTION OF BUTTONS IN MOTORTESTER SETUP - PARAM MENU Fig. 158 – Description of buttons for parameter setup 7.1.1 EDIT (SETUP) BUTTONS Change of values of individual menu items is carried out by using arrows situated on the right from the value box. -
Page 71: Confirm (Delete) Buttons
Chap. II - Multi-Diag Motortester Cancelled (10) Setup of HV sensors: (this parameter can only be used with spark ignition engines with double coil). A Auto or Manual can be selected. More see Chap. I - 5.4.4.3 Fig. 161 – After selecting Setup of HV sensors (Auto)- default Fig. -
Page 72: Chap. Iii - Special Tests
SPECIAL TESTS PROGRAM INITIALIZATION After installing the Multi-Diag Scope program (see Chap. I - 9.2), connecting the Motortester module (see Chap. I - 2) and starting up the program (see Chap. I - 12), the application can be initialized by clicking on the “S“ icon (see the cursor in Fig. -
Page 73: Help - Sensor Connection
The first column contains the connector indication that exactly (numerically and graphically) corresponds to the indications on the Motortester (or Multi-Diag Scope). The second column is regularly updated and informs the users whether the sensor is connected or not. If the sensor is connected and is in the correct connector (depending on the measurement type), the connector indication is highlighted in green and the sensor name is written in the second column of the table. - Page 74 Chap. III - Special tests selected measurement highlighted in the list. The active connector has its indication circle in color, inactive connectors (those that are not important for the respective measurement) are grey, see Fig. 170. The option …All connectors … is general – it does not depend on the measurement type and activates all. Connector indication Measurement list Connected probe...
-
Page 75: Switchover To Another Application
This Help functions for both the Motortester and Multi-Diag Scope without the Motortester, but in the latter case there are only two connectors and fewer measurements can be selected. -
Page 76: Chap. Iv - Record Analyzer
RECORD ANALYZER PROGRAM INITIALIZATION After the installation of the Multi-Diag Scope program (see Chap. I - 9.2) and its starting (see Chap. I - 12), the application itself can be initialized by clicking on the tab ”R“ (see the cursor in Fig. 172). -
Page 77: Oscilloscope Time Basis: 1 Ms - 50 Ms
Chap. IV - Record Analyzer OSCILLOSCOPE TIME BASIS: 1 MS - 50 MS NO scanned course is displayed in this mode (see Fig. 174) The course is stored in the oscilloscope memory. You can interrupt the scanning by the repeated clicking on the “Rec“ button (see the cursor in Fig. 173) or by the mouse clicking anywhere in the oscilloscope raster. -
Page 78: Discontinuous Sampling
Chap. IV - Record Analyzer The course is stored directly in the PC operation memory. You can interrupt the scanning by the repeated clicking on the “Rec“ button (see the cursor in Fig. 173) or by the mouse clicking anywhere in the oscilloscope raster. ... - Page 79 Chap. IV - Record Analyzer The course is stored directly in the PC by means of saving individual “screens” (Print Screen, Screen Shot). Then these screens are put together into an animation string. They are NOT LINKED to each other in time (see Pos.
-
Page 80: Description Of Record Analyzer Program Screen
Chap. IV - Record Analyzer Fig. 183 – Basic screen after the record end (oscilloscope time basis setup – less than 1 ms) DESCRIPTION OF RECORD ANALYZER PROGRAM SCREEN 2.3.1 SCREEN WITH CURSORS OFF Fig. 184 – Description of course analyzer screen —... - Page 81 Chap. IV - Record Analyzer .. Setup of number of arrays on the oscilloscope raster (range 1 to 16) for the record jump shift when pressing the button Pos.3 or 6....Back to the record start....Back in jumps (transition in the record depends on the setup according to Pos. 1)....
-
Page 82: Screen With Cursors On
Chap. IV - Record Analyzer 10 - ....Saving of the current record (e.g. Record_26-9_10h33m.rec). The file name is automatically generated depending on the current date and time. Yet, it can be renamed before it has been saved. 11 - .... - Page 83 Chap. IV - Record Analyzer Fig. 187 – Description of the screen when switching the cursors on 16 - .... Button for switching cursor marks off. When you deactivate the button, it changes into (see Pos. 12, Fig. 184). 17 - Button for redisplaying the cursors if they are not visible on the screen any more because of the shift of the registered record (see Chap.
-
Page 84: Cursor Description (Cursor Measuring)
Chap. IV - Record Analyzer 2.3.3 CURSOR DESCRIPTION (CURSOR MEASURING) When you switch the cursors on, press the button (see Pos. 12, Fig. 184) and the look of the information window will change (Pos. 14, Fig. 184 into Pos. 19, Fig. 187) on the screen. The instantaneous values of the intersections of the cursors with the displayed course are displayed in this window.
Need help?
Do you have a question about the Multi-Diag Scope and is the answer not in the manual?
Questions and answers