
Related Manuals for SPL-Laboratory Next-LCD 2015


Summary of Contents for SPL-Laboratory Next-LCD 2015
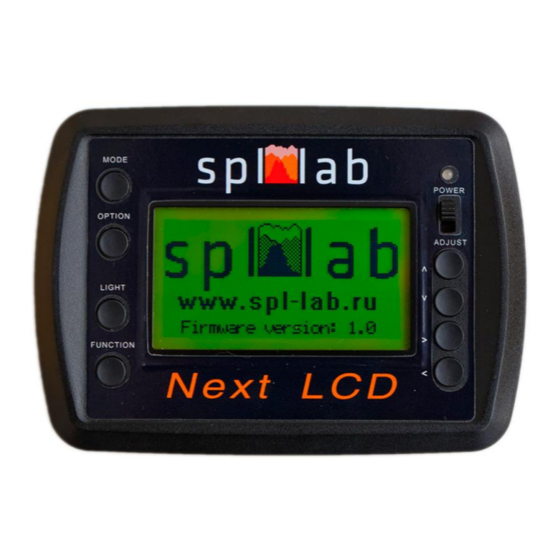
- Page 1 2015 Next-LCD User Manual Multifunctional Portative Spectrum Analyzer Kirill Berezin Spl-Lab 20.02.2015...
-
Page 2: Table Of Contents
Table of Contents Table of Contents ..........................2 General Information ........................3 Ergonomics ..........................4 Package Contents ......................... 4 Working with the device........................5 Important safety information: ...................... 5 Identifying the functional parts of the device: ................6 Charging the battery of the device ....................7 Starting work and configuring the device .................. -
Page 3: General Information
General Information The Next-LCD is a completely autonomous, all-purpose measuring device. All measured characteristics are displayed as digits and graphs on-screen. The closed software environment of the device eliminates inaccurate readings. The device has two Lab-Bus digital bus ports to which the pressure sensors, microphones or power sensors can be connected. -
Page 4: Ergonomics
Ergonomics The Next-LCD device is performed as a monoblock that has graphic display with back light, 8 control buttons, USB port for connecting to a PC and charging the device, two Lab-Bus ports for connecting sensors, two RCA type outputs of the sound signal generator, feed switch and three- coloured LED for indicating status and extent of battery charge. -
Page 5: Working With The Device
Working with the device Important safety information: ! The manufacturer does not bear responsibility for damage caused directly or indirectly as a result of improper device use. ! Before using the device, examine its case for cracks and splits, because any depressurization of the device will result in it’s possible failure. -
Page 6: Identifying The Functional Parts Of The Device
Identifying the functional parts of the device:... -
Page 7: Charging The Battery Of The Device
Element Assignment Display Graphic display with automatic dimming of display backlight Power indicator three-coloured LED for indicating status of the device Feed switch the slide switch for switching the device on/off. MODE button for switching the device operation modes LIGHT button switching the display backlight on/off. -
Page 8: Connecting To Pc Via The Usb Port
Use the Up and Down buttons for changing the menu entry. Use the Left and Right buttons for changing the value of selected menu entry. Port 1 – selecting the type of sensor, connected to Lab-Bus 1 port Port 2 – selecting the type of sensor, connected to Lab-Bus 2 port ... -
Page 9: Operation Modes
Operation modes In the Next-LCD device, several operation modes are provided. Current mode is indicated in the upper left part of the display. Modes are changed cyclically using the MODE button. Apart from the general operation modes, there are measuring modes. Each measuring mode has a unique algorithm for conducting measurements. -
Page 10: The Generator Mode Gen
The generator mode GEN The generator mode is intended for playing back test signals of different waveforms. The generator can work in a background mode alongside the process of measuring, even after exiting the mode. For switching the background mode off, it is necessary to return to the “GEN” mode. Use the Up and Down buttons for changing the menu entry. -
Page 11: Spl Measuring Mode
SPL Measuring Mode The SPL mode is intended for measuring the sound pressure level of low frequency sound signals. The analysed length of the signal equals to one second. The resultant value of the sound pressure level is calculated from several spectral components for each analysed part of the signal separately. -
Page 12: Signal Waveform
Signal waveform “40 Hz” is the section displaying the current frequency “S=1” shows the scale of the displayed signal. It shows the number of signal parts displayed. For changing the scale, use the Right and Left buttons. “THD=4.8%” is the harmonic distortion coefficient value of the signal ... - Page 13 “Time: 30” is the set duration of measurement. For changing the duration, use the Up and Down buttons. Measurement is held in the peak hold mode.
-
Page 14: Avg Measuring Mode
AVG Measuring Mode The AVG mode is intended for measuring the time-average sound pressure level of low frequency sound signals. The analysed length of the signal equals to 1/2 second. Current value of the sound pressure level is calculated from several spectral components separately for each analysed part of the signal. -
Page 15: Rta Measuring Mode
RTA Measuring Mode The RTA mode is intended for measuring different sound signal characteristics through the entire audible frequency range. The analysed length of the signal equals approximately to 1/5 second. In the RTA mode, the amplitude of the spectral peak component, coefficient of harmonic distortion and frequency-response ripple of the analysed signal can be measured. -
Page 16: Signal Waveform
Signal waveform “102.08 Hz” is the section displaying the current frequency “S=14” shows the scale of the displayed signal or number of parts of the signal displayed. For changing period, use Left and Right buttons. “THD=10.8%” – the harmonic distortion coefficient value of the signal... -
Page 17: Pwr Measuring Mode
PWR Measuring Mode The mode used for measuring power characteristics such as voltage, current, power, frequency, impedance and harmonic distortion coefficient. Measuring the characteristics of both direct and alternating current circuits with frequency up to 15,000 Hz is possible. Before starting the measurement, calibrate the sensors by pressing the FUNCTION button. At the moment of calibration, values at the sensor input should equal to 0. -
Page 18: Description Of The Cd Tracks
Description of the CD tracks The CD included in the Spl-Lab equipment distribution kit alongside with software contains specialised audio tracks with test signals for adjusting a sound system. Consider that these tracks are recorded not in the file form but as tracks in Audio-CD format. For playing back the tracks from the CD, use specialised software or CD player. - Page 19 Sweep-tone: Sweep-tone 20-20,000 Hz Level – 0 dB. Track 81 Track 82 Sine signal with frequency of 100 Hz Track 83 Sine signal with frequency of 200 Hz Track 84 Sine signal with frequency of 1,000 Hz Track 85 Sine signal with frequency of 2,000 Hz...
Need help?
Do you have a question about the Next-LCD 2015 and is the answer not in the manual?
Questions and answers