
Related Manuals for QuantAsylum QA401


Summary of Contents for QuantAsylum QA401
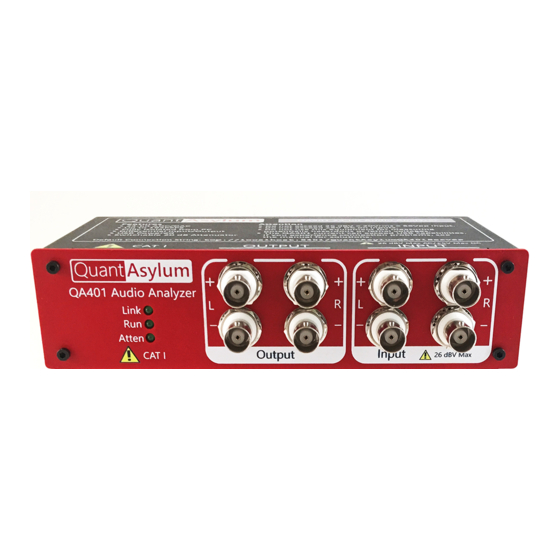
- Page 1 QuantAsylum QA401 User’s Manual QuantAsylum QA401 User’s Manual 192Ksps 24-bit Stereo Audio Analyzer Revision 1.704 January 2019 Page...
-
Page 2: Safety Notice
QuantAsylum QA401 User’s Manual Safety Notice ❖ This device is not designed for working on potentially dangerous voltages. ❖ This device is not designed for working on high energy circuits. ❖ The maximum DC input voltage is +/- 5V into the device inputs. -
Page 3: Table Of Contents
Important Things to Know ..........................6 Ground Reference ............................. 6 BNC Input Voltages ........................... 6 BNC Output Voltages ..........................6 QA401 Output Voltage Offsets, Clicks and Pops ..................6 QA401 Analyzer Features..........................7 Analyzer Front Panel ............................. 7 Front Panel Summary..........................7 LEDs ................................ - Page 4 Acquisition Control ..........................28 Weighting ..............................29 Windowing Functions ..........................30 Measurement Types ........................... 33 Definitions ............................... 33 QA401 Measurement Types ........................34 RMS/Power ............................. 35 THD ................................36 THD Context Menu..........................38 THD + N ..............................40 Frequency Response ..........................40 Generators ..............................
- Page 5 QuantAsylum QA401 User’s Manual Display ..............................50 Other ............................... 51 Test Plugins ..............................54 Keyboard Shortcuts ............................. 56 Troubleshooting ............................56 Connectivity Issues ..........................56 Appendix I: Test Plugins ..........................61 Appendix 2: Visualizers ..........................63 Background ............................. 63 Appendix 3: Software API ........................... 65 Overview ..............................
-
Page 6: Legal
The analyzer PC interface will share a ground with the PC. The audio inputs and outputs, however, are isolated from the PC. This isolation is limited to 50V. Do not connect the QA401 to a product that has its ground reference more than +/-50V from the PC ground. -
Page 7: Qa401 Analyzer Features
QuantAsylum QA401 User’s Manual Also, when changing the sample rate on the QA401, the codecs will be reset to ensure proper application of their changed register settings. That will also generate a click or pop on the outputs. Normally, these clicks and pops won’t present issues. But if you are working on very high-gain stages with speakers or headphones attached, first take the time to familiarize yourself how the various mode changes may impact your equipment under test. -
Page 8: Leds
DVM when you placed the DVM across the outputs. Keep in mind the QA401 inputs have no idea if you are driving a single input with 1Vrms and grounding the other input OR if you are driving both inputs with 0.5Vrms. In both cases, you are hitting the ADC... -
Page 9: Rear Panel Summary
IF YOU GOING TO APPLY A HIGH DC BIAS TO THE QA401 INPUTS, YOU MUST MAKE ABSOLUTELY SURE THE ATTENUATOR IS ENGAGED. SEE THE SECTION ON MEASURING POWER SUPPLY NOISE COVERED IN RMS MEASUREMENTS. -
Page 10: Bnc Outputs
The default state of the input is that the attenuator is engaged. That is, when the device is unpowered, the attenuator is active. When you first connect the device, regardless of UI setting, the attenuator will remain active (attenuating). And when you close the QA401 application or unplug the QA401 hardware, the attenuator will always re-engage. -
Page 11: X32 And X64 Installation
DVM manufacturers. Thus, it’s important to know. 3) Cancel the fixed tone generation and connect the + output L of the QA401 to the + input L of the QA401. Short the – input. -
Page 12: Calibration Adjustments
There might be a few reasons for making changes to the calibration file. First, you might want to tweak for different output impedances. As the QA401 has a 100K AC input impedance, if you are using a source impedance that is 50 or 100K, then it might make sense to keep a calibration file around for Hi-Z equipment and low-Z equipment. -
Page 13: Attenuator Adjustments
You can put in a separate value for left and right if you see fit. If you corrupt the contents of the file, the QA401 software will be unable to parse the contents and it will create a new file, overwriting the corrupt file. -
Page 14: Qa401 Basic Controls
(<0.02 dB). QA401 Basic Controls The QA401 application is shown below. On the left side of the screen is the display area, and on the right side is the control panel. If your screen height becomes limited, you can click and drag anywhere in the control region that there isn’t a control. -
Page 15: Adjusting Knobs
QuantAsylum QA401 User’s Manual Adjusting Knobs Knobs are used to permit quick and accurate adjustment of controls. If you are familiar with pro-audio production software, then the knobs will already be second nature. In these environments, users must deal with literally hundreds of adjustments shown on the screen simultaneously, and an enormous amount of refinement has gone into making them useful. -
Page 16: Context Menus
Control-click on the dBV button yields the following menu: This is a very important concept related to the QA401 interface: Settings related to a particular function are adjusted in a context menu, and that context menu is activated by control-clicking the button. -
Page 17: Control Overview
QuantAsylum QA401 User’s Manual Control Overview There are a few basic control groupings on the analyzer, and these are covered below. Run/Stop Button The Run/Stop button is prominently located at the bottom of the control panel. This button starts and... - Page 18 QuantAsylum QA401 User’s Manual The time button displays the transmitted and captured waveforms in the time domain. With the time and input button pressed, we can see what was captured by the analyzer. Sometimes you can forget that you are looking at the output data. The output data is exceptionally clean and might confuse you into thinking that you are looking at test data from the device under test.
- Page 19 At this point, it’s important to highlight that the QA401 does not operate with constant stimulus tones. The QA401 operates with stimulus bursts. The reason for this is to ensure that the full transaction with the hardware can be treated as a discrete event with a clearly defined start and stop point. Each transaction can start from a known state, and finish in a known state, and if various checkpoints along the way are not met, then the transaction can be counted as flawed and the results can be rejected.
- Page 20 QuantAsylum QA401 User’s Manual The ramp up period of the waveform allows the various output audio stages external to the QA401 to stabilize their DC operating points. This gentle ramp also ensures audible pops are avoided that might harm power output stages.
-
Page 21: Axis
QuantAsylum QA401 User’s Manual Axis The axis controls select our units for the Y axis, and allow us to adjust the X and Y axis settings. Below we see this control groups. The top 3 buttons set our Y Axis units. The dBFS button shows absolute units relative to the ADC and DAC maximum output levels. -
Page 22: Dbr Button And Context Menu
QuantAsylum QA401 User’s Manual gains specified, then the values displayed on the screen will reference the levels on the other side of the gain block, as shown below. The absolute peak levels are reported on the screen regardless of the Y Axis settings. In the case below, you can see the peak levels are also reported in watts because we specified an 8 ohm impedance. -
Page 23: Lin/X Log Buttons And Context Menus
QuantAsylum QA401 User’s Manual There are 4 ways to specify the absolute level from this menu. The first is that you can specify the 0 dB reference point directly by entering the dBV setting that corresponds to the new 0 dBr setting. - Page 24 QuantAsylum QA401 User’s Manual The context menus for both the log and linear settings button allow you to set start and end display frequency. The linear button also allows a center frequency and span to be set Recalling again the Axis controls, the purpose of the default button is to permit you to zoom to your default settings after scrolling or panning the display area.
-
Page 25: Display Panning And Scrolling
QuantAsylum QA401 User’s Manual Display Panning and Scrolling You can zoom to details in the display area using the left mouse button. Click the upper left region you’d like to highlight, and drag to the lower right region. You’ll see a box drawn to show you area that will be zoomed. -
Page 26: Adding Markers
QuantAsylum QA401 User’s Manual The title will appear above the graph region, and below the measurement data. Adding Markers Markers are useful for measuring amplitude differences in signals you see. They are also accessed via the display context menu. The simplest way to add a marker is to hover over the peak of interest and then press the ‘m’... - Page 27 QuantAsylum QA401 User’s Manual look for the nearest trace feature and NOT the current Y value. This means if you are to the right of a tall peak and add a marker, the marker will be added to the tall peak and NOT the current Y position.
-
Page 28: Tracking Markers
QuantAsylum QA401 User’s Manual Tracking Markers Tracking markers are not in the current release. Acquisition Control The acquisition settings determine the resolution of your capture, and also how much filtering is performed. The resolution knob can be adjusted to show the level of detail you require. More detail takes more time to capture. -
Page 29: Weighting
1 KHz and above 4 to 5 KHz or so. On the QA401, weighting can be applied or removed by pressing the A weighting button, or the Off button. When the Off button is selected, then no weighting is applied to the displayed data. When the A button is selected, then the A weighting is applied. -
Page 30: Windowing Functions
Using the input display feature on the QA401, we can look at this in more detail. Using a small buffer (512 samples) and low frequency waveforms, we can see what truncations can do to our data. For these tests, we set the windowing function to Rect (which means no windowing is applied). - Page 31 QuantAsylum QA401 User’s Manual Notice the right side of the waveform above is chopped off. With windowing turned off (Rect), we see the resulting spectrum below. Notice how much energy there is across the entire band, even after 10 KHz. This is due to the truncated waveform.
- Page 32 QuantAsylum QA401 User’s Manual But what if we pick Flat Top windowing? What do we see then? The response looks worse again. What is happening? It turns out that windowing functions are very complex, and you should set them based on what you are trying to measure.
-
Page 33: Measurement Types
Hanning. Flat For accurate amplitude measurements, the Flat Top is the best choice. On the QA401, you’ll generally see less than 0.05 dB of amplitude variation using this selection. -
Page 34: Qa401 Measurement Types
THD+N = 20log(S/N+D)) QA401 Measurement Types There are 4 basic measurements that can be done by the QA401. The measurements require the button to be pressed for the measurement result to be displayed. This is done for two reasons. First, each measurement takes time to perform. -
Page 35: Rms/Power
QuantAsylum QA401 User’s Manual isn’t germane to the topic at hand can cause confusion. So, for this reason, you should only the measurements you wish to display, especially if you are going to share the data with others. RMS/Power The RMS (formerly Pwr) button refers to the power measurements. When this button is selected, the power will be computed across the specified measurement start and stop span. -
Page 36: Thd
A common measurement is to measure the noise floor of an output circuit. If the output circuit has a voltage in the range of +/-5V, then the measurement can be made directly on the QA401 by applying the voltage to the BNC input terminals without regard for attenuator setting. Most line-level opamp amplifiers and battery powered headphone amps fall into this category. - Page 37 QuantAsylum QA401 User’s Manual In the plot above, we can see the second harmonic is about -107 dB below the fundamental. If we use markers, we can see this a bit easier below. The THD function will sum the harmonic powers all the way up to the specified Measurement Stop.
-
Page 38: Thd Context Menu
QuantAsylum QA401 User’s Manual One thing to keep in mind is that the Measurement Stop value sets the upper harmonic to be considered. If you are looking at a 1 KHz signal, then a 20 KHz stop value means you will look at all harmonics up to the 20 harmonic in your THD calculation. - Page 39 QuantAsylum QA401 User’s Manual Because the fundamental selection is so important, it’s important that you can readily see what the software has selected for the fundamental frequency. Notice below that a small green ‘F’ has been drawn near the X axis. This way you can be certain that the software is picking up the peak you want, and not some other signal.
-
Page 40: Thd + N
Frequency Response The QA401 offers a quick way to look at the frequency response of a device under test (DUT). This is achieved with the Frequency Response (FR) button. The context menu for the Frequency Response button appears as follows:... - Page 41 Otherwise, the shape of the spectrum will be distorted by the windowing function. If we connect the output to the input of the QA401 and look at the output time spectrum, we can see the impulse response. The plot on the left shows this output zoomed in so that we can see the single...
- Page 42 QuantAsylum QA401 User’s Manual sample impulse. The right plot shows the entire output buffer, and the position of the impulse Looking at the input frequency, we see a flat line at an arbitrary amplitude. The amplitude depends on a variety of settings and the response of the DUT. In the plot below, we are in pure loopback mode.
- Page 43 QuantAsylum QA401 User’s Manual With this new reference point, we can zoom in and see the loopback frequency response of the QA401 at 192Ksps. In the plot below, the 3 dB point is roughly < 1 Hz to nearly 80 KHz. This is easily measured by stopping the capture, and then looking at the values displayed by dragging the mouse cursors on the screen.
- Page 44 FFT sizes and signal averaging. As discussed above, the impulse measurements are most helpful when characterizing circuits wired directly to the QA401. The white noise might be more useful when playing the stimulus through a speaker and capturing it with a microphone.
-
Page 45: Generators
QuantAsylum QA401 User’s Manual Generators The QA401 has two tone generators. Each tone generator has knobs so that the mouse can control the amplitude and frequency settings. This is useful when you are interactively looking at circuit performance and want to change values on the fly. -
Page 46: Imd Measurements
10X slower. IMD Measurements The primary purpose of the dual-tone generators is to permit IMD measurements. While the QA401 doesn’t perform automatic IMD measurements, they are easy to perform manually. A typical IMD test would be the IMD ITU-R test. - Page 47 QuantAsylum QA401 User’s Manual In the plot above, you can see the 19 KHz and 20 KHz tones applied at -7 dBFS, and the resultant mixing product that shows up at 1 KHz, 2 KHz, etc. As the marker shows, the 1 KHz tone is roughly 100 dB below the input tones, and thus the IMD shown is roughly 0.001%.
- Page 48 QuantAsylum QA401 User’s Manual Notice we’re at 48 Ksps sampling rate and 32K FFT, as this gives us less than 1 Hz resolution. The region of interest are the IM products around the 7 KHz tone. Zooming in, we can see these in great detail, thanks to the high resolution FFT in the plot above.
-
Page 49: Power Supply Noise Measurements
The QA401 with the inputs shorted will report a 20 to 20 KHz noise reading of roughly -115 dBV, which is about 1.8 uV. This is the lower bound of power supply noise that can be measured. Typical LDOs will exhibit noise in excess of 50 uV in the audio band, while ultra low-noise LDOs will approach the limits of the QA401 is very rare cases. -
Page 50: Settings
QuantAsylum QA401 User’s Manual Settings The settings menu allows in-frequent settings to be adjusted. General The General dialog is used to adjust the system sample rates. The 192 Ksps will be more demanding on hardware resources, and as a result might not be usable on older or slower systems. -
Page 51: Other
50 mS or more of latency in the path. Because the QA401 operates on bursts, the length of the burst might be not long enough. That is, the burst might not have even arrived back at the input ports when the QA401 expects it. - Page 52 QuantAsylum QA401 User’s Manual The solution here is to increase the previously discussed “constant amplitude” region of the burst (shown below in red). Before the 1.50 release, the only way to increase the constant amplitude region of the burst was by increasing the FFT size. With the 1.50 release and later, the ability to increase the pre- buffer will permit the burst length to grow.
- Page 53 Output Trim Output trim allows you adjust the output offset of the DAC. With the QA401 in the Stop mode, you can measure the output of a BNC (relative to its outer conductor) and you’ll notice a slight offset around 1 or 2 mV.
-
Page 54: Test Plugins
0dBFS, the PC will generate a maximum valued tone, -6 dBV will generate a half value tone, etc. Second, the PC PC audio will start and stop along with the QA401 audio. When the frequency or amplitude is changed on the QA401, either directly or via the API, the change will also happen to the PC audio. - Page 55 QuantAsylum QA401 User’s Manual For example, if you wanted to test THD of an amp while sweeping amplitude from -10 to 0 dBV in 2 dB steps, and from 10 Hz to 20 KHz at 7 points per octave, you’d fill out the THD measurement as follows, hit “start test”...
-
Page 56: Keyboard Shortcuts
QuantAsylum QA401 User’s Manual Keyboard Shortcuts The following shortcuts are available to speed certain operations. The following keys will be useful during your normal work with the analyzer for starting and stopping the analyzer, adding markers, etc. Note that in order for the soft keys to work, the program must have focus. - Page 57 With your selected hub able to support high-speed (480Mbps) USB, then next step is to plug in the QA401 device while the application is not running. After plugging in the QA401, check the Device Manager (type devmgmt.msc at the Start -> Run Menu or Start text prompt) and then expand the Universal Serial Bus Controllers section.
- Page 58 QuantAsylum QA401 User’s Manual If you see something similar to the above, then the drivers has installed correctly. At this point, you can move to Step #3. If the driver has not installed, then you might have heard some tones indicating there was an issue, or a message might have popped up explaining the problem.
- Page 59 Now, start the QA401 application. You should hear the USB connect indications, followed by an indication from the Analyzer Application that it has connected to the hardware. If this does not occur,...
- Page 60 QuantAsylum QA401 User’s Manual unplug and re-plug the QA401. If it still doesn’t connect, then re-boot your machine. For problems beyond that, please contact QuantAsylum support. Page...
-
Page 61: Appendix I: Test Plugins
QuantAsylum QA401 User’s Manual Appendix I: Test Plugins Test plug-ins allow you to write a DLL that can control the QA401 from within the application. This is helpful for performing swept measurements—measurements that are repeated over and over with a single variable changing. - Page 62 QuantAsylum QA401 User’s Manual If you’d like to write a DLL plugin, contact us at the support alias and we can provide some sample code Page...
-
Page 63: Appendix 2: Visualizers
QuantAsylum QA401 User’s Manual Appendix 2: Visualizers Content in this section is taken from http://www.quantasylum.com/content/Home/tabid/40/EntryId/34/Visualizers-and-Examining-the- Residual.aspx Please refer to that post on line for more detail. Background Visualizers are plug-ins you can write that permit the author access to the acquired data for additional processing. - Page 64 QuantAsylum QA401 User’s Manual ShowData() is called every time the host acquires a new frame of data. The basic steps to realize a visualizer are as follows: 1) Using Visual Studio, create a new project that is a DLL 2) Add a reference to the QA400 application 3) In your DLL class, inherit from the QA400NS.IVisualizer...
-
Page 65: Appendix 3: Software Api
/// <summary> Returns the friendly name of the host hardware. In the case of the QA401, this will be "QuantAsylum QA401 Audio Analyzer" without quotes. This function will succeed whether or not the hardware is attached to the PC, but the QA401 application must be running for this to succeed. - Page 66 If 'applyCompensation' is true, then the routine will account for internal delays in the QA401. This will ensure that in loopback mode the phase will be reported as 0 degrees for any frequency between 0 Hz and Nyquist.
- Page 67 SetMuting(QA401.Muting muteState); /// <summary> Generates a continuous tone on the QA401 hardware at the currently selected sample rate. The tone is generated for 'durationMS' milliseconds, and the call blocks during that time /// </summary> /// <param name="amp"></param> /// <param name="freq"></param>...
-
Page 68: Appendix 4: Regulatory Notice
If you measure something that does pose a shock hazard, assume the QA401 will provide little assistance in isolating you from that shock hazard. Test and measurement equipment is exempt from FCC compliance standards because it is used to work on open and unshielded equipment which, by definition, is likely unshielded and not operating as designed with respect to EMI. -
Page 69: Appendix 5: Specifications
QuantAsylum QA401 User’s Manual Appendix 5: Specifications See the QA401 Product Brief located on the QA401 product page on the QuantAsylum web site for the product specifications. Page... - Page 70 QuantAsylum QA401 User’s Manual Page...
Need help?
Do you have a question about the QA401 and is the answer not in the manual?
Questions and answers