
Related Manuals for Funk Amateur FA-VA5


Summary of Contents for Funk Amateur FA-VA5
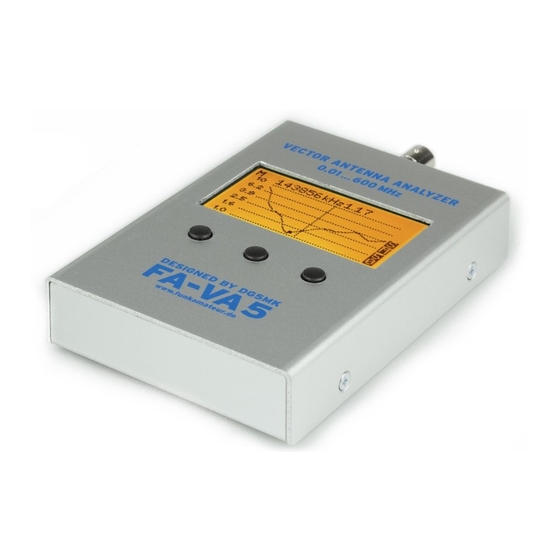
- Page 1 Vector Antenna Analyzer FA-VA5 Kit for an easy to use vector antenna analyzer for use in the frequency range 10 kHz to 600 MHz. Assembly and Operating Manual Ver E 1.0 25.6.2018...
- Page 3 600 accuracy. The FA-VA5 closes this gap. It tance and inductance. MHz, can be purchased at [1]. is the successor to the successful FA-VA4...
-
Page 4: Technical Data
Return Loss Mode Standard: 75 dB to 200 MHz, 45 dB 200 MHz … 500 MHz Any revision of the FA-VA5 Assembly Fast mode: 70 dB to 200 MHz, 40 dB 200 MHz … 500 MHz and User manual will be published as a pdf Frequency stability 0.5 ppm (–30 °C …... -
Page 5: Building Instructions
The front edge of the USB socket then projects slightly beyond the main board to terminate flush with the housing shell. Tin Fig. 1: View of assembled FA-VA5 – Power switched off © Box 73 Amateurfunkservice GmbH 2018 BX-245 • 3... - Page 6 16 solder pads of the USB Board to the main board. USB module Fig. 2: Assembly plan of the FA-VA5 with components to be fitted Fig. 3: Slide switch soldered in the correct Fig. 4: USB interface board correctly posi-...
- Page 7 Display A graphic LCD display with integral LED backlight is used to display the measured data. Both components are already delivered as- sembled as a unit and are only to be sol- dered in certain places. Caution: Make sure the display is flush with the LED backlight so that there is no gap, then pro- ceed to solder all six connections of the two three-pin display contacts on the back...
- Page 8 Socket strips The three socket strips for contacting the LC display are fitted next. The pre-assem- bled display can be used conveniently as a gauge for their orientation. Fig. 6a: Four cardboard strips are used for Fig. 6b: Main PCB view before soldering the female connectors of the LC display; The card- setting the distance between female con- board strips must be pulled out after soldering, also the display is removed (unplugged) nectors and the PCB.
- Page 9 Finally, fit the BNC socket and solder on Fig. 7: FA-VA5 Main Printed Circuit Board: fully assembled the board. Again, this part must sit flush and The start-up welcome message should...
- Page 10 Finally, attach the Instrument type label to charge and there is no battery charging fa- the bottom of the housing! The FA-VA5 is cility in the instrument. Deep discharge now ready for operation and can already makes rechargeable batteries useless and be used in uncalibrated mode.
-
Page 11: Directions For Use
Directions for use Although the FA-VA5 has a relatively is changed in amplitude and phase. This measurements) can alternatively be ob- large range of functions, the operation is change is measured to determine the tained by pressing and holding the middle quite intuitive. -
Page 12: Load Method
Load method (abbreviated to SOL tion leaflet. This data is then entered in the method). FA-VA5 Setup menu (see section Calibra- Three known calibration elements are tion Set Data). Fig. 10: The kit contains a set of calibration measured instead of the test object. - Page 13 tion kit (CKF file). Loading and using the ly compensate for temporary changes in CKF file is described in the Help for the the measurement setup or the parameters VNWA software. due to temperature or other influences. After completion of the calibration, the Caution! Current calibration values are correction values are automatically stored lost when changing the frequency and...
- Page 14 Cal/Port Model Table 2: Selection options in FA-VA5 operating mode Master data for Load, Short and Open (if available) is entered first in Setup, other- Menu item Meaning Return Return to the previous measurement mode wise the Master Calibration will be invalid.
- Page 15 Measurement Options with the The Operating mode allows you to select easy to hear when the lowest SWR is Fig. 15: Single frequency measurement SWR FA-VA5 the most commonly used measurement measured. and display settings in practice. The actual measuring frequency can be set using the three buttons.
- Page 16 tude and phase angle (phi), the reflection shown to the right of the frequency value. loss (dB) and Matching Loss (dB). After pressing the button, you Within the Single Frequency Modes menu can move to ƒ , ƒ etc. (see also section item, Current calibration at the set fre- Setup).
-
Page 17: Sweep Mode
curve indicates the position of the marker (see sub-mode M). Using the middle and Sweep mode The Sweep mode (multi-frequency mea- right buttons, the frequency (sweep) range surement) has three different sub-modes, can be increased or decreased by a factor which are selected via the left button and of 2 (within the available frequency or marked with an icon in the upper left cor-... - Page 18 A new measured value acquisition takes place again when switching to sub-modes 1 or 2 indicated by < or >. The combina- tion of these three sub-modes thus makes it possible in a simple manner to “ap- proach” target frequency ranges during measurements, to narrow them down and to query specific values at relevant points.
- Page 19 Additional Operating modes The FA-VA5 operates as a RF generator Frequency Generator with a square wave output signal at the BNC socket after selecting the menu item Frequency generator. Its peak output voltage is about 1 Vpp to 50 Ω. The actual signal frequency is displayed (Figure 21).
- Page 20 To see these views, select the menu item Data from Memory Screen in opera- Data to and from Memory Previously saved Screen views and/or ting mode (Fig. 21c). The corresponding → Dataset information can be selected here. display memory can be selected with the All measurement modes allow you to save buttons (Figure 22).
-
Page 21: Setup Mode
Table 3: Available Options in Setup mode of the FA-VA5 Setup mode The following Setup options are located in Menu item Meaning a separate menu as they are less frequently Return Return to operating mode used in practice. They are accessible via... - Page 22 DSP settings can be made for mul- ti-frequency measurements (Figure 26a). Fig. 26a: DSP Setup options The options are Fast, Standard and Pre- If you want to personalize your FA-VA5, Callsign cise. you can use this menu item, e.g. to save Note: More accurate measurement re- your call sign (maximum 9 characters).
- Page 23 Off or to Auto mode, as power con- After connecting to a Personal Computer sumption of the graphic display with back- (PC) via USB cable, the FA-VA5 will be light On is relatively high. The switch-on automatically powered from the PC.
- Page 24 Fig. 30: Input option for the correction of the sured frequency minus 26.000000MHz). frequency offset button is again used to select the The FA-VA5 can display the impedance in Impedance Model decimal place. Repeatedly pressing this either of the corresponding measurement...
- Page 25 Analyzer. Then press and is done as follows: hold all three buttons at the same time. – Connect the FA-VA5 to the PC via USB, Now, when the power is switched on, all read and note the assigned virtual COM...
- Page 26 When making antenna results are obtained. legs. If there is an impedance with nega- measurements note that the FA-VA5 is an tive reactance (capacitive), the antenna is “active” analyzer which generates and too short. On the other hand, if the Anten- outputs RF to the antenna under test.
- Page 27 One frequency for the existing test setup. able to read the resonant frequency with frequency. For this purpose, the physical The measurement object is connected di- the best possible accuracy. It should show length can be roughly estimated using the rectly to the selected measurement setup a clear SWR minimum.
- Page 28 VNWA Windows PC Software The VNWA Windows software developed tions of interest in the FA-VA5 (all one- Device Manager. Connections COM & by Thomas Baier, DG8SAQ, for the SDR- port measurements) are easily identified. LPT should show that the Silicon Labs Kits VNWA vector network analyzer can driver is installed.
- Page 29 To do this, put the analyzer in → → USB mode. If this has not already been changed by the user in the FA-VA5 menu (go to Setup USB Auto Mode), the ana- lyzer will automatically switch to USB →...
- Page 30 VN- WA as controlling software, the second tab of this window allows the import of local- ly stored data sets of the FA-VA5 as de- scribed below. Fig. 38: Selection window for data import; in this example only one record was saved on...
- Page 31 39). Then the relevant window can be closed. The final step is to transfer the data from the clipboard to the VNWA memory. The memory relevant for the FA-VA5 should always be S11 (see Appendix 1 at the end of the manual). The transmission takes place via a right-click of a displayed S11 output channel (Figure 40).
- Page 32 may be added. This allows any points of the curve to be “approached” in order to be able to read the measurement frequency and the result accurately. For this purpose, a right click within the grid frame on an empty area is sufficient. This opens a con- text menu as shown in Figure 42.
- Page 33 (instead of the tling time. VNWA calculates the resulting In simple terms, the FA-VA5 in this case locally fixed 100 points) can be specified time for the multi-frequency measure- © Box 73 Amateurfunkservice GmbH 2018 BX-245 •...
- Page 34 FA-VA5. After its ment. The window can be closed here with the default values and all measurement pa- connection and confirmation, a measure- rameters are now defined. ment cycle starts, the circle turns green, with red M in the middle. Similarly, the...
- Page 35 settings according to Fig. 46 apply. Only the value for the SWR calculated from S11 should be displayed in blue. The reflection coefficient is displayed as a red curve in the Smith chart. With regard to the exten- sive further possibilities, reference is again made to the VNWA Help document [2].
- Page 36 The VSWR at this frequency is s = 1.45. We wish you great success and fun in set- ting up and operating the FA-VA5 Antenna Analyzer. shop@funkamateur.de info@sdr-kits.net Fig. 46: The menu Display Setup offers a high degree of flexibility in the selection of the dis- played measurement results;...
-
Page 37: Scattering Parameters
BX-245-SOL for the VNWA-3 Vector Network Analyzer www.box73.de www.box73.som The FA-VA5 Kit and the 600MHz BNC Calibra- hardware, which has a signal output (with re- → tion Kit are also available from SDR-Kits, Office flection sensor) as well as a separate signal in- 11, Hampton Park West, Melksham, SN12 6LH put. - Page 38 Appendix Ver E 1.0 1st edition Version history Ver E 1.1 table 1, page 11, 12 36 • BX-245 36 • BX-245 © Box 73 Amateurfunkservice GmbH 2018...
- Page 39 SHORT-Element OPEN element BX-245 Slide the centre pin with the soldered wire until it clicks into place. Not needed Not needed soldered Carefully soldered Scrape surface metal Slide the centre pin with the wire until it (2 x 2 mm) clicks into place.
- Page 40 Order no. BX-245 Box 73 Amateurfunkservice GmbH When disposing of this product, please observe the Majakowskiring 38 regulations for the handling of electronic waste. 13156 Berlin Electronic devices, batteries and components do not belong in household waste. For further infor- Germany mation please check www.box73.de or 13th July 2018...
Need help?
Do you have a question about the FA-VA5 and is the answer not in the manual?
Questions and answers