Table of Contents
Advertisement
Quick Links
Advertisement
Table of Contents
Troubleshooting

Summary of Contents for jenway 7315
- Page 1 Spectrophotometers Models 7310 & 7315 Operating Manual 731 005 REV D/06-10...
-
Page 3: Safety
Safety Please read this information carefully prior to installing or using this equipment. 1. The unit described in this manual is designed be operated only by trained personnel. Any adjustments, maintenance and repair must be carried out as defined in this manual, by a person qualified to be aware of the hazards involved. -
Page 4: Table Of Contents
Contents Page Safety SECTION 1 - Introduction Instrument description Instrument specification SECTION 2 - Installation Unpacking Installation Display Controls Rear panel Front panel SECTION 3 - Theory and practice of spectroscopy measurements Theory of spectroscopy measurement Spectroscopy measurement Good practice guidelines SECTION 4 - Instrument setup Navigating and screen setup Time and date... - Page 5 6.2.2.4 Using a factor Calibration 6.3.1 Calibrating to a standard 6.3.2 Calibrating to a factor Sample measurement 6.4.1 Measuring a sample after calibrating to a standard 6.4.2 Measuring a sample after calibrating to a factor SECTION 7 - Spectrum Mode specific parameters Method setup 7.2.1 Scan settings...
- Page 6 9.2.1.9 Setting the kinetics measurement time Calibration Sample measurement Data analysis SECTION 10 - Saving, printing and autologging 10.1 Saving methods 10.1.1 Saving methods to internal memory 10.1.2 Saving methods to USB memory stick 10.2 Opening methods 10.2.1 Opening methods from internal memory 10.2.2 Opening methods from USB memory stick 10.3...
- Page 7 12.2.2 Xenon lamp module replacement 12.3 Service SECTION 13 - Troubleshooting 13.1 Error codes 13.2 Troubleshooting guide 13.3 Technical support SECTION 14 - Declaration of conformity SECTION 15 - Glossary of icons Index...
-
Page 8: Section 1 - Introduction
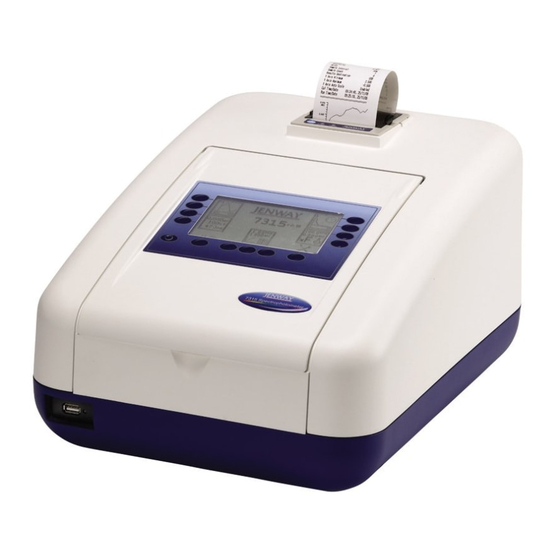
SECTION 1 - Introduction INSTRUMENT DESCRIPTION The 7310 and 7315 spectrophotometers are suited to a wide range of applications in education, quality control, environmental and clinical analysis. The 7310 is a visible spectrophotometer covering a wavelength range from 320nm to 1000nm. The 7315 is a UV/Visible spectrophotometer with a wavelength range from 198nm to 1000nm. - Page 9 7310 7315 Spectrum Range 320 to 1000nm 198 to 1000nm Scan interval Selectable 1, 2 or 5nm Analysis Absorbance or % transmittance and peak and valley wavelengths Other Beam height 15mm Light source Tungsten halogen lamp Xenon lamp Lamp save...
-
Page 10: Section 2 - Installation
SECTION 2 - Installation UNPACKING Remove the 7310 or 7315 from the packaging and ensure the following items are included: 1. Model 7310 spectrophotometer (731 001), or Model 7315 spectrophotometer (731 501) 2. 24V 65W power supply unit (021 060) 3. -
Page 11: Display
7310 09 :02 Fig 2.2.2 – All Power On Tests Complete 1. Instrument check – ensures the validity of the saved parameters 2. Dark test 3. Checks for the accessory fitted. If an active accessory is found the instrument verifies communication and response 4. Self calibration of wavelengths 5. -
Page 12: Controls
CONTROLS The keypad used for these models enables an easy and effective way of navigating the different measurement modes, entering numbers, saving and analysing results. The soft keys are active when an icon is displayed above or adjacent to the key. The only exception to this is the back key which is always active. -
Page 13: Rear Panel
REAR PANEL The image below shows the rear panel on the instrument: Fig. 2.5.1 – Rear Panel 1. Lamp access panel Allows access to lamp when replacement is necessary 2. Power switch On/off switch for the unit 3. Power in socket Connection socket for power supply unit 4. -
Page 14: Section 3 - Theory And Practice Of Spectroscopy Measurements
SECTION 3 – Theory and Practice of Spectroscopy Measurements THEORY OF SPECTROSCOPY MEASUREMENT UV-visible spectroscopy is the measurement of the absorbance of light at a specific wavelength in a sample. This is used to identify the presence and concentration of molecular entities within the sample. The Beer-Lambert law is used to relate the absorption of light to the properties of the sample through which the light is travelling through. -
Page 15: Good Practice Guidelines
Collecting Lens Figure 3.2.1 – Diagram of light path The light from the pre-focused tungsten halogen (7310) or pre-aligned xenon (7315) lamp is focused onto the grating, with 1200 lines per millimeter, which separates the light into discreet wavelengths. The diffracted spectrum of light then passes through a further slit and lens arrangement before passing through the sample in the sample chamber from left to right. - Page 16 10. Cuvettes and sample holders must be filled to a minimum level which covers the light path. All Jenway spectrophotometers have a beam height of 15mm. 11. The instrument must be calibrated to zero absorbance/100% transmittance prior to taking readings.
-
Page 17: Section 4 - Instrument Setup
SECTION 4 – Instrument Setup NAVIGATING AND SCREEN SETUP The main menu screen is displayed below. Kinetics measurement Spectrum mode measurement mode 7310 Concentration measurement mode Photometrics 0 9 : 0 2 measurement Instrument mode settings menu Back key Time and date menu Quantitation measurement mode Fig 4.1.1 – Home Screen To navigate around the spectrophotometer screen press the soft keys adjacent to icons displayed on the... -
Page 18: Time And Date
The measurement settings can be accessed through the utility toolbar displayed on the left hand side of the expanded operating menu. This toolbar provides the same functions in all of the measurement modes. The utility toolbar enables access to printing, print setup options, opening, saving and deleting results and methods and autologging options. -
Page 19: Security And Setting Passwords
SECURITY AND SETTING PASSWORDS 4.4.1 Setting Security Codes The security code function enables a security code to be set to lock the instrument settings and measurement mode settings. The security code is not specific to the user ID but is designed to enable an administrator to control either the instrument or protocols. -
Page 20: Mode Selection
Once the required modes have been selected press the key adjacent to the tick icon to save the changes. The selected measurement modes will be displayed on 7315 the main menu. 09: 02 DIAGNOSTICS The diagnostic function allows simple checks to be 0.00... -
Page 21: Screen Contrast
The user ID function can be accessed through the instrument settings menu by pressing the key adjacent to the user ID icon. Use the keys at the bottom of the screen to select the digit to be changed. Use the keys adjacent to the arrow icons to increase or decrease the number. - Page 22 The time set will begin to count down when there is 0.000 no lamp activity. When the count down is complete the lamp and the fan will be turned off and the lamp save 100.0 icon is shown in all the measurement modes. To bring the instrument out of the lamp save in order to perform a measurement press the key below the lamp save icon.
-
Page 23: Section 5 - Photometrics
SECTION 5 – Photometrics The photometrics measurement mode enables simple measurements of absorbance and % transmittance to be performed. The sample is measured at one wavelength and at one point in time. There are no post measurement calculations available in this measurement mode. MODE SPECIFIC PARAMETERS The photometrics minimal operating menu enables 0.000... -
Page 24: Selecting A Wavelength
The toggle icon enables the large primary display to be set to show the absorbance or % transmittance. To change the primary and secondary displays press the key adjacent to the toggle icon. Repeat presses will cycle the displays between absorbance or % transmittance. 5.2.1 Selecting a Wavelength The wavelength can be adjusted in the expanded operating menu by using the keys adjacent to the... -
Page 25: Section 6 - Concentration
SECTION 6 – Concentration The concentration measurement mode enables simple measurements of absorbance and concentration to be performed. In this measurement mode it is possible to calibrate against a standard of a known concentration or use a known factor. The sample is measured at one wavelength at one point in time. There are no post measurement calculations available in this measurement mode. -
Page 26: Settings
The settings menu is accessed through the expanded operating menu by pressing the key adjacent to the settings icon. In the settings menu press the key below the wavelength icon. 2.008 1.000 pp m 400nm This will open a number entry screen. Use the keys at the bottom of the screen to select the digit to be adjusted. -
Page 27: Changing The Resolution
6.2.2.2 Changing the Resolution The resolution that the concentration is displayed as can be selected from 1, 0.1, 0.01 or 0.001 by repeat presses of the key below the resolution icon in the settings menu. 6.2.2.3 Using a Standard The standard menu enables the value of a standard to be entered. -
Page 28: Calibrating To A Factor
Press the key below the calibrate to zero absorbance 0.000 0.000 ABS or standard icon, this will open another menu with the option to re-calibrate to zero absorbance or to calibrate 0.000 20.000 to the previously entered standard value. Press the key adjacent to the calibrate to standard icon. If the standard selected requires a factor beyond the 09: 02 range of the instrument the check standard icon will... -
Page 29: Section 7 - Spectrum
SECTION 7 – Spectrum The spectrum measurement mode enables measurements of absorbance or % transmittance over a range of wavelengths to be performed. The absorbance or % transmittance at each wavelength is plotted graphically. Post measurement tools such as peaks and valleys analysis and spectral points analysis can be performed. -
Page 30: Method Setup
This function enables the start and end wavelengths of the spectrum scan to be set. Model 7310 has a spectrum range from 320nm to 1000nm; model 7315 has a spectrum range from 198 to 1000nm. To set the start wavelength in the scan settings menu press the key adjacent to the wavelength on the far left of the x-axis. -
Page 31: Setting The Scan Interval
If the start wavelength entered is the same as the end wavelength the end wavelength will automatically be set to be one times the scan interval. For example, if the start wavelength is entered as 500nm but the end wavelength is already set to 500nm and the scan interval is 2nm, the end wavelength will be automatically adjusted to 502nm. -
Page 32: Calibration
To change the maximum absorbance or % transmittance value press the key adjacent to the maximum y-axis value, this opens a number entry screen. Use the keys adjacent to the arrow icons to increase or decrease the number. To change the sign press the key below the + or - icon. -
Page 33: Data Analysis
To stop the scan before completion press the key below 2.500 the scan in progress icon. Confirmation will be needed to stop the sample scan. Press the key adjacent to the cross icon to continue with the scan of the sample or press the key adjacent to the tick icon to confirm -0.500 450nm stopping the scan. -
Page 34: Peaks And Valleys Table
7.5.2 Peaks and Valleys Table This function displays all the detected peaks and valleys A B S above the selected threshold, in tabular form. To open the 4 2 5 1.5 00 - - - - 4 5 0 -- - - 1 .0 00 table press the key adjacent to the peaks and valleys 4 7 5... - Page 35 The wavelength to be analysed can also be entered manually. This can be done in two ways; firstly by pressing the key below the wavelength icon in the spectral points analysis menu. This opens a number entry screen where the wavelength can be input manually. Use the keys at the bottom of the screen to select the digit to be changed and use the keys adjacent to the arrow icons to increase or decrease the number.
-
Page 36: Section 8 - Quantitation
SECTION 8 – Quantitation The quantitation measurement mode enables sample concentrations to be calculated using a standard curve. In this mode a number of standard solutions covering a range of known concentrations are measured at a set wavelength. The absorbance or % transmittance of these solutions is plotted to create a standard curve. -
Page 37: Method Setup
METHOD SETUP 8.2.1 Selecting a Wavelength The wavelength can be changed in the expanded -0.000 operating menu by using the keys adjacent to the arrow icons. Use the keys to increase or decrease the 0.000 wavelength until the required wavelength has been selected. -
Page 38: Changing The Resolution
8.2.2.3 Changing the Resolution The resolution of the concentration can be selected from 1, 0.1, 0.01 or 0.001 by repeat presses of the key below the resolution icon. 8.2.2.4 Selecting Absorbance or % Transmittance The operating mode can be changed between absorbance or % transmittance by pressing the key below the Abs or %T icon. -
Page 39: Creating A New Standard Curve
When the current standard curve is displayed the 0.600 concentration and photometric value of the last sample measured is also displayed on the curve. The curve fit 0.300 algorithm can be changed by pressing the key below the curve fit icon. Repeat presses of the key cycles the 0.000 0.00 0.30 ppm... -
Page 40: Calibration
Once this measurement has been performed the standard concentration samples can be measured. Remove the cuvette containing the blank solution from the sample chamber and insert the cuvette containing the first standardised solution to be measured. Close the instrument lid and press the key adjacent to the tick icon to take a reading of the standard. -
Page 41: Data Analysis
DATA ANALYSIS In quantitation the data analysis examines the statistics 0.600 of the standard curve and algorithm of the curve fit. The Y = mX+C curve statistics function is accessed by pressing the key 1. 000 0.300 0. 000 r2 = 1. -
Page 42: Section 9 - Kinetics
SECTION 9 – Kinetics The kinetics measurement mode enables the absorbance or % transmittance of an active molecule to be measured over a period of time; for example enzyme analysis of horseradish peroxidase. The absorbance or % transmittance is measured at regular time intervals at a set wavelength over a period of time. The results are plotted on a graph to show the change in absorbance or % transmittance over time. -
Page 43: Method Set Up
METHOD SET UP In this measurement mode all the method set up 3.000 parameters are accessed through the settings menu. To open the settings menu press the key adjacent to the settings icon in the expanded operating menu. -5.000 0.00 10.00 09: 02 9.2.1... -
Page 44: Setting Lag Time Or Start On Level
Use the keys at the bottom of the screen to select the digit to be changed and use the keys adjacent to the arrow icons to increase or decrease the number. To change the sign press the key below the + or - icon. Repeat presses will cycle between + and –. -
Page 45: Changing The Resolution
9.2.1.4 Changing the Resolution The resolution of the concentration can be selected from 1, 0.1, 0.01 or 0.001 by repeat presses of the key below the resolution icon. 9.2.1.5 Selecting Concentration Units The concentration units can be selected from a number of options: no units, %, ppm, EBC, SRM, mEq/l, mEq, M, mM, µM, nM, U, U/l, U/ml, g/l, mg/l, µg/l, ng/l, g/dl, mg/dl, µg/dl, mg/ml, µg/ml, ng/ml, µg/µl, ng/µl, mol/l, mmol/l. -
Page 46: Selecting A Wavelength
9.2.1.8 Selecting a Wavelength To adjust the wavelength press the key adjacent to the wavelength icon. This will open the number entry screen. Use the keys at the bottom of the screen to select the digit to be changed and the keys adjacent to the arrow icons to increase or decrease the number. -
Page 47: Data Analysis
If a start on level has been set the Abs/%T icon is 2.500 displayed in the centre of the screen. The instrument will take photometric readings until the start on level is reached. Once the absorbance/% transmittance level has been reached the readings will be plotted on the graph. -0.500 450nm 09: 02... - Page 48 time lines appear as two vertical lines. The line which is 3.000 selected is represented by a dashed line ---- and can be 0.000 moved using the keys below the greater than (>) or less 1.000 than (<) icons at the bottom of the screen. Move the 0.152 0.152 dashed line to the point on the x-axis which is to be the...
-
Page 49: Section 10 - Saving, Printing And Autologging
SECTION 10 – Saving, Printing and Autologging The utility toolbar in the expanded operating menu provides access to printing, print setup options, opening, saving and deleting results and methods and autologging options. If the method lock has been activated the method selection menu is disabled. Print/print settings 0.000 Results selection menu... -
Page 50: Saving Methods To Internal Memory
10.1.2 SAVING METHODS TO USB MEMORY STICK In the expanded operating menu press the key adjacent TEST to the method icon to open the method selection menu. Select the method to save to USB memory stick by pressing the key adjacent to the method location. Use the keys below the arrow icons to move page up or down. -
Page 51: Opening Methods From Usb Memory Stick
10.2.2 OPENING METHODS FROM USB MEMORY STICK In the expanded operating menu press the key adjacent TEST to the method icon to open the method selection menu and use the keys below the arrow icons to move page up or down. Select an empty location to save the method by pressing the key adjacent to the location. -
Page 52: Opening Results
In the expanded operating menu press the key adjacent 1.000 to the USB memory stick icon to open the results selection menu. 0.099 09: 02 If the USB memory stick doesn’t have any results stored on it only the save to USB memory stick icon will be displayed. -
Page 53: Deleting Results
The result will be displayed on the screen. Operating mode Photometrics Operator Id The information displayed is specific to the measurement Method Id Wavelength Sample interval mode which the result was generated and saved in. Sample Count Results Destination Internal Use the keys below the arrow icons to display more Cal Time/Date 10 : 54 : 33 05/07/2010... -
Page 54: Print Setup
10.7.1 Print Setup To open the print setup menu hold the key adjacent to 0.000 the printer icon for 2 seconds in the expanded operating menu. 0.000 09:02 To select the language for the printouts press the key adjacent to English icon. Repeat pressing of the key cycles the language between English, Français, Deutsche, Espânôl and Italiano. -
Page 55: 10.7.1.3 Print Setup - Quantitation
Repeat presses will cycle between 0, 1, 2, 5, 10 or 50. Once the required options have been selected press the key adjacent to the tick icon to save and exit print-set up. 10.7.1.3 Print Setup – QUANTITATION In the quantitation measurement mode print setup menu it is possible to print off the statistics for the standard curve. -
Page 56: Autologging
10.8 AUTOLOGGING The autolog function enables repeat measurements of 0.000 the same sample to be performed with a set time period between each measurement. This produces a batch 0.000 of results for the same sample. The autolog function also enables the results to be autologged to different destinations. -
Page 57: Selecting Result's Destination
CD drive. If the PC software does not auto run open My Computer and double click on the Jenway 73 series software icon. Follow the instructions to install the PC software to the required location. Refer to the PC software manual for further instructions. Once the software is installed, turn the mains power on to the instrument. -
Page 58: Section 11 - Accessories And Spare Parts
SECTION 11 – Accessories and Spare Parts 11.1 OPTIONAL ACCESSORIES Part Code Description of Accessory 660 101 Internal printer 735 401 Automatic 8 cell turret 735 201 Sipper pump 735 301 Peltier 735 701 Combined sipper peltier pump 735 801 10x10mm path length cuvette holder 735 901 16/24mm test tube holder... -
Page 59: Passive Accessories
Squeeze the grey plastic clips together so that the printer top opens. Slot the printer into the top of the instrument and push down until it fits flush to all four sides. Insert the paper roll into the printer – ensuring that there is some paper sticking out of the printer before clicking the grey plastic back into place. -
Page 60: 11.2.3.1 Automatic 8 Cell Turret
11.2.3.1 Automatic 8 cell turret Take the 8 cell turret base plate. Connect the power supply in the bottom of the sample chamber to the connector on the underside of the baseplate. Place the base plate in the sample chamber. Replace screws 1 to 4. Take the 8 cell carousel and place on top of the motor, taking care to align the three ball bearings with the grooves on the motor shaft. -
Page 61: 11.2.3.3 Sipper Pump
11.2.3.3 Sipper pump For this accessory as well as removing the passive accessory base plate, the front panel of the instrument must also be removed. Loosen screws 5 and 6 until the front panel can be lifted out in a forward direction. Take the sipper base plate. -
Page 62: 11.2.3.4 Combined Sipper Peltier Pump
7. Cut a small length of the sipper pump tube and push this over one end of the capillary tube. Connect this to the inlet port of the flow-through cuvette. 8. Route the tube into the two retaining clips located on the base plate at the side of the pump head. -
Page 63: Using The Accessories
11.3 USING THE ACCESSORIES 11.3.1 Automatic 8 cell turret When the automatic 8 cell turret is in use the 8 cell turret 0.000 icon is displayed in the bottom right hand corner of the screen. The current cell position is displayed adjacent to 0.000 the 8 cell turret icon. -
Page 64: Peltier
11.3.2 Peltier When the peltier is in use the peltier icon is displayed in 0.000 the bottom right hand corner of the screen. The current temperature is displayed above the set point temperature 100.0 adjacent to the peltier icon. Below the peltier icon there is an arrow icon to indicate if the current temperature is below or above the set temperature. -
Page 65: 11.3.3.2 Timed Sipper Pump Settings
Confirmation will be needed to start the sipper pump. 0.000 Press the key adjacent to the tick icon to confirm and start the sipper pump. Press the key adjacent to the cross 100.0 icon to cancel and return to the expanded operating menu. - Page 66 To fine tune the amount of sample uptake press the key below the plus or minus icon to increase or decrease the amount of sample taken up. The recorded time will be adjusted accordingly. Once the fine tuning is complete, or if none is required, press the key adjacent to the tick icon to move to the next stage of the calibration sequence.
-
Page 67: Combined Sipper Peltier Pump
To perform a measurement place the sipper tubing into 0.000 the sample and press the key below the sipper pump icon. 100.0 09: 02 Confirmation will be needed to start the sipper pump. 0.000 Press the key adjacent to the cross icon to cancel and return to the expanded operating menu. -
Page 68: Spares
The pump direction is displayed by an arrow icon below the sipper peltier icon. The combined sipper peltier pump combines the functionality of the peltier and sipper pump. To open the sipper peltier settings hold the key below the sipper peltier icon for 2 seconds. The settings menu is the same as the sipper pump settings except for the peltier icon in the top left hand corner. -
Page 69: Section 12 - Maintenance And Service
9. Reconnect the power supply, turn on the unit and ensure that the lamp is illuminated after a few seconds. For further instructions refer to the service manual. 12.2.2 Xenon Lamp Module Replacement This option is only valid for the 7315 spectrophotometers and must be done by an accredited service engineer. Refer to section 12.3 for more details. -
Page 70: Service
Decontamination Certificate. This is available as a downloadable pdf file at www. jenway.com, or contact us and we will be happy to fax you a copy. Please clearly mark the package for the attention of the Service Department and post to the following address:... -
Page 71: Section 13 - Troubleshooting
(caution icon) or fatal (stop icon). If the error is fatal contact your local distributor or Jenway service department (refer to section 12.3). If the error is a warning it may be possible to retry the test. In this case a back icon will also be displayed. The table below shows the error codes:... - Page 72 Err 5 Light Saturation Not Found This error indicates that the peak light hasn’t been found at zero. The most likely causes of this error are: Fatal 1. Lamp failure. 2. Deterioating lamp signal. 3. Sample or cuvette in the sample holder. Solution: Ensure that the sample holder is empty.
-
Page 73: Troubleshooting Guide
13.3 Technical Support Jenway have a dedicated Technical Support team made up of experienced scientists who are on hand to help with any applications advice and questions you may have about our products and how to use them. If you require any technical or application assistance please contact the team at: E-mail: jenwayhelp@bibby-scientific.com. -
Page 74: Section 14 - Declaration Of Conformity
SECTION 14 – Declaration of Conformity... - Page 75 SECTION 14 – Declaration of Conformity...
-
Page 76: Section 15 - Glossary Of Icons
SECTION 15 – Glossary of Icons Mode Icon Description Common Back key Common Tick icon - Done/yes Common Cross icon – Cancel/no Common JW icon - Opens expanded operating menu Common Printer icon - Print/open printer settings Common No results to send to printer Common Computer icon - RS232 serial port for connection to an external serial printer or a computer... - Page 77 Common Calibrate to zero icon Common Pencil icon - Select letter/number Common Eraser icon - Delete letter/number Common AB icon - Change letter case/number Common Delete Common Method icon – opens method selection screen Common Create method Common Open method Common - - - - Units icon –...
- Page 78 Main Menu Instrument settings Main Menu 12.00 Time/date icon Time & Date Clock icon - Set time Time & Date Calendar icon - Set date Time & Date Toggle icon – Switches date format Autolog Autolog icon - Opens autolog menu Autolog Printer icon - Autolog to printer Autolog...
- Page 79 Instrument Diagnostics Settings Photometrics Measure sample Photometrics Toggle icon – switches between ABS/%T Concentration Settings menu Concentration Measure to a factor Concentration Measure to a standard Concentration 0.000 ABS Calibrate to zero absorbance Concentration Calibrate to a standard 0.000 Concentration Calibrate to zero absorbance or standard Concentration Factor menu...
- Page 80 Spectrum Single less than icon - decrease the wavelength by 1 times scan interval Spectrum Double greater than icon - increase the wavelength by 10 times scan interval Spectrum Single greater than icon - increase the wavelength by 1 times scan interval Spectrum Wavelength icon - manually enter the wavelength...
- Page 81 Kinetics Start kinetics measurement Kinetics Kinetics measurement in progress Kinetics Sigma icon - Post measurement statistics Kinetics Kinetics moving line Kinetics Update factor in settings Kinetics Toggle icon – switches between the initial and final point lines Kinetics Double less than icon - Decrease the time by 5 seconds intervals Kinetics Single less than icon - Decrease the time by 1 second intervals Kinetics...
- Page 82 Accessories Skip take up time – uses the previously set take up time Accessories 000 – sets air gap to zero Accessories Stop sipper pump Accessories Reduce sample uptake/reduce air gap Accessories Increase sample uptake/increase air gap Accessories No sipper - Method created on a unit with a sipper accessory fitted Accessories Sipper peltier pump in use Accessories...
-
Page 83: Index
INDEX Page ACCESSORIES Accessories - connecting Accessories - using AUTOLOGGING CONCENTRATION CALIBRATION METHOD SETUP MODE SPECIFIC PARAMETERS SAMPLE MEASUREMENT Connecting to a PC Controls Display Keypad Rear panel Declaration of conformity Error codes Good practice guidelines ICON GLOSSARY Installation Unpacking Instrument setup Contrast Expanded operating menu... - Page 84 Routine maintenance Safety SAVING, PRINTING AND AUTOLOGGING DELETING METHODS DELETING RESULTS OPENING METHODS OPENING RESU LTS PRINTING RESULTS SAVING METHODS SAVING RESULTS Screen setup SERVICE Spare parts SPECTRUM CALIBRATION DATA ANALYSIS METHOD SETUP MODE SPECIFIC PARAMETERS SAMPLE MEASUREMENT Technical specification Technical support Theory and practice of spectroscopy measurements Spectroscopy measurement...
- Page 86 Bibby Scientific Ltd Bibby Scientific France SAS Bibby Scientific Italia Srl Beacon Road Stone ZI du Rocher Vert - BP 79 Via Alcide de Gasperi 56 Staffordshire ST15 0SA 77793 Nemours Cedex 20077 Riozzo di Cerro al Lambro United Kingdom France Milano Italia Tel: +44 (0)1785 812121...
Need help?
Do you have a question about the 7315 and is the answer not in the manual?
Questions and answers