Advertisement
Quick Links
Advertisement

Subscribe to Our Youtube Channel
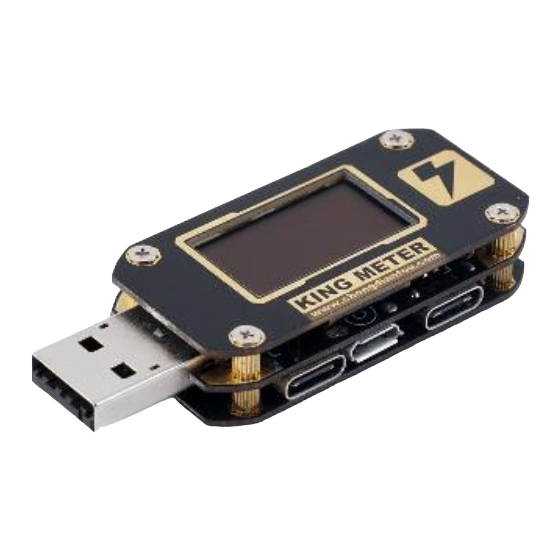
Summary of Contents for King-Meter POWER-Z
- Page 1 Manual V1.0 2017.5...
- Page 2 Right/+ Menu Left Communication port 10.000 VBUS 2.0000 LOAD 20.000 00:00:000 CH1 H 0.0000 0.0000 General Technical Specifications Main Control IC Cortex -M3 72MHz Display screen OLED 128X64 50Hz(Refresh rate 50/s) Internal storage memory About 30 years random storage algorithm life Operating temperature 0-40℃...
- Page 3 Functional Range Resolution Basic errors Technical Specifications VBUS Voltage 0-24V 0.1mV ±0.05%+5d (L) LOAD Current 0-5A 0.1mA ±0.05%+5d (L) Capacity/Power 0-199999Ah/Wh 0.0001mAh/mWh ±0.2% Accumulate 1 time every 100ms, write to memory every 3.6s L 表示采集速度最低时,在主界面观察到的数据 “L” means the data observed at the main interface when sampling low speed Function Features High Internal typical 0.02% accuracy measurement error and typical...
- Page 4 10.000 VBUS Main screen1:Big font Histogram Measurement information 2.0000 LOAD Click enter Gauge measurement screen, Menu button 20.000 00:00:000 press to start or stop continue current storage CH1 H channel measurement 0.0000 0.0000 Left|Right button Switch to other main screen 00:00:000 Time of measurement ,Accumulate the voltage and current data...
- Page 5 5.000V 0.000A Main screen2:Evaluate the line resistance of the charge cables and the line compensate 0.000mΩ ability of power adapter Ignore Menu button GOOD Left|Right button Switch to other main screen Automatic calibrate when current is 0, RDY indicate for ready to test . Connect load to increase current for evaluate the line performance.
-
Page 6: Factory Reset
5.050V 3.001A Main screen5:PD communication monitor screen 5.00V 3.0A Monitor 9.00V 3.0A Switch between monitor or sniff mode Menu button 15.0V 2.0A Source Cap Left|Right button Switch to other main screen Monitor Monitor mode(default) only monitor data packets on CC wires, if CC wires doesn’t 5.050V 3.001A connect will cause... - Page 7 App introduce Online generate curve Dynamic Curve window area draw curve dynamic axis, calculate the display curve maximum and minimum values in the window(Vp-p\Ip-p), Curve will scroll from right to left according to sample time. The figure below displays noise of a standard 2.50000A high fidelity current source, the noise actually is the interior noise of instrument in 100SPS high speed acquisition.
- Page 8 App introduce Offline data fetch and generate curve Cumulative The time axis of curve remain 0, the curve will continuous display curve compress Application The figure below displays charge curve of a power bank case...
Need help?
Do you have a question about the POWER-Z and is the answer not in the manual?
Questions and answers