Table of Contents
Advertisement
IMAGING-PAM
M-series
Chlorophyll Fluorometer
Instrument Description
and
Information for Users
2.152 / 07.06
5. revised Edition: March 2014
imag-m-series0e_3.doc
Heinz Walz GmbH, 2014
Heinz Walz GmbH Eichenring 6 91090 Effeltrich Germany
Phone +49-(0)9133/7765-0 Telefax +49-(0)9133/5395
E-mail info@walz.com Internet www.walz.com
Printed in Germany
Advertisement
Table of Contents

Related Manuals for Heinz Walz IMAGING-PAM


Summary of Contents for Heinz Walz IMAGING-PAM
- Page 1 Information for Users 2.152 / 07.06 5. revised Edition: March 2014 imag-m-series0e_3.doc Heinz Walz GmbH, 2014 Heinz Walz GmbH Eichenring 6 91090 Effeltrich Germany Phone +49-(0)9133/7765-0 Telefax +49-(0)9133/5395 E-mail info@walz.com Internet www.walz.com Printed in Germany...
-
Page 3: Table Of Contents
1.2 Special safety instructions ............2 2 Introduction .................. 3 3 Components of the IMAGING-PAM MAXI-version ....7 3.1 Control Unit IMAG-CG ............9 3.2 LED-Array Illumination Unit IMAG-MAX/L and IMAG- MAX/LR ................11 3.3 CCD Camera IMAG-K6 and objective K6-MAX ....15 ... - Page 4 CONTENTS 5.3.2 Assembling of beam splitter and filters ......52 5.3.3 Mounting of the reflector module ........54 5.4 LED Modules ................. 56 5.4.1 Adjustment of brightness by grey filters ......56 5.4.2 Integration of LED modules into Axio Scope.A1 ....58 5.4.3 ...
- Page 5 CONTENTS 9.1.1.4 Maximal fluorescence yield, Fm ........92 9.1.1.5 Maximum fluorescence yield, Fm' ......... 93 9.1.1.6 Maximal PS II quantum yield, Fv/Fm ......93 9.1.1.7 Effective PS II quantum yield, Y(II) ......94 9.1.1.8 Quantum yield of regulated energy dissipation, Y(NPQ)95 9.1.1.9 ...
- Page 6 CONTENTS 9.5.2 Gain and Damping ............136 9.5.3 Absorptivity ..............137 9.5.4 Slow Induction parameters ..........138 9.5.5 Image Correction .............. 138 9.5.6 Image Transformation ............141 9.5.7 Battery ................141 9.5.8 Display parameters ............142 9.5.9 Go Speed ................144 9.5.10 ...
- Page 7 CONTENTS 10.2.2 Scale ................. 172 10.2.3 Info Icons ................. 173 10.2.4 Mean over AOI ..............173 10.2.5 Define AOI-array geometry ..........175 10.2.6 Create AOI array: ............. 176 10.3 Al-List .................. 178 10.3.1 LED currents / PAR values ..........178 10.3.2 ...
- Page 8 CONTENTS 12.2.9 Mounting Stand with Eye Protection IMAG-MAX/GS ... 193 12.2.10 IMAG-MAX/B.............. 194 12.2.11 ST-101................194 12.2.12 Transport Box IMAG-MAX/T ........194 12.2.13 IMAG-MAX/GWK1 ............. 195 12.3 Components specifically relating to MINI-version ....195 12.3.1 IMAG-MIN/B ..............195 12.3.2 IMAG-MIN/R ..............196 12.3.3 ...
-
Page 9: Safety Instructions
CHAPTER 1 SAFETY INSTRUCTIONS 1 Safety instructions General safety instructions Read the safety instructions and the operating instructions first. Pay attention to all the safety warnings. Keep the device away from water or high moisture areas. Keep the device away from dust, sand and dirt. Always ensure there is sufficient ventilation. -
Page 10: Special Safety Instructions
Never use the Multi Control Unit IMAG-CG with more than one Measuring Head plugged in at the same time. The IMAGING-PAM employs strong blue light for excitation of chlorophyll fluorescence, for driving photosynthetic electron transport and for transient saturation of photosynthetic energy conversion (Saturation Pulse method). -
Page 11: Introduction
Standard-PAM Fluorometers (e.g. Dual-PAM, PAM-2500 or MINI-PAMII), most users already may be accustomed to. Hence, also with all versions of the IMAGING-PAM M-series the characteristic fluorescence levels Fo, Fm and Fm' can be assessed and quenching coefficients derived. Also the PS II... - Page 12 An outstanding feature of the Imaging-PAM distinguishing it from standard PAM fluorometers is the possibility of parallel assessment of several samples under identical conditions. For this applications the MAXI-version is particularly well suited, e.g.
- Page 13 CCD-camera which serves for fluorescence imaging. As the different versions of the Imaging-PAM M-series are optimized for largely different sample sizes, they apply quite different LED sources. While the same methodology applies for all versions, there are very different power requirements for appropriate intensities of measuring, actinic and saturation pulse light.
- Page 14 CHAPTER 2 INTRODUCTION and on the ImagingWin software. While the latter in principle applies to all versions, it also offers some special features that can be used with particular versions only (e.g. RGB-Fit images using the MICROSCOPY/RGB-version). As it is most frequently used and also featuring the widest range of applications/configurations, there is some emphasis on the MAXI-version in this manual.
-
Page 15: Components Of The Imaging-Pam Maxi-Version
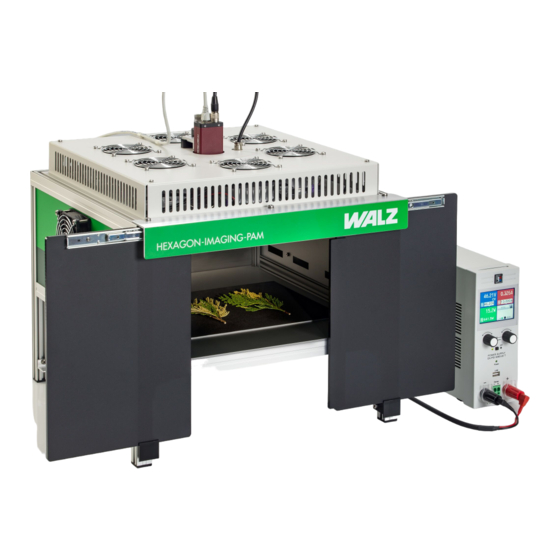
In the following chapters the three different versions: the MAXI-, MINI- and Microscopy-version of the Imaging-PAM M-series are described. As the MAXI-version is most frequently used, those components that are common to all versions are dealt with in this chapter on the MAXI-version. - Page 16 CHAPTER 3 COMPONENTS OF THE MAXI-VERSION Fig. 1: Transport Box IMAG MAX/T provided with each of the basic Imaging systems offers enough space for all essential components (except PC) For transport of components 1 - 4, as well as of all essential cables, the Transport Box IMAG-MAX/T is provided.
-
Page 17: Control Unit Imag-Cg
MICROSCOPY-Heads (MINI- and RGB-sockets at the backside of the instrument). The Control Unit provides the power for driving the LED-Arrays of all members of the M-Series systems except the MAXI-IMAGING-PAM, which is driven by an external 300 W Power Supply. Note: Never switch on the Control Unit IMAG-CG with more than one Measuring Head connected at the same time. - Page 18 12 V battery cannot recharge the internal 14.4 V Li-ion battery. Note: Please avoid charging the internal Li-ion battery while the IMAGING-PAM is switched on. Socket for connecting LED-Array Illumination Unit MAXI-HEAD IMAG-MAX/L (MAXI-Head). Socket for camera cable via which trigger signals...
-
Page 19: Led-Array Illumination Unit Imag-Max/L And Imag- Max/Lr
CHAPTER 3 COMPONENTS OF THE MAXI-VERSION LED-Array Illumination Unit IMAG-MAX/L and IMAG- MAX/LR Fig. 3: Front view of IMAG MAX/L with objective lens of CCD-camera protruding through central opening The LED-Array Illumination Unit IMAG-MAX/L features 44 high-power royal-blue (450 nm) LED-lamps equipped with... - Page 20 CHAPTER 3 COMPONENTS OF THE MAXI-VERSION A useful accessory for measurements with mirroring samples (like multiwell plates filled with algae suspensions) is the Filter Plate IMAG-MAX/F that absorbs the small fraction of red light contained in the blue LED light. This plate can be mounted with 4 screws at the front side of the Illumination Unit.
- Page 21 CHAPTER 3 COMPONENTS OF THE MAXI-VERSION Fig. 5: IMAG MAX/L in conjunction with IMAG MAX/GS and mounted CCD camera IMAG MAX/K6 On the top side of the Illumination Units a fan is located that serves for cooling the aluminum plate on which the slugs of the high- power LEDs are mounted.
- Page 22 CHAPTER 3 COMPONENTS OF THE MAXI-VERSION Warning: When used without Mounting Stand and Eye protection, the user should avoid looking directly into the LED-Array Illumination unit. The user is urgently advised to ensure an alternative eye protection, which is effective in applications where the standard IMAG-MAX/GS cannot be applied.
-
Page 23: Ccd Camera Imag-K6 And Objective K6-Max
CHAPTER 3 COMPONENTS OF THE MAXI-VERSION Note: In the LED-Array Illumination Unit an Adapter Ring may be inserted, (not screwed). To avoid damage to the instrument, please do not pull the Imag-MAX/L out of the box by using this hole as a handle. CCD Camera IMAG-K6 and objective K6-MAX Fig. - Page 24 CHAPTER 3 COMPONENTS OF THE MAXI-VERSION thus providing outstanding sensitivity. This feature is particularly useful for reliable assessment of the "dark fluorescence" parameters Fo, Fm and Fv/Fm. Note: The aperture of the IMAG-K6 standard lens can be closed. This increases the depth of focus, but decreases the signal intensity. For plane objects, the setting of the aperture should always completely open.
-
Page 25: Ccd Camera Imag-K7 And Objectives K7-Max/Z And K7- Max/S
CHAPTER 3 COMPONENTS OF THE MAXI-VERSION effective focal length by plane-parallel glass plates). For other M- series instruments like the MICROSCOPY-Version and the GFP MINI-Version this filter has to be removed before mounting the camera. Fig. 8: Cosmicar-Pentax objective 12.5 mm focal length, short pass filter and mounting device (left), distance ring (middle) CCD Camera IMAG-K7 and objectives K7-MAX/Z and K7- MAX/S... - Page 26 CHAPTER 3 COMPONENTS OF THE MAXI-VERSION a Zoom objective lens with 8 – 48 mm focal length (F=1.0 - K7-MAX/Z Fig. 10). Different mounting angles The adapter ring in the LED-Array Illumination Unit (IMAG-MAX/L) has to be detached for using the Zoom objective. Fig.
-
Page 27: Mounting Stand With Eye Protection Imag-Max/Gs
CHAPTER 3 COMPONENTS OF THE MAXI-VERSION remains focused when changing focal length (magnification). Minor adjustment by the focusing ring may be required. Fig. 10: CCD Camera with Zoom objective Mounting Stand with Eye Protection IMAG-MAX/GS The Mounting Stand IMAG-MAX/GS provides the standard means for mounting the powerful LED-Array Illumination Unit at defined distance to the object, assuring full eye protection of the user. - Page 28 CHAPTER 3 COMPONENTS OF THE MAXI-VERSION Fig. 11 IMAG-MAX/GS with mounted LED-Array Illumination Unit IMAG-MAX/L and CCD-Camera Using this Mounting Stand, the Illumination Unit and the CCD- camera are coupled with each other at a fixed working distance of 18.5 cm between LED-Array and object plane, resulting in homogenous illumination of an imaged area of 10 x 13 cm.
- Page 29 CHAPTER 3 COMPONENTS OF THE MAXI-VERSION Fig. 12: IMAG MAX/GS with lifted red-perspex hood showing leaf sample resting on x-y stage In standard applications, the sample is resting on an x-y stage covered with non-fluorescent and non-reflecting black foam-rubber. The sample compartment becomes accessible after sliding the red perspex hood upwards, using two flat hands gently pressing against the two sides.
- Page 30 CHAPTER 3 COMPONENTS OF THE MAXI-VERSION Fig. 13: Bottom part of IMAG MAX/GS with black 96-well microtiter plate in defined centered sample position After removing the x-y stage plate, alternatively a multiwell plate can be placed into the sample plane. A correctly centered position is defined by two positioning elements (horizontal perspex bar and metal screw defining right limit).
- Page 31 CHAPTER 3 COMPONENTS OF THE MAXI-VERSION Fig. 14: IMAG MAX/GS, with bottom part being removed, resting on two spacers to give room for potted plant Alternatively, it is also possible to remove the bottom part of the IMAG-MAX/GS for fluorescence imaging of larger samples, like potted plants.
-
Page 32: Leaf Distance Holder Imag-Max/B
CHAPTER 3 COMPONENTS OF THE MAXI-VERSION Leaf Distance Holder IMAG-MAX/B Fig. 15: Leaf Distance Holder IMAG-MAX/B with IMAG-MAX/L and IMAG-K6 Using the Leaf Distance Holder IMAG-MAX/B the illumination unit with CCD-camera are mounted at standard working distance of 18.5, resulting in homogenous illumination of an imaged area of 10 x 13 cm of the x-y stage plate. -
Page 33: Notebook Pc Imag-Pc
Warning: IMAG-MAX/B does not provide eye protection! The user should avoid looking directly into the LED-Array Illumination unit. Notebook PC IMAG-PC Operation of the IMAGING-PAM requires a PC with the following minimum requirements: Processor: 1.7 GHz • • RAM: 4 GB •... -
Page 34: Adapter Imag-Max/Gwk
CHAPTER 3 COMPONENTS OF THE MAXI-VERSION Adapter IMAG-MAX/GWK The combined application of IMAGING-PAM and gas exchange measurements by GFS-3000 provides comprehensive analysis options. For examples physiological heterongeneities or differences in genotypes can be visualized in fluorescence images under changing CO or temperature conditions applied by the gas exchange system. -
Page 35: Components Of The Imaging-Pam Mini-Version
Multi Control Unit IMAG-CG The same Multi Control Unit IMAG-CG is used for all versions of the IMAGING-PAM M-series. It was already described in section 3.1.1. in conjunction with the MAXI-version. The LED-Array of the MINI-Head is plugged into to the MINI-Head connector on the rear side of the IMAG-CG unit. -
Page 36: Mini-Head Led-Array Imag-Min/B And Imag-Min/R
CHAPTER 4 COMPONENTS OF THE MINI-VERSION screw is provided. Alternatively it can be also mounted on a tripod or be held by hand using a special grip (see 4.5). MINI-Head LED-Array IMAG-MIN/B and IMAG-MIN/R Fig. 4.1 Top view of MINI-Head IMAG-MIN/B LED-array without aluminium rods holding the sample-platform The blue and red versions of the MINI-Head (IMAG-MIN/B and IMAG-MIN/R) are identical except for the color of the LEDs and the... - Page 37 CHAPTER 4 COMPONENTS OF THE MINI-VERSION MIN/R emission peak 620 nm) a special short-pass interference filter (< 645 nm) is used. The LEDs are mounted at an angle that is optimized for obtaining a homogenous light field at the given working distance.
-
Page 38: Ccd Camera Imag-K6 Or Imag-K7
CHAPTER 4 COMPONENTS OF THE MINI-VERSION CCD Camera IMAG-K6 or IMAG-K7 The CCD Cameras IMAG-K6 or IMAG-K7 are described in chapter 3.4 for the imaging MAXI-version. Both can also be used in the imaging MINI-version in combination with IMAG-MIN/B and IMAG-MIN/R. - Page 39 CHAPTER 4 COMPONENTS OF THE MINI-VERSION Fig. 16: Camera side with 4 screw holes and label (left) - facing the labelled LED-Array side, camera side with 7 screw holes (right) facing the LED-Array backside and the metal angle bar (Fig. 17 A) IMAG-K6 GFP/PS II IMAG-K6 GFP/PS II IMAG-K6 with K6-MIN...
-
Page 40: Imag-Min/Gfp With Imag-K6
CHAPTER 4 COMPONENTS OF THE MINI-VERSION MIN/M contains a perspex device to unplug the GigE cable from a mounted CCD camera (see Fig. 18) Fig. 18: Perspex device to unplug GigE cable from a mounted camera IMAG-MIN/GFP with IMAG-K6 For GFP measurements using the MINI-version the IMAG- MIN/GFP LED array is needed in combination with the filter slide IMAG-K6/FS, the 2/3"... - Page 41 Before mounting the objective with filter slide to the IMAG-K6 CCD camera a 5 mm distance ring needs to be mounted and if IMAG-K6 has been used in another IMAGING-PAM configuration additional short pass filters (e.g. Fig. 8 left) between camera and objective as well as other distance rings need to be removed.
- Page 42 CHAPTER 4 COMPONENTS OF THE MINI-VERSION Fig. 20: switching of the filter slider between two positions (A – PSII, C- GFP position) The view into the GFP Mini-Head from the sample side (Fig. 20) explains the two positions of the filter slider. The filter slider carries two detection filters.
- Page 43 CHAPTER 4 COMPONENTS OF THE MINI-VERSION The filter slider can be pushed from left to right (Fig. 20 A to C), to change the detection filter from PSII-fluorescence to GFP. For lowering background effects, the GFP Head is shipped with a sample of a low fluorescent black adhesive film which can be used as a background layer.
- Page 44 CHAPTER 4 COMPONENTS OF THE MINI-VERSION There are different color modes reasonable for the GFP measurements. Fig. 21 A shows an image in the false color scale mode of the “Analysis” function (see also chapter 9.1.2.6). Another option is the black and white mode as in Fig. 21 B. The Description of the Display Parameters can be found under chapter 9.5.8 (display parameters) of the manual.
- Page 45 CHAPTER 4 COMPONENTS OF THE MINI-VERSION settings may lead to the bleaching of the sample. Using the „Analysis“ sliders, the inevitable background can be suppressed. Fig. 23: Fo image in the PSII mode (A) vs. Fm image (B) Since the camera used for the combined GFP-Head is highly sensi- tive, settings have to be changed between GFP and PSII measure- ment: PSII fluorescence –...
-
Page 46: Leaf Holder Imag-Min/Bk With Grip Holder
Fig. 24: MINI-Head with CCD camera and grip holder When the Leaf Holder is delivered together with the MINI- version of the Imaging-PAM, it is already mounted on the MINI- Head. A grip holder is provided, which can be fixed to the metal angle on the camera. - Page 47 CHAPTER 4 COMPONENTS OF THE MINI-VERSION This is particularly useful in field applications. The MINI-Head may either be carried separately or together with the IMAG-CG, on which it may be mounted with the help of a wing screw. Alternatively the Mini-Head may also be mounted on a tripod using the same metal angle to which the carrying grip can be connected (see Fig.
- Page 48 CHAPTER 4 COMPONENTS OF THE MINI-VERSION Fig. 27: Components of the Leaf Holder First the frame (1) is mounted with two screws (2) on the sample platform of the MINI-Head. Then the clip (3) is fixed with two screws (4) to the sample platform. While Fig. 28 shows the mounted clip from the bottom (camera) side, Fig.
- Page 49 CHAPTER 4 COMPONENTS OF THE MINI-VERSION Fig. 28: Leaf clip mounted on sample platform of MINI-Head viewed from camera side Fig. 29: Leaf clip mounted on sample platform of MINI-Head viewed from top side...
-
Page 50: Adapter For Gfs-3000 (Imag-Min/Gfs)
COMPONENTS OF THE MINI-VERSION Fig. 30: Leaf clip and grip holder mounted on MINI-Head Adapter for GFS-3000 (IMAG-MIN/GFS) The MINI-version of the IMAGING-PAM M-series can be applied for simultaneous measurements of CO gas exchange and chlorophyll fluorescence. For this purpose the adapter IMAG- MIN/GFS is available which replaces the sample-platform of the standard version. - Page 51 CHAPTER 4 COMPONENTS OF THE MINI-VERSION Fig. 31: MINI-Head mounted on Standard Measuring Head of the GFS- 3000 Gas Exchange Fluorescence System When the MINI-Head is used in combination with the gas exchange measuring system, it is controlled by the combined ImagingWin and GFSWin programs running synchronously on the same PC.
-
Page 52: Imagingwin Software Versions For Various Types Of Mini- Version
CHAPTER 4 COMPONENTS OF THE MINI-VERSION ImagingWin software versions for various types of MINI- Version Upon start of the ImagingWin program the user may choose between different software versions for the various types of MINI-Heads. While these versions are practically identical, they feature different PAR-Lists (found under „Options“... - Page 53 CHAPTER 4 COMPONENTS OF THE MINI-VERSION The measured correction image will be saved until it is overwritten by a new measurement. The correction images will remain valid as long as the same optical parameters apply (LED Illumination Unit, working distance, focusing position, camera objective lens, microscope objective lens).
-
Page 54: Components Of The Imaging-Pam Microscopy-Version
CHAPTER 5 COMPONENTS OF THE MICROSCOPY-VERSION 5 Components of the IMAGING-PAM MICROSCOPY-version The MICROSCOPY-version of the IMAGING-PAM consists of: 1) Control Unit IMAG-CG with Battery Charger 2120-N 2) CCD Camera IMAG-K6 (2/3") 3) Modified Zeiss Axio ScopeA.1 4) LED Modules as:... -
Page 55: Multi Control Unit Imag-Cg
Multi Control Unit IMAG-CG The same Multi Control Unit IMAG-CG is used for all versions of the IMAGING-PAM M-series. It was already described in section 3.1 in conjunction with the MAXI-version. The cable of the MICROSCOPY LED Lamps IMAG-L470M or IMAG-L625M is connected to the MINI-Head socket at the rear side of the control unit. - Page 56 CHAPTER 5 COMPONENTS OF THE MICROSCOPY-VERSION Fig. 32: Camera adapter for connecting Axio Scope.A1 with IMAG K6 Fig. 33: Zeiss camera adapter mounted on Axio Scope.A1 The camera IMAG-K6 (not shown) can be screwed onto the C- mount adapter shown in Fig. 33. Afterwards the camera needs to be connected to the camera port of the IMAG-CG multi control unit as well as to the computer via Gigabit Ethernet.
-
Page 57: Axio Scopea.1 Epifluorescence Microscope
(see Fig. 34). Furthermore the halogen transmitted light lamp should be switched off during epifluorescence measurements to avoid actinic illumination of the sample. Fig. 34: Pathway switch Axio ScopeA.1 Epifluorescence Microscope Fig. 35: MICROSCOPY-IMAGING-PAM based on Zeiss ScopeA.1 Epifluorescence Microscope... - Page 58 The MICROSCOPY-IMAGING-PAM is readily adapted to the Zeiss Axio ScopeA.1 microscope giving excellent fluorescence images. If a complete IMAGING-PAM MICROSCOPY Version has been purchased, some parts are already mounted to make the first setup a bit easier. For safe shipping purposes some components had to be detached.
-
Page 59: Reflector Modules
MICROSCOPY-PAM applications, an investment in high aperture lenses should have high priority. 5.3.1 Reflector Modules In complete IMAGING-PAM MICROSCOPY instruments necessary filters of the reflector modules are already mounted. In case the reflector module is purchased as a separate part, please follow the instructions below. -
Page 60: Assembling Of Beam Splitter And Filters
CHAPTER 5 COMPONENTS OF THE MICROSCOPY-VERSION 5.3.2 Assembling of beam splitter and filters Zeiss Zeiss Fig. 36: The reflector module – mounting the beam splitter A) For opening the reflector module, loosen two screws (A/1). The emission part (A/2) can now be detached from the excitation part (A/3) by a turn around the lower angle. - Page 61 CHAPTER 5 COMPONENTS OF THE MICROSCOPY-VERSION A) The arrows in Fig. 37/A1 mark the path of the illumination beam or the imaging beam seen from the side. B) lists the different filters and parts that may be needed. The detector filter B /2 (RG665), a filter for the excitation light source (B /5 - normally not needed).
-
Page 62: Mounting Of The Reflector Module
CHAPTER 5 COMPONENTS OF THE MICROSCOPY-VERSION 5.3.3 Mounting of the reflector module The mounting of the reflector module into the Zeiss Axio Scope.A1 is described in Fig. 39. Zeiss Fig. 39: Changing the reflector module in the upper stand FL-LED In the front of the microscope a grey plastic cover, behind which the turret for the reflector modules can be found, can be pulled off in forward direction for mounting the reflector modules in the reflector... - Page 63 CHAPTER 5 COMPONENTS OF THE MICROSCOPY-VERSION Fig. 40: Mounting the reflector module The reflector module is inserted after turning it by 180° around its vertical axis (the reflector module is mounted with its excitation filter side Fig. 37/A7 facing to the front). It shall be inserted carefully into the upper spring elements.
-
Page 64: Led Modules
CHAPTER 5 COMPONENTS OF THE MICROSCOPY-VERSION LED Modules There is a wide choice of wavelengths available for the Zeiss LED modules so that experienced users can easily modify their epifluorescence system by additional light sources with various wavelengths. LED modules might need to be adapted as described in this chapter. - Page 65 CHAPTER 5 COMPONENTS OF THE MICROSCOPY-VERSION The red LED module IMAG-L625M comes with a set of grey neutral density filters that can be used to adapt emitted light different magnifications. additional KPF647,5 filter cuts off unwanted wavelengths and shall be mounted as last filter in front of the ND filters.
-
Page 66: Integration Of Led Modules Into Axio Scope.a1
CHAPTER 5 COMPONENTS OF THE MICROSCOPY-VERSION This lamp also needs a special reflector module (Beam-splitter 395 nm Zeiss 446431-0011-000). Make sure not to intermix this part with other colorsplitter modules. Since this is not a standard part, please inquire at Walz. 5.4.2 Integration of LED modules into Axio Scope.A1 The integration of LED modules in the Axio Scope.A1 is shown in Fig. - Page 67 5) have to be modified depending on the number of LED modules used for each application. Please ask for technical assistance at the Heinz Walz GmbH if a combined application is intended. Please Note: If cables a and b in Fig. 42 are connected the switch for the epifluorescence lamps on the right side of the microscope is not active (Fig.
-
Page 68: Connecting Led Modules With Imag-Cg
COMPONENTS OF THE MICROSCOPY-VERSION 5.4.3 Connecting LED modules with IMAG-CG For the use together with IMAGING-PAM MICROSCOPY version the LED modules have to be connected with the central control unit IMAG-CG. The provided connection cable for the LED modules has to be connected with the 3-pin connector (Fig. - Page 69 CHAPTER 5 COMPONENTS OF THE MICROSCOPY-VERSION The Red-Green-Blue Microscopy LED Lamp (in contrast to the IMAG-L470M or IMAG-L625M) features its own LED drivers. It is connected to the RGB-Head socket at the rear side of the IMAG-CG control unit. Optically it is connected with the epifluorescence microscope via a fluid light guide (100 cm length, 3 mm ).
- Page 70 As the LED circuit is mechanically coupled to the reflector turret, it is necessary to make sure that LED module and fluorescence filters on the corresponding reflector turret position are compatible. Fig. 45: Schematic presentation IMAGING-PAM MICROSCOPY-version with IMAG-RGB...
-
Page 71: How To Get Started
Imaging-PAM M-series. Specific information on MINI-, and MICROSCOPY-versions is presented in sections 4 - 1.1. The IMAGING-PAM is readily set up and its basic operation is quite simple. The following sub-sections explain how to put the system together and how to install the software on the PC. Also some simple measurements will be described, which may help the user to become acquainted with the instrument. -
Page 72: Software Installation
CD-ROM. For installation of ImagingWin this CD-ROM is put into the CD-drive of the PC which is going to be used in conjunction with the IMAGING-PAM. Installation occurs automatically (Autostart). If the Autostart function is not active under Windows, the Set-up file has to be started manually from the CD. - Page 73 CHAPTER 6 HOW TO GET STARTED The ImagingWinGigE folder contains all files required for operation of the IMAGING-PAM and also the Data-directories for the various types of measuring heads. For updates of the ImagingWinGigE software update setup files can be downloaded from the Walz website (www.walz.com). Please note that the Data directories and all system settings are not affected by the Update.
-
Page 74: Installation Of Camera Driver
ImagingWinGigE folder. First steps and examples of routine measurements After the IMAGING-PAM is set up, all cables are connected and all software is installed (see 6.2), first measurements can be carried out in order to become acquainted with the instrument. - Page 75 CHAPTER 6 HOW TO GET STARTED measuring light does not cause significant changes in the given state of a leaf sample. The PC monitor screen shows the Image window on which after program start the image of the fluorescence parameter Ft is displayed. The Ft-image is black as long as no leaf sample is present.
- Page 76 So far the IMAGING-PAM has been monitoring fluorescence yield, but no actual measurement was carried out yet. With the IMAGING-PAM, just as with most other PAM fluorometers, a "measurement" means the assessment of photosynthetic parameters by fluorescence quenching analysis with the help of a saturating light...
- Page 77 CHAPTER 6 HOW TO GET STARTED coefficients, measurement of the minimal and maximal fluorescence yield of a dark-adapted sample is important. Dark-adaptation does not have to be strict. Actually, in most cases a few minutes adaptation to low light conditions are sufficient for serving this purpose. Warning: It is recommended that the eye protecting red perspex hood is slid down before a saturation pulse is given.
- Page 78 CHAPTER 6 HOW TO GET STARTED Fig. 47: PC screen shot of Image window following Fo, Fm determination with the Fv/Fm image being selected and various types of AOI being defined In Fig. 47 the Image window following Fo, Fm determination is shown, when the Fv/Fm-image is selected.
- Page 79 CHAPTER 6 HOW TO GET STARTED When the sample is illuminated, the effective quantum yield is decreased, as PS II reaction centers partially close (decrease of photochemical quenching) and energy dissipation into heat increases (increase of non-photochemical quenching). Actinic illumination can be started by checking the AL box.
- Page 80 CHAPTER 6 HOW TO GET STARTED generally observed that differences in photosynthetic efficiency can be distinguished best when actinic light is applied, which puts some pressure on the limiting steps of the overall process, such that electrons accumulate at the acceptor side of PS II. Considerable heterogeneity is also displayed by nonphoto- chemical quenching (expressed by the fluorescence parameters qN, see also 9.1.1.15) as illustrated in Fig.
- Page 81 CHAPTER 6 HOW TO GET STARTED Kautsky effect). Saturation Pulse quenching analysis reveals that characteristic changes in quantum yield (YII) and nonphotochemical quenching (qN) accompany the changes in fluorescence yield. The Kinetics-window serves for the study of such dark-light induction phenomena.
- Page 82 Induction Curve a vast amount of information was stored, which can be analyzed at any time after the recording. Analysis is also possible in the Off-line mode, i.e. without the IMAGING-PAM being connected to the PC. For each Saturation Pulse the images of the various fluorescence parameters were captured.
- Page 83 CHAPTER 6 HOW TO GET STARTED measurement of a Light Curve the user has to return to the Measure Mode and click the Light Curve register card. While the recording of a pronounced Induction Curve is favored by previous dark adaptation, the opposite is true for the recording of a Light Curve, which should not be dominated by induction effects.
- Page 84 Ulbricht Sphere. The IMAGING-PAM offers a special routine for measuring PAR-Absorptivity images by comparing the remission images of diffuse red and NIR radiation, which is emitted by the same LED- Ring-Array as the blue fluorescence measuring light.
- Page 85 Absorptivity photosynthetically active light. Therefore, the Abs. parameter as determined by the IMAGING-PAM may be considered a close estimate of PAR-Absorptivity. This approach is based on the empirical fact that pigments that contribute to the absorption of PAR do not show significant absorption bands in the near-infrared (NIR) spectral region.
- Page 86 CHAPTER 6 HOW TO GET STARTED Fig. 52: Image of PAR-Absorptivity determined by the Measure Abs. routine In the example of Fig. 52 Absorptivity is distributed quite homogenously (pixel values around 0.9) over the whole leaf area. In other cases substantial heterogeneities can be observed, e.g. induced by viral or fungal infections and stress induced damage which leads to formation of necrotic spots.
- Page 87 These first measurements on one hand demonstrate the simplicity of measurements with the IMAGING-PAM and on the other hand give a first impression of the vast potential of this tool for assessment of photosynthetic parameters. This introduction should enable the user to get acquainted with the instrument and to start carrying out own experiments.
- Page 88 CHAPTER 6 HOW TO GET STARTED more detail. Unavoidably there will be some overlapping with the information given in this Chapter 6.
-
Page 89: Imagingwin
7 ImagingWin Except for the POWER on/off switch on the Control Unit and the External 300 W Power Supply, the MAXI-IMAGING-PAM is fully operated via PC using the ImagingWinGigE software. Fig. 54 shows the user surface of ImagingWinGigE after start of the program, as seen on the PC screen. - Page 90 2) At the bottom of the screen different types of functional elements essential for operation of the IMAGING-PAM are located: • the elements at the left side relate to the recorded data (viewing, saving, opening and export of data) •...
-
Page 91: Imagingwin - System Operation
Definition of New Record 8.1.1 Fo, Fm The Fo, Fm-determination is of central importance for recordings with the IMAGING-PAM. Only after appropriate determination of Fo and Fm with a more or less dark-adapted sample, the consequently measured values of the fluorescence parameters qP, qN and NPQ will be meaningful. -
Page 92: New Record
CHAPTER 8 IMAGINGWIN - SYSTEM OPERATION 8.1.2 New Record Upon start of a New Record previously recorded data stored in the buffer memory are erased in order to make room for the new data. Therefore, the user is asked: "Save previous Record?" If this question is answered with "No", the previously recorded data are lost. -
Page 93: Functions Applying To The View-Mode
CHAPTER 8 IMAGINGWIN - SYSTEM OPERATION only, the various types of illumination are not affected by switching to the View-mode. In this way, it is possible to keep a sample in a defined light state while viewing previously recorded data. If the user wants to stop illumination (e.g. - Page 94 PAM Image (PIM) file. Data saving is also possible in the Measure-mode during the course of a Record (see 8). Data are saved in the Data- directory of the corresponding Imaging-PAM version. Additionally to the Data file a commend (.txt) file for experimental descriptions can be edited and saved.
-
Page 95: Light Controls
They are suited for being used in conjunction with other image analysis programs, like “ImageJ”. Light controls The Imaging-PAM employs the same LEDs for pulse-modulated Measuring Light (ML), Actinic Light (AL), (Ext) and Saturation Pulses. Checkbox for switching Measuring Light on/off at a pulse frequency defined under Settings. - Page 96 CHAPTER 8 IMAGINGWIN - SYSTEM OPERATION Display of light intensity (Photosynthetically Active Radiation) in µmol quanta m , which is corresponds to the intensity of Actinic Light as well as (although to a much lesser extent) also by the intensity and frequency of the Measuring Light, as defined by the intrinsic PAR-List (under Options).
- Page 97 CHAPTER 8 IMAGINGWIN - SYSTEM OPERATION Light Width) and at the end of which a Saturation Pulse is applied. The AL + Y key is not active when Act. Light Width is set to zero (indefinite). When the Clock is switched on, the selected Clock Clock item is repeated with the set interval until manually switched off again.
-
Page 98: Imagingwin - Register Cards
CHAPTER 9 IMAGINGWIN - REGISTER CARDS 9 IMAGINGWIN - Register Cards Image-window The major part of the Image-window is occupied by the actual Image, at the bottom of which the false color code bar is located. The standard false color code ranges from black via red, orange, yellow, green, blue and violet to purple. -
Page 99: Current Fluorescence Yield, Ft
CHAPTER 9 IMAGINGWIN - REGISTER CARDS Under Select type of Image one out of 18 different parameters can be selected, the image of which is displayed on the Image- window. The meaning of the various parameters will be briefly described in the following subsections. 9.1.1.1 Current fluorescence yield, Ft The current fluorescence yield, Ft, is continuously monitored in... -
Page 100: Fluorescence Yield, F
CHAPTER 9 IMAGINGWIN - REGISTER CARDS averaging can be applied, which allows assessment of Fo at substantially enhanced sensitivity (see 9.6.1). Fo determination is essential for correct calculation of the quenching coefficient qP (see 9.1.1.16). 9.1.1.3 Fluorescence yield, F The fluorescence yield, F, is assessed like all fluorescence parameters (except for Ft) in conjunction with the application of a Saturation Pulse. -
Page 101: Maximum Fluorescence Yield, Fm
CHAPTER 9 IMAGINGWIN - REGISTER CARDS differs from Fm', the images of which change with every Saturation Pulse (see below). 9.1.1.5 Maximum fluorescence yield, Fm' In illuminated samples, the maximum fluorescence yield, Fm', is observed, which normally is lowered with respect to Fm by non- photochemical quenching. -
Page 102: Effective Ps Ii Quantum Yield, Y(Ii)
CHAPTER 9 IMAGINGWIN - REGISTER CARDS Saturation Pulse (variable fluorescence, Fv) as well as the PS II quantum yield (∆F/Fm = Fv/Fm) are maximal. The Fv/Fm image is measured in conjunction with an Fo, Fm-determination. It remains unchanged until the next Fo, Fm-determination. In this respect, the Fv/Fm image differs from the Y(II) image which changes with every Saturation Pulse (see below). -
Page 103: Quantum Yield Of Regulated Energy Dissipation, Y(Npq)95
CHAPTER 9 IMAGINGWIN - REGISTER CARDS adaptation when the effective PS II quantum yield is maximal (see 9.1.1.6). Y(II) measurements normally are preceded by an Fo, Fm- measurement. this case contrast between photosynthetically active object and the background matrix is enhanced, by the definition: Fv/Fm = 0 if Fm<0.048. -
Page 104: Quantum Yield Of Nonregulated Energy Dissipation, Y(No)
CHAPTER 9 IMAGINGWIN - REGISTER CARDS most higher plant leaves. The NPQ parameter is a measure of nonphotochemical fluorescence quenching (see 9.1.1.13), reflecting down-regulation of PS II as a protective mechanism against excess light intensity. The qL parameter is a measure of the fraction of open PSII centers in the "Lake model"... -
Page 105: Absorptivity, Abs
MAXI- and MINI-Heads in the blue measuring light version. The red measuring light versions as well as the MICROSCOPY-version of the Imaging-PAM M-series do not support this function. The Absorptivity (Abs.) image is a measure of the fraction of the incident Red-light which is absorbed by the leaf sample. - Page 106 Absorptivity photosynthetically active light. Therefore, the Abs. parameter as determined by the IMAGING-PAM may be considered a close estimate of PAR-Absorptivity. This approach is based on the empirical fact that pigments that contribute to the absorption of PAR do not show significant absorption bands in the near-infrared (NIR) spectral region.
-
Page 107: A Pparent Rate Of Photosynthesis, Ps/50
CHAPTER 9 IMAGINGWIN - REGISTER CARDS to the photosynthetic reaction centers. A special case is given when leaves are red colored, e.g. due to anthocyanin accumulation in the vacuoles of the epidermis. On one hand, this will cause a low Abs.- value, as a large fraction of the Red will be remitted. -
Page 108: Nir Light Remission, Nir
CHAPTER 9 IMAGINGWIN - REGISTER CARDS The PS-parameter measured with the IMAGING-PAM in most respects closely corresponds to the ETR-parameter previously defined for measurements of the apparent rate of photosynthetic electron transport: ETR = 0.5 x Yield x PAR x 0.84 µequivalents m This commonly used definition assumes a PAR-Absorptivity of 0.84, i.e. -
Page 109: Nonphotochemical Quenching, Npq/4
R-image, it does not affect the ratio R/NIR and the calculated Absorptivity parameter Abs. = 1 - R/NIR. NIR-images cannot be measured with the MICROSCOPY- versions of the Imaging-PAM. 9.1.1.13 Nonphotochemical quenching, NPQ/4 The NPQ parameter provides a measure of nonphotochemical quenching which in contrast to qN does not require knowledge of Fo' (see 9.1.1.2). -
Page 110: Red Light Remission, R
CHAPTER 9 IMAGINGWIN - REGISTER CARDS Hence, images of NPQ/4 are displayed, with values ranging between 0 and 1, that can be displayed using the standard false color code. The definition of NPQ implies a matrix model of the antenna pigments (Stern-Volmer quenching). -
Page 111: Coefficient Of Nonphotochemical Quenching, Qn
PS II acceptor side with the help of far-red light, before non-photochemical quenching can relax. This approach, however, is not feasible with the IMAGING-PAM, as the far-red light would penetrate to the CCD-detector and cause serious disturbance of fluorescence imaging. Therefore, instead of measuring... -
Page 112: Coefficient Of Photochemical Quenching, Qp
The coefficient of photochemical quenching, qP, is a measure of the overall "openness”. Red-images cannot be measured with the MICROSCOPY-versions of the Imaging-PAM. They vary between 0 and 1. Calculation of qP requires knowledge of the fluorescence parameter Fo' (minimal fluorescence yield of illuminated sample,... -
Page 113: Coefficient Of Photochemical Quenching, Ql
CHAPTER 9 IMAGINGWIN - REGISTER CARDS mechanism causing Fo-quenching is also responsible for quenching of Fm' with respect to Fm, it is possible to estimate Fo' from Fm' measurements (Oxborough and Baker 1997): Fo' = Fo/ (Fv/Fm + Fo/Fm') Assessment of qP requires previous Fo-Fm determination with the same sample after dark adaptation, i.e. -
Page 114: Inhibition, Inh
Y(II) value. Images of Inh. can also be informative in applications with other objects, like leaves, using all versions of the Imaging-PAM. In phytopathological studies, for example, the inhibition of an infected area relative to a control area (defined as AOI #1) can be depicted. -
Page 115: Image Capture And Analysis
LED arrays of the MAXI- and MINI-Heads in the blue measuring light version. The MICROSCOPY-versions of the Imaging-PAM M-series does not support this function. Using the Measure Abs. key an automatic routine for the measurement of a PAR-Absorptivity (Abs.) image can be started (see also 9.1.1.10). -
Page 116: Area Of Interest, Aoi
(see also 9.1.1.10). Appropriate settings of NIR and Red intensity, as well as of Red Gain, were determined at the factory for each individual IMAGING-PAM and are documented on a sticker fixed to the corresponding LED-Array. These settings are preinstalled on the Notebook PC IMAG-PC, if this is purchased together with the instrument. - Page 117 CHAPTER 9 IMAGINGWIN - REGISTER CARDS The definition of at least one AOI is required for recordings of Induction Curves (see 9.2) and Light Curves (see 9.3). After start of the program a standard AOI circle is installed by default in the center of the image area.
-
Page 118: Select: Fluorescence Or Live Video
CHAPTER 9 IMAGINGWIN - REGISTER CARDS The AOI Type has to be selected before clicking "Add"; after clicking "Add" the Type-selection is not accessible. For definition of the size and position of a Rectangle AOI, after clicking "Add" the mouse cursor is moved to one of the envisaged corners, which is fixed by a mouse click (left or right). - Page 119 CHAPTER 9 IMAGINGWIN - REGISTER CARDS by the pulse modulated blue measuring light. In this way the momentary Ft image is continuously captured. A rather low pulse frequency is applied in order to avoid an actinic effect of the measuring light. Consequently changes of fluorescence images are strongly damped and it is difficult to follow the fluorescence image while moving the sample or trying to focus the image.
-
Page 120: Zoom
CHAPTER 9 IMAGINGWIN - REGISTER CARDS the CCD camera. This feature is particularly important in using standard through-light Microscopy-applications condenser-illuminator of the microscope. In this way samples can be readily centered and focused using the PC monitor screen. In order to quit the Live Video Mode and to return to the Fluorescence Mode click the Close button on the right hand side or the Exit button in the upper right corner of the NIR intensity adjustment window. -
Page 121: Cursor
CHAPTER 9 IMAGINGWIN - REGISTER CARDS Reset button serves for reset of the standard Zoom with Zoom factor 2 (display of central quarter). 9.1.2.5 Cursor The Cursor box shows the numerical value of the selected parameter at the cursor position which can be changed by mouse movement. - Page 122 CHAPTER 9 IMAGINGWIN - REGISTER CARDS respect to each other, the more expanded is the color display. In this way, small differences in pixel values can be emphasized by enhanced color differences, thus increasing the contrast. Using the false color scale, maximal contrast is obtained in the range of very low values (from yellow to red and black).
- Page 123 CHAPTER 9 IMAGINGWIN - REGISTER CARDS Fig. 56: Display under Analysis with particular settings of Low-High limits Fig. 57: Expanded Color display (under Capture)
-
Page 124: Kinetics Window
CHAPTER 9 IMAGINGWIN - REGISTER CARDS Kinetics window On the Kinetics window the changes of fluorescence parameters are plotted versus time. Following every Fo, Fm-determination, i.e. after start of a new Record, all measurements are saved in the Buffer Memory, as protocolled in the lower left corner of the ImagingWin user surface (see 8.2) and in more detail in the Report file (see 9.4). - Page 125 CHAPTER 9 IMAGINGWIN - REGISTER CARDS only one AOI is selected. The Ft-parameter (momentary fluorescence yield at any time, t), differs from all other parameters in that it is measured continuously, i.e. not only in conjunction with Saturation Pulses. However, it should be noted that Ft is recorded exclusively for the selected AOIs.
- Page 126 CHAPTER 9 IMAGINGWIN - REGISTER CARDS For example, it can be advantageous to keep the previously recorded Fo,Fm, when an Induction Curve is measured after a defined preillumination. In this case, the Fo,Fm can be measured before the preillumination and Fo,Fm determination preceding the recording of the Induction Curve can be omitted.
- Page 127 CHAPTER 9 IMAGINGWIN - REGISTER CARDS One out of three different types of Kinetic recordings can be selected (Induction Curve, Manual recording and Induction + Recovery). After Start of a recording, it can be terminated via the Stop-button. Next refers to the remaining time until the next measurement takes place (i.e.
- Page 128 CHAPTER 9 IMAGINGWIN - REGISTER CARDS An Induction Curve + Recovery is a preprogrammed Ind.+Rec.: dark-light induction curve (Kautsky effect) followed by a light-dark induction curve which provides information on the dark-recovery of fluorescence parameters after a period of illumination, the parameters of which can be defined by the user.
- Page 129 CHAPTER 9 IMAGINGWIN - REGISTER CARDS When the Autoscale icon is clicked the time scale automatically is changed such that the data fill the Kinetics screen. boxes show the coordinates of the cursor position, with X corresponding to the time (sec) and Y corresponding to the pixel value of the selected fluorescence parameter.
-
Page 130: Light Curve Window
CHAPTER 9 IMAGINGWIN - REGISTER CARDS Light Curve window Fig. 60: Light Curve window with display of typical Light Curve of the ETR-parameter Recording of a Light Curve consists of a number of illumination steps, at the end of which the effective PS II quantum yield as well as various other parameters are determined with the help of a Saturation Pulse. - Page 131 CHAPTER 9 IMAGINGWIN - REGISTER CARDS induction effects. The latter can be minimized by using pre- illuminated samples. maximal reached upon light saturation photosynthetic electron flow at high PAR values strongly depends on correct determination of rather small F values with the help of saturation pulses.
- Page 132 CHAPTER 9 IMAGINGWIN - REGISTER CARDS More detailed information on the physiological reactions taking place during the course of a Light Response Curve is provided by Light Curves of the various Fluorescence parameters. As illustrated in Fig. 61, with increasing PAR the Y(II) parameter continuously decreases, whereas the Y(NPQ) parameter shows an almost antiparallel increase and the Y(NO) parameter is almost constant.
- Page 133 CHAPTER 9 IMAGINGWIN - REGISTER CARDS Curve is started via the Start button and can be terminated at any time with the help of the Stop button. Recording of a Light Curve constitutes a New Record. Therefore, unless any preceding Record already was stored, the user is asked "Save previous Record?".
- Page 134 CHAPTER 9 IMAGINGWIN - REGISTER CARDS There is an infinity of possible AOIs (at the Image level) and, hence, principle also an infinity of Light Curves created and analyzed. When the AOI button is pressed, the AOI window is opened, which shows in its lower part a list of all AOIs that previously were defined on the Image-...
- Page 135 CHAPTER 9 IMAGINGWIN - REGISTER CARDS defined. In order to modify a current setting (Intensity or Time/10 s), it first has to be selected by cursor/left mouse click and then the modified setting has to be entered. Please note that the PAR values for the selected Intensity settings are derived from the PAR list (see Options, section 10).
-
Page 136: Report Window
CHAPTER 9 IMAGINGWIN - REGISTER CARDS Report window In the Report window the data of the current Record are displayed in form of listed parameter values. These lists can be transferred to spread sheet programs, like Excel. At the top of the Report window there is a text field, into which a comment can be written. - Page 137 View-mode and will be automatically saved as txt-file in conjunction with the corresponding pim-file. Considering the vast amount of data which can be collected with the IMAGING-PAM under largely different measuring conditions, this comment file is of considerable importance for later assessment of the results.
- Page 138 CHAPTER 9 IMAGINGWIN - REGISTER CARDS After confirmation by OK the Record (with the information specified in the Report window) first transferred to the file export.csv (comma separated values) in the ImagingPam directory. From there it can be transferred to other programs, like Excel. If Excel is installed on the PC, the Report-data are automatically opened under Excel when export.csv in the ImagingPam directory is double clicked.
- Page 139 CHAPTER 9 IMAGINGWIN - REGISTER CARDS red gain Fm-factor F-factor(not applied under standard settings, see 9.5.14 for explanations) fmnf Fm Normalization Factor mifo measuring light intensity for Fo measurement gain for Fo measurement mifm measuring light intensity for Fm measurement gain for Fm measurement foav number of Fo averages (the last 6 items apply only for the...
-
Page 140: Settings Window
CHAPTER 9 IMAGINGWIN - REGISTER CARDS Settings window The Settings window shows all instrument settings, which can be modified by the user, and in the Measure-mode also provides information on the battery status. Fig. 63: ImagingWin user surface with Settings window being selected In Fig. -
Page 141: Light Parameters
CHAPTER 9 IMAGINGWIN - REGISTER CARDS 9.5.1 Light parameters The IMAGING-PAM features four different types of light: Measuring Light, Actinic Light, External Light and Saturation Pulses. Except of the external light all three types of light are derived from the same source, the LED Illumination Unit (array or single LED depending on the particular version of the Measuring Head). - Page 142 CHAPTER 9 IMAGINGWIN - REGISTER CARDS automated switching to a high setting of Meas. Light Int. at lowered Gain-setting. In this way, the Signal/Noise of Fm, Fm', Fv/Fm and Y(II) measurements can be considerably enhanced. At a given Meas. Light Int. setting the amplitude of the fluorescence signal can be adjusted by the Gain (see 9.5.2).
- Page 143 CHAPTER 9 IMAGINGWIN - REGISTER CARDS application of a SP a Measurement is defined, with the resulting data being saved in the buffer memory. Ten Intensity settings of SP are available, with the maximal setting 10 being standard. In most practical applications the best results are obtained with maximal SP intensity.
-
Page 144: Gain And Damping
CHAPTER 9 IMAGINGWIN - REGISTER CARDS only. The Booster is not implemented for the MICROSCOPY- versions. 9.5.2 Gain and Damping The Gain determines the amplitude of the fluorescence signal, Ft, at a given setting of Measuring Light Intensity (see 9.5.1). Twenty settings are available, with standard setting 2 for MAXI- and MINI-versions. -
Page 145: Absorptivity
CHAPTER 9 IMAGINGWIN - REGISTER CARDS Damping and high Measuring Light frequency settings have to be selected. In the Live Video mode (see 9.1.2.3), which applies near- infrared instead of blue light, Damping is low and Measuring Light frequency high. Therefore, the Live Video mode is best suited for positioning samples in the field of view and for focusing images. -
Page 146: Slow Induction Parameters
CHAPTER 9 IMAGINGWIN - REGISTER CARDS the NIR light used for measurements of Live Video images (see also chapter 9.1.2.3). 9.5.4 Slow Induction parameters The Slow Induction Parameters apply to recordings of preprogrammed dark-light Induction Curves in the Kinetics window. After Start and automatic Fo, Fm determination (see 9.2) some time is given for fluorescence yield to decline back close to the original Fo-level, before Actinic... - Page 147 CHAPTER 9 IMAGINGWIN - REGISTER CARDS another part is due to the unavoidable vignetting-effect of the objective lens. For compensation, correction images can be measured with the help of a sample, which shows uniform fluorescence emission over the whole imaged area. For this purpose, normal white printing paper may serve which at high Meas.
- Page 148 PAR values tend to induce lower values of Y(II) and higher values of Y(NPQ) (see section on Light Curves 9.3). With all Measuring Heads of the Imaging-PAM M-series maximal deviations of PAR values from the mean value are small (not exceeding 10 %)
-
Page 149: Image Transformation
CHAPTER 9 IMAGINGWIN - REGISTER CARDS 9.5.6 Image Transformation The display of images can be changed by the Image Transformation function in order to account for different positions of the camera with respect to the user. Images can be rotated by 180° or mirrored along the vertical midline. Default settings (Rotate 180°... -
Page 150: Display Parameters
CHAPTER 9 IMAGINGWIN - REGISTER CARDS Charging of the internal Li-ion battery should be avoided, Note: when the IMAGING-PAM is switched on, as this may lead to malfunctioning. 9.5.8 Display parameters The user may choose between three different types of image Display. - Page 151 CHAPTER 9 IMAGINGWIN - REGISTER CARDS Low-limit are displayed in black and all pixel values above the High- limit are displayed in white. For pixel values within the cut-off limits, the same false color as for the standard Color display is used (ranging from black via red, yellow, green and blue to purple).
-
Page 152: Go Speed
CHAPTER 9 IMAGINGWIN - REGISTER CARDS The fluorescence parameters, images of which can be measured with the ImagingPam, can be divided into two groups: 1) directly measured parameters like Fo, F, Fm and Fm’. 2) derived parameters like Fv/Fm, Y(II), NPQ etc. The latter are based on ratios of the directly measured parameters and, hence, lack information on the fluorescence yield. -
Page 153: Inh. Ref. Aoi
CHAPTER 9 IMAGINGWIN - REGISTER CARDS PS = 0.5 x Y(II) x PAR x Abs. µequivalents m (see also 9.1.1.11) In order to display images of this parameter on a false color scale ranging from 0 to 1, the PS value is divided by a number, which corresponds to the expected limit of maximal PS, the PS Limit. -
Page 154: Fm Factor
Saturation Pulse, which is related to the unavoidable heating of the LEDs. In the case of the blue LED-Array Illumination Unit of the MAXI-IMAGING-PAM, at the standard setting 10 of SP Intensity this lowering amounts to 5 - 6 %. Hence, in the MAXI- version the standard value of the Fm Factor set by default is 1.055. - Page 155 CHAPTER 9 IMAGINGWIN - REGISTER CARDS induced lowering of ML intensity can be estimated with the help of the plastic fluorescence standard that is provided with the instrument (see below). After Reset Settings (see 9.5.15) the Fm Factor is active. When Fm Factor is active, the Fm (or Fm’) values documented in the Report (and used for calculation of other fluorescence parameters) are derived from the product of the actually measured Fm (or Fm’)
- Page 156 CHAPTER 9 IMAGINGWIN - REGISTER CARDS the unavoidable noise limiting Fm' determination. A systematic underestimation of Fm' and Y(II), however, should be avoided in view of its pronounced effect on Light Response Curves. Fig. 64: ETR Light Curve recalculated with Fm Factor 1.000 Fig.
-
Page 157: F Factor
CHAPTER 9 IMAGINGWIN - REGISTER CARDS In Fig. 64 - Fig. 65 the same original Light Curve recording is displayed after recalculation with Fm Factor = 1.000 (Fig. 64) and Fm Factor = 1.055 (Fig. 65). With Fm Factor 1.000 maximal ETR amounts to a relative value of 26 and there is an apparent decline of ETR at PAR values exceeding 250 µmol quanta m , which... - Page 158 CHAPTER 9 IMAGINGWIN - REGISTER CARDS corresponds to the factor with which the measured Fo or F value has to be multiplied in order to obtain correct values. In contrast to the Fm Factor the F Factor is not an instrument parameter and it cannot be assumed to be constant.
- Page 159 It does not play any role, when the overall PAR is high during actinic illumination. Furthermore, in the case of the Imaging-PAM even at the maximal ML Frequency there are relatively long dark times between ML...
-
Page 160: Reset Default Settings, Open Or Save User Settings
Different standard settings may apply for different types of Measuring Heads. These settings have proven optimal for imaging of fluorescence parameters of typical samples using various versions of the Imaging-PAM. Please note: the Default Settings button does not reset the PAR-List, Image Correction and Absorptivity adjustments... -
Page 161: High Sens. Window
CHAPTER 9 IMAGINGWIN - REGISTER CARDS The Save and Open User Settings buttons store and open individually preset settings. Please note these buttons also store or reopen the active PAR-List! High Sens. window The High Sens. window is implemented for the MAXI- and MICROSCOPY-versions only. -
Page 162: Special Sp-Routine
CHAPTER 9 IMAGINGWIN - REGISTER CARDS Fig. 66 shows the High Sens. window for the MICROSCOPY- version after enabling the Special SP-Routine (checkbox in upper left corner). Essentially the same window also applies for the MAXI- version except that the bottom box (Fv/Fm Contrast Enhancement by Background Suppression) is missing. - Page 163 CHAPTER 9 IMAGINGWIN - REGISTER CARDS Any change of these settings on the High Sens. window will lead to a corresponding change on the Settings-window and vice versa. Fm and Fm’ determination: These ML-Int. and Gain settings apply during the course of the SP only. Default values are ML20G1 for MICROSCOPY- and ML15G1 for MAXI-versions.
-
Page 164: Fo Averaging
CHAPTER 9 IMAGINGWIN - REGISTER CARDS 9.6.2 Fo Averaging Fo Averaging can be disabled/enabled via the Fo Averaging checkbox. When enabled, Fo averaging is applied in conjunction with every Fo, Fm determination. The progress of averaging can be followed on the Ft image (Image window). The quality of the Fo images is enhanced by averaging over a number of images and by selecting a high Damping setting. -
Page 165: Rgb-Fit Window
CHAPTER 9 IMAGINGWIN - REGISTER CARDS Rationale: In epifluorescence microscopy it is unavoidable that images show some background from scattered / reflected fluorescence as well as fluorescence of non-focused areas. While such “unwanted” fluorescence normally is relatively weak and only marginally disturbs Fo and Fm images, it can strongly affect Fv/Fm and Y(II) images, which are calculated from ratios of fluorescence values and, hence, have lost the information on the original signal... - Page 166 CHAPTER 9 IMAGINGWIN - REGISTER CARDS head uses a red LED with an emission peak at 620 nm, a green LED (520 nm) and a blue LED with a peak at 460 nm. Rationale: Deconvolution of fluorescence images into three different pigment types is based on differences in fluorescence excitation spectra, similarly as with the PHYTO-PAM Chlorophyll Fluorometer.
- Page 167 CHAPTER 9 IMAGINGWIN - REGISTER CARDS The Measure RGB routine serves for obtaining RGB images that can be deconvoluted for display of the four different algae groups (green algae, diatoms, blue-green algae and red algae) in false colors (green, yellow, blue and red, respectively) with the help of the preprogrammed fitting routine.
-
Page 168: Rgb Gain
CHAPTER 9 IMAGINGWIN - REGISTER CARDS 9.7.1 RGB Gain The pixel intensity values of the Red, Green and Blue images are derived from the pixel intensities of the corresponding Ft images multiplied by the Red, Green and Blue Gains. Upon pressing the RGB Gain button a window upons which shows the current values of Red, Green and Blue Gains. - Page 169 CHAPTER 9 IMAGINGWIN - REGISTER CARDS Correction offers an indirect way to modify the fit conditions. The deconvolution into the 4 main groups of algae is based on fit conditions that relate to intensity ratios of individual pixels in the RGB images.
- Page 170 CHAPTER 9 IMAGINGWIN - REGISTER CARDS Definition of AOIs is fully equivalent on RGB-Fit and Image- windows (see also 9.1.2.2). With the help of the Fit-image it is possible to define various AOIs that specifically represent particular organisms (e.g. a diatom attached to a filamentous green alga). Consequently the photosynthetic performance of these particular AOIs can be selectively analyzed by measuring various fluorescence parameters, recording Induction Curves (see 9.2) and measuring...
-
Page 171: 10 Imagingwin - Menu Bar
CHAPTER 10 IMAGINGWIN - MENU BAR 10 IMAGINGWIN - Menu Bar The Menu Bar presents the menu File, Edit, Options, Al-List, Recalc and Transect including its functions as described in the following chapter. 10.1 File 10.1.1 Transfer FoFm In the view mode a FoFm measurement can be transferred to another .pim file by enabling Transfer FoFm in the file menu. - Page 172 CHAPTER 10 IMAGINGWIN - MENU BAR A new window opens up that shows the existing script files: After choosing a file or entering a new file name and clicking “open” the editor is started:...
- Page 173 CHAPTER 10 IMAGINGWIN - MENU BAR Script File: Open, New, Save, Comment & Back Four commands are provided for the management of script files New Script File. The command clears the <Script File Window> and prompts for a new script file name. Open Script File.
- Page 174 CHAPTER 10 IMAGINGWIN - MENU BAR Save Script File. Saves <Script File> to default or user defined directory. Script File Comment. Clicking this icon displays the content of an editable text file called <filename.TXT> which is associated with the script file <filename.PRG>. Editing Tools &...
- Page 175 CHAPTER 10 IMAGINGWIN - MENU BAR Delete Command. To delete a command, select one or several commands as described above and click the <Delete Command> icon. Undo Delete Command. Clicking the icon reverses the last <Delete Command>. Disable/Enable Command. To disable commands in the current script file,...
- Page 176 CHAPTER 10 IMAGINGWIN - MENU BAR For an automated experiment after the basic settings the experimental settings can be defined: Program Commands: TimeStep(s) determines a waiting time after the last command. This command implements the time needed for the previous command (maybe 800 ms of the FvFm).
- Page 177 CHAPTER 10 IMAGINGWIN - MENU BAR Remark = to write a remark in the script file. This remark is not stored in the report file unless the command "Paste to Comment Line" is chosen. provides an empty row to the script file Spacer quits IMAGING-WIN Exit...
- Page 178 CHAPTER 10 IMAGINGWIN - MENU BAR Save Tiff Image = export selected image as tiff file Save Jpeg Image = export selected image as jpeg file General Settings: Set Gain = sets gain: = No to set gain to a desired value + or - No to raise or decrease gain by a desired number of steps Set Damping =...
-
Page 179: Exit
CHAPTER 10 IMAGINGWIN - MENU BAR Set Act. Width = sets actinic illumination (AL) width: = No to set the actinic illumination (AL) width to a desired duration (in seconds) + or - No to raise or decrease actinic illumination width by a desired number of seconds Set Sat. -
Page 180: Options
CHAPTER 10 IMAGINGWIN - MENU BAR 10.2 Options 10.2.1 Ruler The Ruler, which shows numbers from 0 to 100, is placed above the false color scale ranging from 0 to 1. Hence, the ruler may help to estimate the pixel value of a particular color. For example, yellow corresponds to pixel values around 0.2. -
Page 181: Info Icons
CHAPTER 10 IMAGINGWIN - MENU BAR After clicking this option, the Scale window is opened in which the length of the depicted scale bar can be defined by the user. In the case of the MAXI-version, for the standard working distance (18.5 cm) a standard scale width of 19 mm is proposed, which in principle can be modified by the user. - Page 182 CHAPTER 10 IMAGINGWIN - MENU BAR "Mean over AOI" should be disabled when the photosynthetically active object is "patchy", so that it is difficult or impossible to define an AOI with photosynthetic activity (e.g. patches of algae growing in a well). Definitions: Mean over AOI enabled: The pixel values over the whole area of the AOI are averaged and the average pixel value is displayed.
-
Page 183: Define Aoi-Array Geometry
CHAPTER 10 IMAGINGWIN - MENU BAR Fig. 68: Mean over AOI enabled (A) and disabled (B) 10.2.5 Define AOI-array geometry After clicking "Define AOI-array geometry" a window is opened in which the number of rows and lines of the array grid can be defined. After confirmation by O.K. -
Page 184: Create Aoi Array
CHAPTER 10 IMAGINGWIN - MENU BAR the upper left and lower right corners of the array. 10.2.6 Create AOI array: After the two corner AOIs are defined, the Create AOI-array Option can be carried out and the corresponding array will be displayed after some delay (calculation time). - Page 185 CHAPTER 10 IMAGINGWIN - MENU BAR In the above example an array of 24 AOIs with 4 rows and 6 lines in the center of a 96 well microtiter plate was defined. While all wells were filled with aliquots of algae suspension, only the 24 wells covered by the array contained increasing concentrations of the PSII inhibitor diuron, which is reflected by decreasing values of Y(II).
-
Page 186: Al-List
CHAPTER 10 IMAGINGWIN - MENU BAR 10.3 Al-List In the AL-List menu actinic light lists can be loaded, viewed and edited via LED currents / PAR values. In combination with an Ulm-500 Light Meter & Logger also a Light Calibration routine is available. - Page 187 CHAPTER 10 IMAGINGWIN - MENU BAR The PAR-List shows the LED current and PAR values for the Actinic Light intensity settings 0 - 20. LED Current as well as PAR values may be edited. Possible Current values range from 1 to 511. Changes in LED current values result in changes in LED light intensity.
-
Page 188: Light Calibration
CHAPTER 10 IMAGINGWIN - MENU BAR effective PAR at a particular setting does not correspond to one value, but rather to band of values with Gaussian distribution around a center value. Therefore differences between incident and effective PAR values may be expected. On the other hand, as most of the measured fluorescence originates from the leaf surface, the observed light response will be dominated by the upper cell layers where the incident intensity is effective. -
Page 189: Recalc
CHAPTER 10 IMAGINGWIN - MENU BAR 10.4 Recalc With the help of the Recalc Option it is possible to recalculate the data of a given Record on the basis of correction factors for Fm (or Fm') and F as already described in the sections on Fm Factor (9.5.13) and F Factor (9.5.14). -
Page 190: Transect
CHAPTER 10 IMAGINGWIN - MENU BAR recalculated on the basis of various Fm Factors to obtain a reasonably shaped saturation curve. A biphasic response curve without apparent saturation suggests that the applied Fm Factor is too high. If the response curve shows a maximum followed by a decline, this normally suggests that the applied Fm Factor is too low. - Page 191 CHAPTER 10 IMAGINGWIN - MENU BAR Upon clicking Define Endpoints a dialog window is opened in which the user may choose one out of 5 line widths and define the coordinates of the two endpoints of the line segment. With increasing line width the signal/noise ratio of the Transect plot is increased.
- Page 192 CHAPTER 10 IMAGINGWIN - MENU BAR The Pixel values of the selected Image parameter are plotted as a function of Pixel number along the line segment. In the lower left corner of the window the x-y coordinates of the two endpoints of the transecting line segment are displayed.
-
Page 193: 11 List Of Key Commands
CHAPTER 11 LIST OF KEY COMMANDS 11 List of key commands The IMAGING-PAM normally is operated via the ImagingWin user surface by cursor and mouse click operations. However, also some key commands are possible which in certain instances may be used as shortcuts. -
Page 194: 12 Technical Specifications
14.4 V/6 Ah 9 W (500 mA) drawn from internal Li-ion Power consumption: battery approx. 4 hours (IMAGING-PAM turned Recharging time: off) via Battery Charger 2120-N Operating temperature: -5 to +45 °C 25 cm x 10.5 cm x 11 cm (L x W x H) Dimensions: 2.1 kg (incl. -
Page 195: Imag-K7
CHAPTER 12 TECHNICAL SPECIFICATIONS 12.1.2 IMAG-K7 Black and white C-mount camera operated Design: in 10-bit-mode at 30 frames/sec featuring 1/2" (640 x 480 pixels) CCD Chip size: ® GigE-Vision Interface: 8,64 cm x 4,4 cm x 2,9 cm (L x W x H) Dimensions: (without objective lens) <200g... -
Page 196: Battery Charger 2120-N
CHAPTER 12 TECHNICAL SPECIFICATIONS Image: display different parameters Kinetics: time dependent changes of fluorescence parameters Light Curve: registration preprogrammed light response curves Report: numerical lists of parameter values for selected areas of interest Settings: instrument settings ... -
Page 197: Components Specifically Relating To Maxi-Version
CHAPTER 12 TECHNICAL SPECIFICATIONS 12.2 Components specifically relating to Maxi-version 12.2.1 LED-Array Illumination Unit IMAG-MAX/L LED-Array mounted on printed-circuit Design: board in aluminium housing with central opening for CCD Cameras IMAG-K6 or IMAG-K7 with miniature ventilator and cable connections to Control Unit IMAG- CG and External 300 W Power Supply (chapter 12.2.4) Light source for fluorescence excitation and actinic illumination:... -
Page 198: Led-Array Illumination Unit Imag-Max/Lr
CHAPTER 12 TECHNICAL SPECIFICATIONS 1.3 kg (incl. cable 1 m long) Weight: 12.2.2 LED-Array Illumination Unit IMAG-MAX/LR LED-Array mounted on printed-circuit Design: board in aluminium housing with central opening for CCD Cameras IMAG-K6 and IMAG-K7, filter plate IMAG-MAX/FR miniature ventilator cable connections to Control Unit IMAG-CG and External 300 W Power Supply (chapter... -
Page 199: Optional Filter Plate Imag-Max/F (Only For Imag-Max/L!)
CHAPTER 12 TECHNICAL SPECIFICATIONS 1.3 kg (incl. cable 1 m long) Weight: 12.2.3 Optional filter plate IMAG-MAX/F (only for IMAG-MAX/L!) Black-anodized aluminium plate with 44 Design: individual blue filters to be mounted in front collimating optics IMAG-MAX/L 1 mm blue-green glass filters (BG 39, Filter properties: Schott) blocking red transmission and passing 90 % of blue light... -
Page 200: K7-Max/S
CHAPTER 12 TECHNICAL SPECIFICATIONS 57 x 95 mm Dimensions: 430 g (without adapter-frame) Weight: φ55 mm, P=0.75 mm Filter Screw Size: C-Mount Mount: 8 to 48 mm Focal Length: Max. Aperture Ratio: 1 : 1.0 (f=8 to 28) to 1.2 (f=48) F/1.0 to F/22 Iris Range: -20°C to +50°C... -
Page 201: K6-Max/M And K7-Max/M
CHAPTER 12 TECHNICAL SPECIFICATIONS 12.5 mm Focal Length: F/1.4 to C Iris Range: -20°C to +50°C Temperature Range: 12.2.8 K6-MAX/M and K7-MAX/M mounting set IMAG-K6 or IMAG-K7 Design: camera on IMAG-MAX/L or IMAG- MAX/LR. Consisting of camera holder and metal rod 15 cm length, 15 mm diameter. 12.2.9 Mounting Stand with Eye Protection IMAG-MAX/GS Aluminium frame featuring two clamps for Design:... -
Page 202: Imag-Max/B
40 cm x 30 cm x 70 cm (L x W x H), Dimensions: 455 g Weight: 12.2.12 Transport Box IMAG-MAX/T Aluminium box with custom foam Design: packing for MAXI-IMAGING-PAM and accessories 60 cm x 40 cm x 25 cm (L x W x H) Dimensions: 5 kg Weight:... -
Page 203: Imag-Max/Gwk1
CHAPTER 12 TECHNICAL SPECIFICATIONS 12.2.13 IMAG-MAX/GWK1 Adapter Plate with legs and eye protection Design: for positioning IMAG-MAXI Head on 3010-GWK1 18.5 cm x 20 cm 17 cm (L x W x H) Dimensions: 856 g Weight: 12.3 Components specifically relating to MINI-version 12.3.1 IMAG-MIN/B 12 Luxeon LEDs 460 nm with individual Design:... -
Page 204: Imag-Min/R
CHAPTER 12 TECHNICAL SPECIFICATIONS 12.3.2 IMAG-MIN/R 12 Luxeon LEDs 620 nm with individual Design: short pass filters and collimator optics; 16 red 650 nm and 16 NIR 780 nm LEDs for measuring PAR-absorptivity; max. actinic intensity, 2500 µE/m²s; max. Saturation Pulse intensity, 7500 µE/m²s;... -
Page 205: K7-Min
CHAPTER 12 TECHNICAL SPECIFICATIONS 12.3.4 K7-MIN Cosmicar-Pentax objective lens Design: (F1.4/f=16 mm) detector filter (RG645, 3 mm) and short-pass interference filter ( λ < 770 nm), extension ring 4.2 mm 30 x 33 mm Dimensions: M27 x 0.5 Filter Screw Size: C-Mount Mount: 16 mm... -
Page 206: K7-Min/M And K6-Min/M
CHAPTER 12 TECHNICAL SPECIFICATIONS (instead of camera objective accessory detector filter RG645, 3 mm and short-pass interference filter λ < 770 nm). Featuring alternative detector filters for green or red fluorescence (special green filter set 500 - 575 nm and red filter RG665, 3 mm with short-pass interference filter λ... -
Page 207: St-1010
CHAPTER 12 TECHNICAL SPECIFICATIONS 12.3.10 ST-1010 Compact Tripod, for tripod heads with Design: UNC 1/4-20 screw threads. 12.3.11 IMAG-MIN/BK Leaf clip mountable on sample frame of all Design: MINI-Heads; MINI-Head holding grip 184 g Weight: 12.3.12 IMAG-MIN/GFS Adapter plate with snap-on-mount for Design: connecting IMAG-MINI Head to Standard Measuring Head 3010-S,... -
Page 208: Imag-L470M
CHAPTER 12 TECHNICAL SPECIFICATIONS 640 nm, video adapter 60N-C 2/3" 0,5x and standard lens Fluar 20x are already mounted. 12.4.2 IMAG-L470M Microscope LED Lamp Module 470 nm Design: (blue) for fluorescence excitation of Chl fluorescence most algae groups including cyanobacteria. Emission peak at 470 nm. -
Page 209: Imag-Ax-Ref
CHAPTER 12 TECHNICAL SPECIFICATIONS nm) or white light (mixed 620, 520 and 460 nm); featuring fluid light guide (100 cm length, 3 mm active dia.), connecting collimator optics excitation port epifluorescence microscope; with cable to be connected to RGB output socket at IMAG CG; featuring printed circuit board with separate drivers for RGB LEDs;... -
Page 210: 13 Warranty
WARRANTY CONDITIONS 13 Warranty All products supplied by the Heinz Walz GmbH, Germany, are warranted by Heinz Walz GmbH, Germany to be free from defects in material and workmanship for two (2) years from the shipping date (date on invoice). -
Page 211: Instructions To Obtain Warranty Service
All products being returned for warranty service must be carefully packed and sent freight prepaid. Heinz Walz GmbH, Germany is not responsible or liable, for missing components or damage to the unit caused by handling during shipping. All claims or damage should be directed to the shipping... - Page 212 CHAPTER 14 INDEX 14 Index 2 B 2120-N 10, 27, 46 Background Suppression 154, A Battery Charger 10, 27, 46 beam splitter 52, 53 Abs. 97, 107, 137 BG39 absolute intensities binning Absorptivity 76, 97, 107, 137 Buffer Memory Actinic illumination Actinic Light C ...
- Page 213 CHAPTER 14 INDEX Create AOI-array event marker current fluorescence Expanded Color Cursor Export 86, 129 Export button D Ext. out External Light Source dark adaptation eye protection 14, 19, 25 dark fluorescence parameters dark fluorescence yield F dark-adaptation 69, 93 dark-recovery F 92 deconvolution...
- Page 214 CHAPTER 14 INDEX Ft-image image capture and analysis 90, Fv/Fm 83, 93 Fv/Fm Contrast Enhancement Image Correction 20, 44, 138, 154, 156 Fv/Fm-image image intensity Image Transformation imaged area 20, 24 G Image-window 74, 90 ImagingWin 27, 43, 46, 64 gas exchange ImagingWin software Genty...
- Page 215 CHAPTER 14 INDEX IMAG-RGB 46, 47 LED Modules Ind. Curve LED-Array 11, 12 Ind.+Rec. legs Induction Curves lens aperture Inh. Life Video Inhibition Light Calibration Installation light controls software line widths Introduction Live Video J M JEPG Manual recording JPEG MAXI-HEAD Maximal fluorescence yield 92 Maximal PS II quantum yield...
- Page 216 CHAPTER 14 INDEX mirroring samples P PAM Image (PIM)-file Mounting Stand PAR-Absorptivity 11, 29, 30, Multi Control Unit 33, 76, 98, 107 multiwell plate 12, 22 PAR-List 44, 88, 179 N photochemical quenching 104, near-infrared photosynthetic parameters 68 New Record 70, 84 Photosynthetically Active NIR Intensity...
- Page 217 CHAPTER 14 INDEX quantum yield of Saturation Pulse 69, 87, 88 nonregulated energy Save dissipation Scale quantum yield of regulated Screw Jack energy dissipation Setup files quenching coefficients Show commend signal enhancement signal/noise ratio R Skript commands Skript programming software Rapid Light Curves software installation Recalc...
- Page 218 14, 20, 24, Z 29, 42, 139, 173 Zoom 18, 112 X Heinz Walz GmbH, 2014 Heinz Walz GmbH Eichenring 6 91090 Effeltrich Germany Phone +49-(0)9133/7765-0 Telefax +49-(0)9133/5395 E-mail info@walz.com Internet www.walz.com...
Need help?
Do you have a question about the IMAGING-PAM and is the answer not in the manual?
Questions and answers