Advertisement
QUICK START GUIDE
fx-CG500
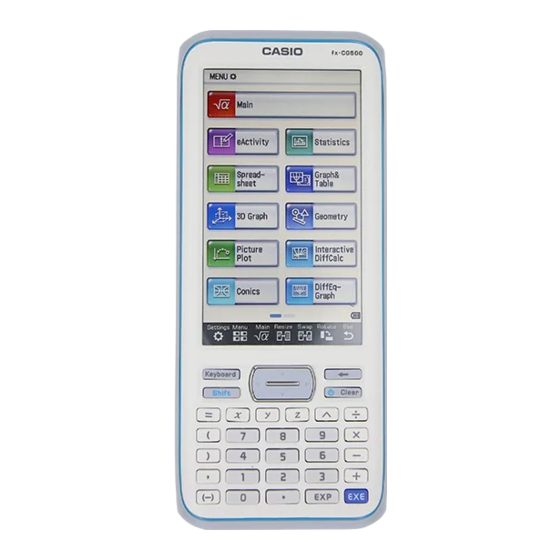
Tap any icon to select the application.
Tap m at any time to return to the
menu screen.
Tap to advance to the next page.
Tap M at any time to return to the Main menu.
In any menu application, press k for
the onscreen keyboard.
Press c to power on. Then press c
to clear commands. Press Kc to
power off.
Press these keys for numbers, basic
operations, and the most common variables
Press E to execute commands.
fx-CG500
www.casioeducation.com
Advertisement

Related Manuals for Casio FX-CG500


Summary of Contents for Casio FX-CG500
- Page 1 QUICK START GUIDE fx-CG500 Tap any icon to select the application. Tap m at any time to return to the menu screen. Tap to advance to the next page. Tap M at any time to return to the Main menu.
-
Page 2: Table Of Contents
Numerical Solve Menu ......Page 12 Graph and Table Menu ......Page 14 Conic Menu ......... Page 24 Statistics Menu ........Page 31 Author: John Diehl Casio Teacher Advisory Council Editors: Nathan Austin, Amber Branch, Amy Chow Casio Education, Curriculum and Training Department... -
Page 3: Main Menu
This expression can also be evaluated using a variable for substitution. A command in the form expression | variable = value means evaluate the expression with the given value(s) substituted for the variable(s). Press z16k_[)O2: +120-U_[=2E. fx-CG500 Quick Start Guide... - Page 4 Interactive and the Action menus. The Interactive commands open a dialogue box which gives prompts for the input. The fMax command uses x as the default variable, but another variable such as t can be used. fx-CG500 Quick Start Guide...
- Page 5 Tap Interactive, Calculation, fMin/fMax, fMax and complete the inputs as shown. (Part of the first coefficient, -16, has scrolled off the screen.) Then tap OK. 4. Rewrite the expression from Question 3 in factored form. Tap Interactive, Transformation, factor, factor. fx-CG500 Quick Start Guide...
- Page 6 5. This model expresses height, or position, as a function of time. Construct a model for velocity as a function of time. The velocity would be the derivative of the position function. Tap Interactive, Calculation, diff. fx-CG500 Quick Start Guide...
- Page 7 Enter the expression in the box. (Again, part of the first coefficient, -16, has scrolled off the screen.) Then tap OK. Alternately, the template for a derivative from Math2 can be used; the result will look the same. fx-CG500 Quick Start Guide...
- Page 8 The only difference is to tap the bullet for Derivative at value, and to enter the value in the last box. For a more intuitive display, use the derivative template from Math2 and the “with” ( ) command on Math3. fx-CG500 Quick Start Guide...
- Page 9 For another calculus connection, another integral can be used. The traditional approach is to use two integrals, but it is quicker to use the absolute value template, which can be found in fx-CG500 Quick Start Guide...
- Page 10 Enter the equation in the box by pressing and tap to view the variables. The negative sign is to the left of 16 and has scrolled off. Enter the variable in the second box and tap key; then tap OK. or press the fx-CG500 Quick Start Guide...
- Page 11 = -16t + vt + c, compute an expression for velocity as a function of time. Press and tap Enter the expression and the variable and tap or press the key. fx-CG500 Quick Start Guide...
-
Page 12: Numerical Solve Menu
Enter the equation. Note that a times symbol is needed between v and t to distinguish the product from a single variable named vt. Enter the values of 150, 56, and 120, select the bullet for t and tap fx-CG500 Quick Start Guide... - Page 13 2. If a ball is tossed upwards from an initial height of 120 feet, and has height of 160 feet after 2 seconds, compute the initial velocity. Enter the values of 160, 2, and 120, select the bullet for v and tap fx-CG500 Quick Start Guide...
-
Page 14: Graph And Table Menu
From the Menu, select the Graph & Table icon. Enter the function as y1. To set a window, tap , enter the values and tap to graph. fx-CG500 Quick Start Guide... - Page 15 2. Compute the height of the ball at time 4 seconds. To trace, tap . To find a specific value, press any one of the number keys; this will open a dialogue box. Then tap OK. fx-CG500 Quick Start Guide...
- Page 16 GRAPH & TABLE MENU Press to mark the point and keep the coordinates on the display. fx-CG500 Quick Start Guide...
- Page 17 GRAPH & TABLE MENU 3. Compute the times when the ball is at height 150 feet. Tap Analysis, G-Solve, x-Cal/y-Cal, x-Cal. Enter the value for y and tap OK. fx-CG500 Quick Start Guide...
- Page 18 Press to move to the second point. 4. Compute the time when the ball hits the ground. To compute an x-intercept, tap the icon at the top of the screen, then tap fx-CG500 Quick Start Guide...
- Page 19 For a maximum point, tap the icon at the top of the screen, then tap 6. Construct a table of values for times {0, 1, 2, 3, 4, 5}. To set the table, tap Enter the values and tap OK. fx-CG500 Quick Start Guide...
- Page 20 GRAPH & TABLE MENU To view the table, tap fx-CG500 Quick Start Guide...
- Page 21 + bx + c as the coefficients a, b, c are changed. Enter the function y1 = 1x + 0x + 0. The three coefficients are needed, as explained later. Set the window to Default. Graph the equation. fx-CG500 Quick Start Guide...
- Page 22 To explore the transformations, highlight one of the 3 coefficients and press to select that coefficient. Now use 3 and 2 to increase or decrease the coefficient, respectively, and see the graph transform. fx-CG500 Quick Start Guide...
- Page 23 GRAPH & TABLE MENU Alternately, to make changes without a step size, tap any one of the 3 coefficients, highlight it, enter a new value and press fx-CG500 Quick Start Guide...
-
Page 24: Conic Menu
Select the form for this hyperbola, and tap OK. Edit the coefficients A, B, H, and K. Highlight the letter and press the key for the number. For K, also change from subtraction to addition. to set the window, or use shortcuts after graphing. fx-CG500 Quick Start Guide... - Page 25 CONIC MENU to graph. to plot the graph in a full screen. The window can be changed by using "23 to scroll in any of the four directions, to zoom in, and to zoom out. fx-CG500 Quick Start Guide...
- Page 26 2. Display the vertices, foci, and asymptotes. For vertices, tap Analysis, G-Solve, Vertex. Press to mark the point and keep the coordi- nates on the display. Press to display the other vertex. Use G-Solve in the same manner for foci and asymptotes. fx-CG500 Quick Start Guide...
- Page 27 CONIC MENU 3. Convert the equation to a standard form. , then tap the equation window. , then select the bullet for general form, then tap OK. fx-CG500 Quick Start Guide...
- Page 28 – 3xy +4y – 5x + 6y – 7 = 0. Tap the bullet for general form, then tap OK. Edit the coefficients and the signs. The addition sign and the number can be highlighted together. fx-CG500 Quick Start Guide...
- Page 29 CONIC MENU to graph. to plot the graph in a full screen. The window can be changed by using #"23 to scroll in any of the four directions, to zoom in, and to zoom out. fx-CG500 Quick Start Guide...
- Page 30 CONIC MENU G-Solve commands may be used on rotated conics. fx-CG500 Quick Start Guide...
-
Page 31: Statistics Menu
To construct the chart, tap Column A so it is selected. If the graph icon is , tap it. Otherwise tap the near the top-right to open the graph menu and then tap from the drop down list. fx-CG500 Quick Start Guide... - Page 32 STATISTICS MENU Tap any section of the chart to display the frequency. fx-CG500 Quick Start Guide...
- Page 33 2. Construct a bar chart for these data. Select Column A again. Tap the near the upper- right corner to access the graph drop down menu. Then tap to construct a bar chart. fx-CG500 Quick Start Guide...
- Page 34 STATISTICS MENU The bar graph is displayed. Tap any bar to display the frequency. fx-CG500 Quick Start Guide...
- Page 35 Press to move to the next value. to setup the plot. Set Draw to On, set Type to Histogram, set XList to list1, and Freq to 1, as shown. Tap Set when complete. fx-CG500 Quick Start Guide...
- Page 36 STATISTICS MENU . Enter values for the starting value (HStart) and the step (Hstep), the width of each bin; then tap fx-CG500 Quick Start Guide...
- Page 37 STATISTICS MENU Tap Analysis, Trace to display the frequencies, using the directional pad to move through the data values. fx-CG500 Quick Start Guide...
- Page 38 Tap the list editor window. to setup the plot. Tap Off for StatGraph1, then tap the 2 tab to select StatGraph2. Select On, Medbox, list1, and 1 as shown. Tap the box to Show Outliers and tap Set. fx-CG500 Quick Start Guide...
- Page 39 STATISTICS MENU to view the box and whisker plot. Tap Analysis, Trace and use the directional pad to view the five number summary. fx-CG500 Quick Start Guide...
- Page 40 When the plot window is selected, the Calc com- mand is the third command. In either case, tap Calc, One-Variable. Select list1 for XList, 1 for Freq, and tap OK. One variable statistics are displayed; use the scroll bar to see additional information. fx-CG500 Quick Start Guide...
- Page 41 NOTES fx-CG500 Quick Start Guide...
- Page 42 NOTES fx-CG500 Quick Start Guide...
- Page 43 NOTES fx-CG500 Quick Start Guide...
- Page 44 See the complete line of Casio calculators www.casioeducation.com fx-CG500 Quick Start Guide...
Need help?
Do you have a question about the FX-CG500 and is the answer not in the manual?
Questions and answers