Table of Contents
Advertisement
Quick Links
PN 2633787
May 2006, Rev. 1, 9/06
© 2006 Fluke Corporation. All rights reserved. Printed in USA.
All product names are trademarks of their respective companies.
EtherScope
99 Washington Street
Melrose, MA 02176
Fax 781-665-0780
TestEquipmentDepot.com
Visit us at www.TestEquipmentDepot.com
Series II
TM
Network Assistant
Getting Started Guide
Advertisement
Table of Contents
Troubleshooting

Related Manuals for Fluke etherscope II


Summary of Contents for Fluke etherscope II
- Page 1 Fax 781-665-0780 TestEquipmentDepot.com Visit us at www.TestEquipmentDepot.com EtherScope Series II Network Assistant Getting Started Guide PN 2633787 May 2006, Rev. 1, 9/06 © 2006 Fluke Corporation. All rights reserved. Printed in USA. All product names are trademarks of their respective companies.
- Page 2 Ni-Cad, Ni-MH and Li-Ion batteries, cables or other peripherals are all considered parts or accessories. The warranty extends only to the original buyer or end user customer of a Fluke Networks authorized reseller, and does not apply to any product which, in Fluke Networks’ opinion, has been misused, abused, altered, neglected, contaminated, or damaged by accident or abnormal conditions of operation or handling.
- Page 3 4. TERM. This license is effective upon your acceptance of the above agreement and shall remain in effect until termination by (a) written notification to Fluke Networks or (b) a failure on your part to comply with the license agreement. Upon termination of the license agree- ment, you shall return to Fluke Networks or destroy all copies of the software product and associated written materials.
- Page 4 (including, without limitations, indirect, consequential, or incidental damages, damages for loss of business profits, business interruption, loss of business information, or other pecuniary loss) arising out of the use or inability to use this software product, even if Fluke Networks has been advised of the possibility of such damages.
- Page 5 The EtherScope™ Series II Network Assistant is powered in part by the Linux Operating System and other publicly available software. A machine-readable copy of the corresponding source code is available for the cost of distribution. Please contact the Fluke Networks Techni- cal Assistance Center (1-800-283-5853) and visit the GNU web site (http://www.gnu.org) for more information.
-
Page 6: Table Of Contents
Optional Accessories ....................9 Safety and Operational Information............... 10 Registering Your EtherScope Series IINetwork Assistant ........12 Care and Maintenance..................... 13 Contacting Fluke Networks ..................13 Before You Begin......................14 Turning the Instrument On and Off................ 14 Using the Stylus ......................15... - Page 7 ™ EtherScope Getting Started Guide Adjusting the Brightness of the Screen ..............16 Setting the Time and Date ..................16 Updating the Instrument’s Software ..............17 Recalibrating the Screen ..................18 Enabling Software Options ..................18 Displaying Hardware and Software Version Information ........19 The Power Supply ....................
- Page 8 Contents (continued) VLAN Discovery Test .................... 57 Nearest Switch Test ..................... 59 Switch Scan Test ....................60 Key Devices Test ....................62 Problem Detection ....................64 Deleting a Problem from the Log............... 66 RFC 2544 Tests ......................67 The Remote Device....................67 Configuring the RFC 2544 Tests................
- Page 9 ™ EtherScope Getting Started Guide Channels Test ...................... 88 Device Discovery Test..................91 Network Discovery ....................94 Site Survey ......................95 Security Scan......................97 Key Devices Test ....................98 Problem Detection ....................98 Configuring the Instrument for a Wireless LAN............. 98 Wireless TCP/IP Settings ..................
- Page 10 Contents (continued) Locate ........................111 Link ........................... 112 Login Diagnosis ......................112 Signal Strength......................112 WLAN Statistics......................112 Tx/Rx Rate ......................... 113 Accessing the Instrument Remotely (LAN only) ............113 Using the Desktop Tools....................117 Applications Menu ....................117 Tools Menu ....................... 118 Troubleshooting Your Instrument ................
-
Page 11: List Of Tables
List of Tables Table Title Page List of Standard Accessories....................6 Optional Accessories ......................9 International Electrical Symbols ..................10... - Page 12 List of Figures Figure Title Page Standard Accessories......................5 Charging and Removing the Battery .................. 23 EtherScope Network Assistant’s Physical Features ............. 26 Status LEDs ........................... 27 Screen Level-Help ......................... 35 LAN Test Results Screen ....................... 38 Testing Cables ........................40 Cable Verification Screen.....................
- Page 13 ™ EtherScope Getting Started Guide Problem Log......................... 65 Traffic Generation Screen ....................72 Throughput Test Results...................... 74 Instrument Settings—TCP/IP Screen..................75 Instrument Settings–Security Screen- ................. 80 Inserting the Fiber Adapter....................84 Wireless LAN Test Results Screen ..................86 Channel Test Details Screen ....................89 Security Scan ........................
-
Page 14: About This Guide
EtherScope ™ Series II Network Assistant About This Guide Introduction This EtherScope™ Series II Network Assistant Getting EtherScope™ Series II Network Assistant (hereafter also Started Guide introduces you to the features and referred to as “the instrument” or “EtherScope Network functions of your EtherScope™... -
Page 15: Features
EtherScope™ Series II Getting Started Guide Features Available Models EtherScope Network Assistant provides critical EtherScope Network Assistant is available in the performance metrics about your wired and wireless following models: LANs. The instrument’s autotest feature quickly verifies • Wired LAN model (ES2-LAN): a base model that performance at the physical layer, discovers networks supports monitoring and testing of 10/100/1000 IEEE and devices, and identifies configuration and... -
Page 16: Available Options
Network Assistant Introduction • Wireless LAN model (ES2-WLAN): a base model that Available Options supports monitoring and testing of 802.11 a/b/g You can expand your ability to monitor and troubleshoot devices connected to a wireless LAN. Automatically your site’s LANs by adding the following options to a scans all channels to gather and report statistics on base-model EtherScope Network Assistant: the health and status of the network. -
Page 17: Package Contents
See “Contacting Fluke Networks” on page 13 for various ways to contact Test Equipment Depot - 800.517.8431 - 99 Washington Street Melrose, MA 02176 FAX 781.665.0780 - TestEquipmentDepot.com... - Page 18 Network Assistant Introduction LC-1 LC-3 North American Europe LC-4 LC-5 Swiss LC-6 LC-7 Australia South Africa CompactFlash Memory Card WLAN eih04f.eps Figure 1. Standard Accessories...
- Page 19 EtherScope™ Series II Getting Started Guide Table 1. List of Standard Accessories Item Item Description Number EtherScope™ Series II Network EtherScope Series II Network Assistant mainframe. Assistant Holster Removable, form-fitting yellow holster. Stylus Stylus for use with the instrument’s touch screen display. Storage Case Case for carrying and storing the instrument.
- Page 20 EtherScope Resource CD. Includes On-line Help and Getting Started Guides. WLAN card Fluke Networks EtherScope Wireless LAN Adapter IEE 802.11 a/b/g. This is a standard accessory for the ES2-WLAN, ES2-PRO, and ES2-PRO/I models. ES2-SX-Pro fiber adapter Fluke Networks EtherScope Fiber LAN Adapter 1000BASE-SX. This is a fiber accessory for the ES2-SX-PRO, and ES2-SX-PRO/I models.
- Page 21 EtherScope™ Series II Getting Started Guide Table 1. List of Standard Accessories (continued) Item Item Description Number Network Patch Cord 1 meter patch cord. Universal adapter RJ-45 Female to female adapter. It is intended to be used to connect a RJ-45 Ethernet cable from the instrument to a WireView™...
-
Page 22: Optional Accessories
Network Assistant Introduction Optional Accessories Additional accessories available for purchase for your EtherScope Network Assistant are listed in Table 2. Contact Fluke Networks for buying information (see “Contacting Fluke Networks” on page 13). Table 2. Optional Accessories Item Description EtherScope Extended Test Kit... -
Page 23: Safety And Operational Information
EtherScope™ Series II Getting Started Guide Safety and Operational Information The international electrical symbols used in this document and on the instrument are described in Table 3. Table 3. International Electrical Symbols Complies to CSA C22.2 No. 950 Canadian Not for connection to public telephone systems standards, and UL 1950 (US standards) Do not dispose of Lithium Ion batteries in Please read the manual for safety information... -
Page 24: Registering Your Etherscope Series Iinetwork Assistant
Network Assistant Introduction Please observe the following safety regulations when • Do not connect a telephone line to this using your EtherScope Network Assistant: product. * Warning Class 1 Laser Product • If this product is used in a manner not specified by the manufacturer, the This product contains a Class 1 laser (EtherScope protection provided by the product may be... -
Page 25: Care And Maintenance
Knowledge Base library of product operation and application information and web-based trouble ticketing. You can also register the instrument by going to our In addition, you will receive Fluke Networks company and website at www.flukenetworks.com. To register: product information updates. -
Page 26: Before You Begin
EtherScope™ Series II Getting Started Guide Turning the Instrument On and Off Before You Begin To turn the EtherScope Network Assistant on, press the The information in this section acquaints you with the green On/Off button. This button is located on the right basic operations and functions of your instrument so that side of the instrument’s front panel. -
Page 27: Using The Stylus
Network Assistant Before You Begin Using the Stylus Selecting the LAN or WLAN Interface The stylus, which is used for navigating the user interface, If your instrument has the capability to test both a wired is stored in the right side panel near the green On/Off LAN (RJ-45 or SFP fiber interfaces) and a wireless LAN, you button. -
Page 28: Adjusting The Brightness Of The Screen
EtherScope™ Series II Getting Started Guide Adjusting the Brightness of the Screen Setting the Time and Date The current time is displayed in the lower right corner of Note the status bar. To change the time and date, do the The degree of brightness is a significant factor in following: conserving battery power. -
Page 29: Updating The Instrument's Software
The instrument automatically checks to determine automatically restarts and you can resume testing. whether a software update is available. If you encounter trouble updating the software, contact our Technical Assistance Center. See “Contacting Fluke Networks” on page 13 for contact information. -
Page 30: Recalibrating The Screen
Follow the instructions on the card to obtain a key code Recalibration aligns the instrument’s internal circuitry from the Fluke Networks website and use that key code with the screen so that it can correctly detect taps with to activate your option. -
Page 31: Displaying Hardware And Software Version Information
Network Assistant Before You Begin In the Current Key Code box, enter your key code. The Power Supply You can operate the instrument by using the rechargable Note Lithium-Ion battery. Alternatively, you can use the You can use a remote keyboard or tap supplied AC adapter charger (with or without the battery access the virtual keyboard. -
Page 32: Operating The Instrument On Battery Power
EtherScope™ Series II Getting Started Guide Charging the Battery Operating the Instrument on Battery Power When the instrument is running on battery power, it is Figure 2 shows you how to charge the battery. Note that capable of approximately four full hours of operation in you can charge the battery while it is installed or you can remove it and charge it in an external battery charger. - Page 33 Network Assistant Before You Begin • When fully discharged, the battery takes approximately 4 To take the instrument out of Suspend mode, press 1/2 hours to reach a full charge if the instrument is the On/Off button. Release this button as soon as the powered off.
-
Page 34: Operating The Instrument On Ac Power
EtherScope™ Series II Getting Started Guide Removing and Installing the Battery Operating the Instrument on AC Power The battery is located behind the product stand. When the instrument is connected to AC power, you can use the power supply as a continuous power source. In To remove the battery, refer to the diagram in Figure 2 this way, you can test for long periods of time without and do the following:... -
Page 35: Charging And Removing The Battery
Network Assistant Before You Begin LC-4 LC-1 LC-3 North American Europe LC-7 LC-5 South Africa LC-6 Swiss Australia eih30f.eps Figure 2. Charging and Removing the Battery... -
Page 36: Etherscope Network Assistant's Physical Features
SLOT 1: a PCMCIA/CardBus ® interface that supports • right side panel near the green On/Off button. an 802.11 wireless network. Accepts Fluke Networks EtherScope Wireless LAN Adapter IEEE 802.11 a/b/g. Figure 3 illustrates the EtherScope Network Assistant’s physical features. -
Page 37: Locating The External Interfaces
Network Assistant Before You Begin Locating the External Interfaces SLOT 2 is located on the top side panel. This interface accepts a CompactFlash ® (type 1 and 2) memory card.This The following external interfaces are located on the memory card enables you to store test data and instrument’s right side panel: temporarily hold files that are transferred from a PC •... -
Page 38: Etherscope Network Assistant's Physical Features
EtherScope™ Series II Getting Started Guide Fiber LAN Connector PCMCIA/CardBus SLOT 1 RJ45 LAN Connector Compact Flash SLOT 2 Stylus Strap Attach DB9 Serial Port Headphone Jack Kensington Lock Microphone (left side) Jack USB Port Stand Power Jack Removeable Battery Pack eih31f.eps Figure 3. -
Page 39: Status Leds
Network Assistant Before You Begin These LEDs provide instant, visible feedback on the state Status LEDs of your network and indicate conditions relative to the Five status LEDs are located at the top of the front panel, type of of interface (LAN RJ-45 or wireless) you are as shown in Figure 4: testing. - Page 40 EtherScope™ Series II Getting Started Guide • UTILIZATION LED Oversized packet: a packet that has more than 1518 bytes. Represents the percent bandwidth consumed on the • local network: Jabber: a packet that has more than 1518 bytes and also has an invalid checksum. •...
-
Page 41: Power Led
Network Assistant Before You Begin Wireless LAN Interface LEDs ERROR LED LINK LED Red: indicates an FCS error was detected in a received • packet. Green: 802.11b link established. • TRANSMIT LED Amber: 802.11a or 802.11g link established. • Green: indicates that packets are being transmitted. Off: no link is present. -
Page 42: The User Interface
EtherScope™ Series II Getting Started Guide Title Bar The User Interface The title bar is the horizontal area at the top of every The user interface is presented on a touch-sensitive, color screen that shows the name of the screen that is currently screen. - Page 43 Network Assistant Before You Begin • Toolbar : (WLAN only) indicates the current channel being scanned and shows linked status when the The toolbar is the first row of buttons located at the instrument is in a WLAN linked state. bottom of every screen.
- Page 44 EtherScope™ Series II Getting Started Guide • Settings: displays the Settings menu (see (Back): displays the previously displayed screen. “Personalizing Your EtherScope Network • (Home): displays Test Results, the top-level user Assistant” on page 34). interface screen. Suspend: puts the instrument in Suspend •...
-
Page 45: Navigating The User Interface
Network Assistant Before You Begin To the far right, the instrument displays the currently set Navigating the User Interface time. To change the date and time, see “Setting the Time Following are some general guidelines for navigating the and Date” on page 16. user interface: Additional icons give you status on the following;... -
Page 46: Personalizing Your Etherscope Network Assistant
EtherScope™ Series II Getting Started Guide • • To sort data in a table, tap the desired column Date/Time Sets the date and time and changes the date/time heading. A directional arrow indicates the column formats. you are sorting on and the direction (ascending descending ) of the sort. -
Page 47: Getting Help
Network Assistant Before You Begin Getting Help Note that Help for the current screen is displayed in the main pane. To move through the information, drag the Screen-level Help is context-sensitive. It provides detailed scroll box. The browser window is resizable so that you “how to”... -
Page 48: Monitoring And Troubleshooting A Wired Lan
EtherScope™ Series II Getting Started Guide If the instrument acquires a valid IP address, it Monitoring and Troubleshooting a automatically runs a series of tests that include verifying Wired LAN the cable and signal, gathering network utilization and bandwidth statistics, and actively discovering networks, After you connect the instrument to your network and services, and devices using the network. -
Page 49: Connecting To A Wired Network
Network Assistant Monitoring and Troubleshooting a Wired LAN Connect to the network (see “Connecting to a Wired Connecting to a Wired Network Network “on page 37). To connect to the network, plug one end of an Ethernet cable into the instrument’s RJ-45 LAN connector and the After you turn on and connect the instrument, it other end of the cable into the network segment you are goes through a complete power-up sequence, which... -
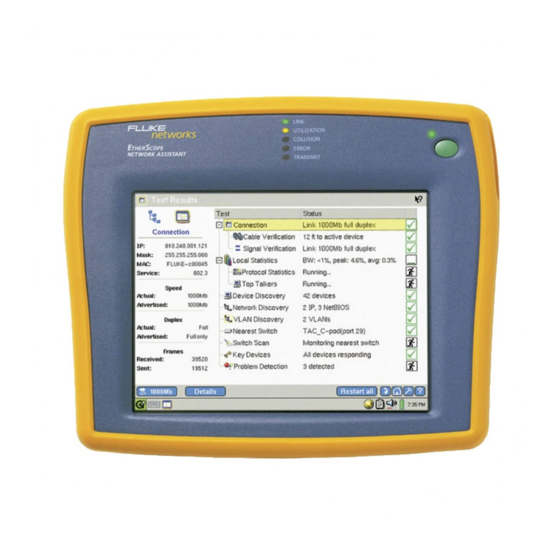
Page 50: Viewing Autotest Results
EtherScope™ Series II Getting Started Guide Viewing AutoTest Results The Test Results screen gives you at-a-glance visibility into the state of your network. The main pane on the After you power on the EtherScope Network Assistant right displays the name of each test and reports its status. and connect to the network, the instrument runs a series Note the status icons that appear along the right. -
Page 51: Connection Test
Network Assistant Monitoring and Troubleshooting a Wired LAN You can get quick idea of the overall health of your Figure 7 illustrates various cabling test configurations. network and see what devices and services are running After you connect and power on the instrument, it by tapping each test in the main pane and then viewing automatically detects the type of connection (for a summary of its findings in the preview pane. -
Page 52: Testing Cables
EtherScope™ Series II Getting Started Guide MDI-X LINK NIC testing Network LINK UTILIZATION UTILIZATION COLLISION COLLISION ERROR ERROR TRANSMIT TRANSMIT monitoring Cable test Cable test terminated cable live network Universal Adapter Cable test LINK LINK Cable test UTILIZATION UTILIZATION COLLISION COLLISION ERROR ERROR... - Page 53 Connection Test displays of the connection. the Fiber Loss Test which requires that the optional Fluke Networks’ Fiber Optic Meter be attached to the RJ45 port. In the main pane, tap the next to Connection to...
-
Page 54: Cable Verification Screen
EtherScope™ Series II Getting Started Guide After you run the autotest, tap Cable Verification to view initial autotest results for the cable: • The preview pane displays the length of the cable to the active device or termination. Individual wires are numbered and color-coded to identify pairs. - Page 55 Network Assistant Monitoring and Troubleshooting a Wired LAN To run the detailed test, tap To test signal power and loss on a fiber optic cable, select the Fiber option. Then, set up and run a Fiber Note Optic Meter (FOM) test. To run this test, the instrument must unlink Note from the network.
- Page 56 EtherScope™ Series II Getting Started Guide Signal Verification The preview pane shows the type of service on the connection. In addition, the actual and advertised speed The Signal Verification test is comprised of a suite of tests and duplex of the connection is provided, enabling you that analyze the quality of the signal and establish to compare determined values with negotiated values.
- Page 57 Network Assistant Monitoring and Troubleshooting a Wired LAN The main pane (see Figure 9) displays results from the To run the full suite of signal verification tests, do the following; four Signal Verification tests. The tests are designed to provide visibility into possible link quality and .
-
Page 58: Signal Verification Screen
EtherScope™ Series II Getting Started Guide • • Signal Levels: No signal, NLP (Normal Link Pulse), FLP Auto-negotiation Signals: FLP signals from the auto- (Fast Link Pulse) and Data signals and their negotiation sequence display what the cable amplitudes are monitored and displayed. connection source (link partner) advertised and what the EtherScope Network Assistant advertised. -
Page 59: Local Statistics Test
Network Assistant Monitoring and Troubleshooting a Wired LAN Local Statistics Test The preview pane (Figure 10) presents a profile of the types of traffic seen on the network. In the top The Local Statistics test reports local and remote half of the pane, the types of traffic are classified bandwidth utilization and errors seen on the network. - Page 60 EtherScope™ Series II Getting Started Guide • Tap the next to Local Statistics to expand the list Top Talkers: identifies the top 10 devices that and show its subtests: are the highest consumers of bandwidth on the local network segment and provides a breakout •...
-
Page 61: Utilization History Screen
Network Assistant Monitoring and Troubleshooting a Wired LAN Viewing the Local Statistics Details On this screen, you can: If the summary reports indicate problems, check the • Look at the different types of traffic present on the detailed results to see if you can determine the source of network segment. - Page 62 EtherScope™ Series II Getting Started Guide • Viewing Details for Protocol Statistics, Top Talkers, and Get visibility into remote devices and segments VLAN Statistics without directly connecting to them. To do this, choose a discovered switch and interface source To view details: from the Source selection box.
- Page 63 Network Assistant Monitoring and Troubleshooting a Wired LAN • Top Talkers: the main pane lists all the If the instrument is connected to a port that discovered devices that are generating traffic on is configured with 802.1Q VLAN tagging the local network segment. and the instrument is not so configured, or if 802.1Q is enabled on the instrument but •...
-
Page 64: Device Discovery Test
EtherScope™ Series II Getting Started Guide Device Discovery Test To view results: As soon as the EtherScope Network Assistant is In the main pane, tap Device Discovery. connected, it performs active SNMP discovery for all The preview pane displays an inventory of the network devices. - Page 65 Network Assistant Monitoring and Troubleshooting a Wired LAN You can also see whether the device is experiencing Key Devices any problems. SNMP Agents Drag the scroll bar or tap the directional arrows at the bottom of the main pane to Hosts bring all of the information about a device into view.
-
Page 66: Device Discovery Screen
EtherScope™ Series II Getting Started Guide To obtain device-specific information, select the to view obtain detailed information desired device. about the device. The upper portion of the preview pane (Figure 12) The Device Details screen provides name, address, shows the IP and MAC address information for the domain, and nearest switch information about the device you selected while the lower portion device, as shown in Figure 13:... - Page 67 Network Assistant Monitoring and Troubleshooting a Wired LAN From this screen, you can also run specialized tests (such To add a device to the discovery database: as Trace Switch Route, Trace Route, or Ping) to (located in the top left corner of the screen) troubleshoot connectivity or performance problems and then select Instrument Settings.
-
Page 68: Network Discovery Test
EtherScope™ Series II Getting Started Guide Network Discovery Test To view detailed results for Network Discovery: The Network Discovery test scans the local segment, • In the preview pane, tap the desired network looking for what networks are present and how they are group. -
Page 69: Vlan Discovery Test
Network Assistant Monitoring and Troubleshooting a Wired LAN VLAN Discovery Test Tap VLAN Discovery. The VLAN Discovery test identifies all of the VLANS The preview pane (see Figure 14) displays the total discovered on the network segment that the instrument number of discovered VLANs. -
Page 70: Vlan Discovery Screen
EtherScope™ Series II Getting Started Guide to display the VLAN Discovery screen. To see the member switch interfaces within a particular VLAN, select the desired VLAN. Then tap to expand the list. VLANs that have no associated switch interfaces simply display the switches that reference this VLAN. To get general information for a particular VLAN/Interface, select it. -
Page 71: Nearest Switch Test
Network Assistant Monitoring and Troubleshooting a Wired LAN Nearest Switch Test As shown in Figure 15, the preview pane displays the IP address of the switch along with its VLAN An integral part of discovery is locating the switches on identifier and port number. -
Page 72: Switch Scan Test
EtherScope™ Series II Getting Started Guide To set up and run a test, tap the associated hyperlink in the preview pane. (See “Running the Diagnostic Note Tests” on page 108 for descriptions of these tests). If no switch is selected, select one from the Switch Scan Test Select a device list box. -
Page 73: Switch Scan Screen
Network Assistant Monitoring and Troubleshooting a Wired LAN To view details for a particular interface: Select the desired interface. The top portion of the preview pane shows the port number, VLAN identifier, speed of the interface, and number of connected hosts. -
Page 74: Key Devices Test
EtherScope™ Series II Getting Started Guide Defining Key Devices Key Devices Test The Key Devices test checks the availability of critical or To define a key device, do the following: “key” devices on your network. You can use this test to On the Test Results screen, select Key Devices. - Page 75 Network Assistant Monitoring and Troubleshooting a Wired LAN Do one of the following: To ensure that the instrument discovers the device, tap (to check) the Add to device • If the instrument discovered the device: discovery? box and supply the MAC address.
-
Page 76: Problem Detection
EtherScope™ Series II Getting Started Guide Problem Detection The preview pane shows the number of problems detected in each of the following severity groups: The Problem Detection test checks each discovered device to determine if it is experiencing any problems. If a •... -
Page 77: Problem Log
Network Assistant Monitoring and Troubleshooting a Wired LAN If errors are indicated, tap to look at the The main pane lists each device that is experiencing Problem Log (Figure 18): a problem. The Description column provides a brief description of the nature of the problem along with its assigned severity level. -
Page 78: Deleting A Problem From The Log
EtherScope™ Series II Getting Started Guide Deleting a Problem from the Log to view detailed information about the device. To delete a problem from the log: The Device Details screen (Figure 13) is displayed. On Select the problem. this screen, you obtain specific information about the device. -
Page 79: Rfc 2544 Tests
Network Assistant Monitoring and Troubleshooting a Wired LAN RFC 2544 Tests The Remote Device The remote device operates as the DUT (Device under The RFC 2544 tests enable you to measure the Test). The remote device must be an EtherScope Network performance of your network. -
Page 80: Configuring The Rfc 2544 Tests
EtherScope™ Series II Getting Started Guide Specifying the IP Address of the Remote Device Click You can designate a device for use in all of the RFC 2544 Note tests or you can designate a particular device for each individual test. Repeat this procedure to add additional devices for use in the individual tests. - Page 81 Network Assistant Monitoring and Troubleshooting a Wired LAN Global Configuration Parameters next to RFC 2544 to display the list of subtests and devices. To set configuration parameters that apply to all RFC 2544 tests and devices: Select the desired subtest or device and then tap to display the configuration screen and set Select RFC 2544 Tests and then tap the desired parameters.
-
Page 82: Running An Rfc 2544 Test
EtherScope™ Series II Getting Started Guide • Running an RFC 2544 Test To view Latency test results: To run a test: Select a device under RFC 2544 Latency and then tap Select the desired test from the RFC 2544 Performance Tests screen. Use the radio buttons to select the View Mode (table or graph). -
Page 83: Ito Tests
Network Assistant Monitoring and Troubleshooting a Wired LAN ITO Tests Traffic Generator To run the Traffic Generator test: The EtherScope Network Assistant features two ITO (Internet Throughput Option) tests: In the main pane, tap next to ITO Tests to view •... -
Page 84: Throughput Test
EtherScope™ Series II Getting Started Guide Throughput Test To run the Throughput test, you need two instruments: one that functions as the local unit and a second that serves as the remote unit. The remote unit can be any of the following: a second EtherScope Network Assistant, a OneTouch™... - Page 85 Network Assistant Monitoring and Troubleshooting a Wired LAN Configuring the Local Unit and Starting the Test On the remote EtherScope Network Assistant, tap . Then, select Instrument Settings. On the local unit, complete the following: In the preview pane, tap the General hyperlink.
-
Page 86: Configuring The Instrument For A Wired Lan
EtherScope™ Series II Getting Started Guide to end the test. to begin the test. Configuring the Instrument for a Wired LAN As the test progresses, Throughput results are continuously updated. Although EtherScope Network Assistant is designed to provide as much automated configuration as possible, The local unit keeps track of the number of frames every network is different. -
Page 87: Tcp/Ip Settings
Network Assistant Monitoring and Troubleshooting a Wired LAN On this screen, you configure the instrument’s TCP/IP TCP/IP Settings settings: If DHCP is available, the Instrument Settings—TCP/IP screen (Figure 21) displays the address that the instrument is able to obtain. If you want to manually configure the IP address or change the subnet mask, do the following: Note When manually assigning an IP address, you can... -
Page 88: 802.1Q/Ip Tos Settings
EtherScope™ Series II Getting Started Guide For the address field that you want to change, do In the preview pane, tap 802.1Q/IP TOS to display the the following: Instrument Settings— 802.1Q/IP TOS screen. This screen enables you to configure the instrument for tagged •... - Page 89 Network Assistant Monitoring and Troubleshooting a Wired LAN In the 8021Q Settings section, do the following: In the TOS (Type of Service) section, select one of the following: Check Enable 802.1Q to select 802.1Q tagging • mode. TOS with IP Precedence then check one of the type of service parameters (Delay, Throughput, This setting denotes a new frame format Reliability, or Cost) and select a priority in the IP...
-
Page 90: 802.1X Settings
EtherScope™ Series II Getting Started Guide • 802.1X Settings TTLS CHAP • TTLS MSCHAP The 802.1X standard defines the mechanism for port- • TTLS MSCHAP-V2 based network access control. This provides a means of • authenticating and authorizing devices attached to a TTLS EAP-MD5 LAN port. -
Page 91: Connection Log
Network Assistant Monitoring and Troubleshooting a Wired LAN Connection Log At the bottom of this screen, a factory assigned MAC address is shown. You can change this address to enable The Connection Log provides detail about the 802.1X testing of switch forwarding tables and ARP caches as authentication and authorization process, and part of the troubleshooting process. -
Page 92: Instrument Settings-Security Screen
EtherScope™ Series II Getting Started Guide If a field is password-protected, this symbol denotes that the field is secure:"*". The fields and controls on the Security screen are disabled until a user successfully enters the password and logs in using the Login button. On the Security screen, you can also configure the instrument’s SNMP community strings. -
Page 93: General Settings
Network Assistant Monitoring and Troubleshooting a Wired LAN • General Settings Remote RFC 2544/ITO Throughput Testing: enables/disables the instrument to serve as the RFC On the Instrument Settings— General screen, you can 2544/ITO Throughput remote server and to change the following settings for your EtherScope interoperate with another EtherScope Network Network Assistant: Assistant serving as the local unit during a remote... -
Page 94: Monitoring And Troubleshooting A Fiber Lan
EtherScope™ Series II Getting Started Guide Enable fast connect mode (applies to wired LAN Edit SNMP System Name: tap and then only): lets you quickly obtain a network link and supply a new SNMP system name for the DHCP address. instrument. -
Page 95: Installing And Removing An Sfp Fiber Adapter
Network Assistant Monitoring and Troubleshooting a Fiber LAN All the existing LAN features are supported when Installing and Removing an SFP Fiber Adapter EtherScope is connected to gigabit fiber interface with To install an SFP fiber adapter: the following exceptions: With the instrument turned off, remove the •... -
Page 96: Inserting The Fiber Adapter
EtherScope™ Series II Getting Started Guide To remove the fiber adapter: Make sure the instrument is turned off. Press the release tab located on the back of the adapter. W Caution Remove fiber Do not pull the fiber adapter without pressing adapter dust the release tab or damage to the adapter may cover. -
Page 97: Monitoring And Troubleshooting A Wireless Lan
Network Assistant Monitoring and Troubleshooting a Wireless LAN EtherScope Network Assistant runs a series of passive Monitoring and Troubleshooting a scan tests then attempts to establish a link to an AP Wireless LAN that is configured with the default SSID. The basic steps for monitoring a wireless LAN (WLAN) are View autotest results. -
Page 98: Viewing Autotest Results
EtherScope™ Series II Getting Started Guide Viewing AutoTest Results The main pane displays the name of each test and reports its status. The icons along the right side give you After you power on the instrument, it runs the a visual indication of the progress and status of each test: automated tests and displays the Test Results screen, as •... -
Page 99: Connection Test
Network Assistant Monitoring and Troubleshooting a Wireless LAN You can get a quick idea of the overall health of your After autotest runs, the Connection test is highlighted. network and see what devices and services are running The Status column reports the results of the attempt to by tapping each test listed in the main pane and then connect: viewing its summary results in the preview pane. -
Page 100: Channels Test
EtherScope™ Series II Getting Started Guide EtherScope Network Assistant runs in active scan mode, Channels Test in which it continuously monitors active channels. The The Channels Test scans all channels in the 802.11a and Scan button in the lower left corner updates you on 802.11 b/g spectrums to locate active channels, active which channels are being scanned. -
Page 101: Channel Test Details Screen
Network Assistant Monitoring and Troubleshooting a Wireless LAN To view statistics for individual channels, tap The list of all channels is displayed. To monitor basic vital signs, such as signal strength or noise, select the desired metric from the Channel Metric box. - Page 102 EtherScope™ Series II Getting Started Guide The Channels test contains two subtests: To view channel details, do one of the following: • • Utilization To focus on a particular channel, tap the desired hyperlink in the preview pane. • Top Talkers •...
-
Page 103: Device Discovery Test
Network Assistant Monitoring and Troubleshooting a Wireless LAN Top Talkers Device Discovery Test The Top Talkers test monitors the network to locate After a successful autolink, the instrument performs devices that are consuming the most bandwidth. active discovery, searching for APs and network devices. The instrument examines each device it discovers to learn Tap Top Talkers. - Page 104 EtherScope™ Series II Getting Started Guide A break out of the number of devices in each of the To obtain detailed information for a particular following categories is displayed: device, select it. Then, tap • Access Points Note • If a device you are interested in tracking is not Mobile Clients discovered by the instrument, you can add it to •...
- Page 105 Network Assistant Monitoring and Troubleshooting a Wireless LAN Device Discovery has two subtests: to obtain more detailed information about the AP. • AP Top Talker On the Device “details” screen, you can tap one of • Client Top Talker the hyperlinks to look view specific metrics, such as signal strength or Tx/Rx information.
-
Page 106: Network Discovery
EtherScope™ Series II Getting Started Guide Client Top Talker Network Discovery The Client Top Talker test identifies the device that is The Network Discovery test scans the wireless consuming the most bandwidth. environment and discovers all networks within range. Tap Client Top Talker. Tap Network Discovery. -
Page 107: Site Survey
Network Assistant Monitoring and Troubleshooting a Wireless LAN To view details for one of the network components, Site Survey tap the associated hyperlink in the preview pane. The Site Survey test enables you to gather information on the APs in your WLAN. You can use Site Survey The Network Discovery details screen shows you the information as a starting point for planning and network hierarchy, which provides an indication of... - Page 108 EtherScope™ Series II Getting Started Guide Do one of the following; If you want to save the data obtained from a site survey. Do the following: • To look at detailed information for a particular AP, tap the associated MAC address hyperlink in •...
-
Page 109: Security Scan
Network Assistant Monitoring and Troubleshooting a Wireless LAN Security Scan Note To obtain meaningful results from a Security Scan, you should first configure the instrument to identify authorized devices. See “Wireless Authorization Settings” on page 102 to find out how to set a device’s authorization level. The Security Scan test performs a security check on your network. -
Page 110: Key Devices Test
EtherScope™ Series II Getting Started Guide Problem Detection The Problem Detection test checks each discovered device The Security Scan details screen lists the names and in your WLAN for problems. If a problem is detected, it is SSIDs of devices with security issues within the entered into the Problem Log. -
Page 111: Wireless Tcp/Ip Settings
Network Assistant Monitoring and Troubleshooting a Wireless LAN Wireless TCP/IP Settings To configure your wireless LAN’s TCP/IP settings, tap the TCP/IP hyperlink. For information about this screen, see “TCP/IP Settings” on page 75. Wireless Security Settings This screen enables you to manage the instrument’s security parameters. -
Page 112: Connection Log
EtherScope™ Series II Getting Started Guide On the Wireless Instrument Settings—Security Connection Log screen, configure the following: The Connection Log provides detail about the wireless authentication and authorization process, and • SSID indicates whether it passed or failed. It also provides From the drop-down list, select the Service Set DHCP detail to which servers reply to DHCP requests Identifier (SSID) that identifies the WLAN to link... -
Page 113: Wireless Instrument Security Settings
Network Assistant Monitoring and Troubleshooting a Wireless LAN • Signal Strength: if necessary, drag the slider to Wireless Instrument Security Settings fine tune signal strength settings. The Offset is Tap the Instrument Security hyperlink to display the only available if Show dBm is selected. Instrument Security configuration screen (Figure 28): •... -
Page 114: Wireless General Settings
EtherScope™ Series II Getting Started Guide On the Instrument Security screen, you can create a Wireless Authorization Settings password to control access to the instrument and prevent On the Authorization screen, you can classify discovered unauthorized users from changing its security settings. clients and access points as Authorized, Unauthorized, or Neighbor. -
Page 115: Wireless Instrument Settings-Authorization Screen
Network Assistant Monitoring and Troubleshooting a Wireless LAN To reclassify a device, do the following: Select an individual device from the list or select an authorization level from the Select Current Level Tap the Authorization hyperlink to display the group box and then tap to select all Wireless Instrument Settings –... -
Page 116: Wireless Problem Settings
EtherScope™ Series II Getting Started Guide Wireless Problem Settings The Wireless Problems screen enables you to change the threshold setting for a problem and select which problems are reported. Note The threshold setting specifies a value above or below which a monitored class of events is considered a problem. -
Page 117: Documenting Your Network (Lan And Wlan)
Network Assistant Documenting Your Network (LAN and WLAN) For each problem whose threshold you want to Saving a Report change, select a value in the selection box. On most screens, a button is available that enables you to create reports and save them in a web- viewable file. -
Page 118: Managing Reports
EtherScope™ Series II Getting Started Guide and then supply a name for the report. Viewing a Report To view a report: to save. Managing Reports Note The following procedure shows you how to The File Manager provides access to your saved reports, view a report from the File Manager. -
Page 119: Renaming A Report
Network Assistant Documenting Your Network (LAN and WLAN) Renaming a Report Performing a Site Survey (WLAN only) To rename a report: Another way to document your WLAN is to do a site survey. A site survey can help ensure that your WLAN has From the File Manager list, select the file you want the best coverage and has no “dead spots”. -
Page 120: Running The Diagnostic Tests
EtherScope™ Series II Getting Started Guide • Running the Diagnostic Tests Signal Strength (WLAN only) • WLAN Statistics (WLAN only) EtherScope Network Assistant provides a set of • specialized tests that you can use to diagnose specific Tx/Rx Rate (WLAN only) network problems, such as connectivity and You can access the diagnostics tests in one of two ways: performance, and to obtain critical information about... -
Page 121: Ping
Network Assistant Running the Diagnostic Tests Ping Trace Switch Route The Ping test is a general-purpose connectivity tool that The Trace Switch Route test can help you solve you can use to determine if a device on the network is connectivity and configuration problems by tracing the reachable. -
Page 122: Wireless Throughput
EtherScope™ Series II Getting Started Guide Wireless Throughput The WLAN Throughput test measures the bandwidth of the connection to a WLAN (SSID) or to a specific AP. The device must be connected as a client to the network. The test uses the following methods to test the bandwidth: •... -
Page 123: Locate
Network Assistant Running the Diagnostic Tests Locate Signal strength measurements are displayed in a bar graph; power levels are shown in dBm’s. You use the Note pull-down menus and buttons to operate the graph: To run this test, you need to use an omni- •... -
Page 124: Link
EtherScope™ Series II Getting Started Guide Link Signal Strength The Signal Strength test measures signal strength and Note noise for the selected device. Before running this test, you need to configure the appropriate SSID. See “Wireless Security Tap the graph to view signal strength and noise data for Settings”... -
Page 125: Tx/Rx Rate
Network Assistant Accessing the Instrument Remotely (LAN only) • Unicast Accessing the Instrument Remotely • Retries (LAN only) • Errors You can control EtherScope Network Assistant and view You can change the sampling period by selecting a time its result screens from a remote location. The instrument interval from the Update every box. -
Page 126: Web Server Home Page
EtherScope™ Series II Getting Started Guide In the Address field, enter the IP address of the EtherScope Network Assistant that you want to connect to. Note The instrument’s IP address is located in the preview pane for the Test Results screen when the Connection test is highlighted. - Page 127 Test Results screen. However, for security reasons, you can set a password • Initiate a support incident at the Fluke Networks to restrict usage to authorized users only. website. See “Instrument Security Settings” on page 79 for instructions.
- Page 128 EtherScope™ Series II Getting Started Guide To access real-time reports: User Interface Events that will Terminate a Remote Session Click The active TCP/IP session between the remote user interface software and the instrument can be severed The EtherScope Real-Time Reports screen is under the following conditions: displayed.
-
Page 129: Using The Desktop Tools
Network Assistant Using the Desktop Tools • Using the Desktop Tools Clock: displays the time currently set on the instrument; includes a stop watch and alarm EtherScope Network Assistant is packaged with a number function. To change the time, see “Setting the Time of tools to increase your productivity. -
Page 130: Tools Menu
EtherScope™ Series II Getting Started Guide • • Report Viewer: displays a saved report. Telnet: lets you access a remote computer so that you can check or change its configurations. When • System Info: displays resource usage (memory, you run this program, EtherScope Network Assistant CPU, and storage) and version information of the acts as if it is a terminal connected to the remote Linux operating system. -
Page 131: Troubleshooting Your Instrument
Network Assistant Troubleshooting Your Instrument • Troubleshooting Your Instrument Port Reporter: a command-line utility that uses the Cisco Discovery Protocol (CDP) to discover switches This section lists some problems you might experience and switch details. You can use this utility in a Cisco with your EtherScope Network Assistant and provides environment to quickly discover and display suggestions to help you solve them. - Page 132 EtherScope™ Series II Getting Started Guide Problem Problem : The instrument does not power on. : The IP Discovery and/or Tools results screens are not displaying the expected results. Suggestion : Connect the instrument to the AC adapter. If Suggestion : Check the following: the instrument powers on only when connected to the AC adapter, the internal battery may be completely...
- Page 133 Network Assistant Troubleshooting Your Instrument • Problem : The touch-sensitive screen responds slowly or (LAN mode only) Confirm that the Cable Verification erratically to the stylus. test passed. Try a different cable, if necessary. From the Test Results screen, tap to expand the Suggestion : Try navigating around the display to...
- Page 134 EtherScope™ Series II Getting Started Guide Problem Problem : The instrument cannot connect to the network. • Suggestion : A network connection cannot be made if the The battery charge state appears erratic or Cable Verification test (LAN only) does not pass. inconsistent.
-
Page 135: Specifications
Network Assistant Specifications Specifications Weight 0.82 kilograms (2 lbs) Dimensions 19.1 x 15.2 x 4.4 centimeters, (7.5 x 6 x 1.75 inches) LCD touch screen display 640 x 480 pixels, TFT (active) color panel, active area 129.6 (H) mm x 97.4 (V) mm LED indicators (mainframe) Battery Lithium Ion 7.2 V DC (nominal), 4.2 Ah... - Page 136 EtherScope™ Series II Getting Started Guide Specifications (continued) Network analysis ports RJ-45 10/100/1000 BASE-T Ethernet (EtherScope2 LAN/Pro), 1000BASE-SX/LX/ZX Fiber (ES2- LAN-SX, ES2-LAN-SX-I, ES2 Pro-SXLX-I/S), PCMCIA/Cardbus 802.11a/b/g Wireless (EtherScope WLAN/Pro) Vibration Meets requirements of MIL-PRF-28800F for Class 2 random vibration * Class 1 Laser Product. Complies with 21 CFR Subchapter J and EN 60825-1/01 Laser Environmental Operating temperature: 0°...
- Page 137 Network Assistant Specifications Cable Types • Unshielded Twisted Pair LAN cables (100 UTP category 3, 4, 5, 5E, and 6 ISO/IEC Class C and D) • Foil-screened Twisted Pair cables (100 and 120 Ohm ScTP category 3, 4, 5, and 6 ISO/IEC Class C and D) •...
- Page 138 Fault Tolerance The RJ-45 10/100/1000 BASE-T Ethernet connection on the instrument is designed to withstand a maximum of 100 volts. WireView Wiremap Adapter/Office Locator Compatibility Detects combinations of shorts, opens, and connector miswires. Compatible with Fluke Networks WireView wiremap adapter/office locator.
-
Page 139: Index
Index charging, 20 conserving power, 21, 32 —8— icon, 33 installing, 21 802.1Q/IP TOS settings, 76 802.1X Settings, 78 life (wired versus wireless mode), 20 battery icon, 33 blue text, 33 —A— brightness, adjusting, 16 active port, changing, 15 actual link speed and duplex mode, 31 —C—... -
Page 140: Optional Accessories
™ EtherScope Getting Started Guide command-line interface, 119 —E— CompactFlash memory card, 7, 25, 105 ERROR LED, 28, 29 Connection test Errors icon, 64 RJ-45 wired interface, 39 Ethernet settings, 79 WLAN interface, 87 EtherScope Console icon, 117 Country setting, 100 EtherScope Master Menu icon, 30 CPU information, displaying, 118 EtherScope Network Assistant... -
Page 141: Standard Accessories
81 fast connect mode, 82 icons File Manager, 106, 117 Applications menu, 32 FLP (Fast Link Pulse), 46 battery level indicator, 33 Fluke Networks, contacting, 13 calculator, 117 FTP, 118 calendar, 117 clipboard, 33 clock, 117 —G—... - Page 142 ™ EtherScope Getting Started Guide Suspend mode, 32 Link test, 112 System Info, 118 Local Statistics, 49 Web Browser, 118 Local Statistics test, 47 Information icon, 64 Locate test, 111 Instrument Security settings Login Diagnosis, 112 RJ-45 interface, 79 WLAN interface, 101 —M—...
- Page 143 (continued) Index Port Reporter, 119 configuring EtherScope, 74 power supply, 19 connecting to, 37 Problem Detection, 64, 98 Connection test, 39 Problem Log, 64, 98 DC Voltage Scan, 45 problem thresholds, setting, 104 Device Discovery test, 52 problems, 119 Key Devices test, 62 Protocol Statistics, 48 LEDs, 27 Link Partner Signaling, 46...
- Page 144 ™ EtherScope Getting Started Guide security settings —T— RJ-45 wired interface, 79 TCP/IP settings WLAN interface, 99 RJ-45 wired interface, 75 serial DB-9 jack, 25 wireless LAN, 99 Settings menu, 32 Telnet, 118 SFP fiber adapter, installing, 83 Terminal, 118 Signal Levels, 46 terminal emulation (Telnet), 117 Signal Strength, 112...
- Page 145 (continued) Index Utilization History, 49 Nearest Switch test, 59 UTILIZATION LED, 28, 29 Network Discovery test, 56 Utilization test, 90 Problem Log, 63 security settings, 79 Signal Verification tests, 45 —V— Switch Scan test, 60 Traffic Generation, 71 version information, displaying, 118 VLAN Discovery test, 57 Virtual Network Connection (VNC) server, 113 wireless LAN configuration, 98...
- Page 146 Getting Started Guide WLAN Statistics, 112 WLAN Throughput test, 110 WLAN Tests button, 15, 31 Back to the Fluke Etherscope Product Page Visit us at www.TestEquipmentDepot.com Test Equipment Depot - 800.517.8431 - 99 Washington Street Melrose, MA 02176 FAX 781.665.0780 - TestEquipmentDepot.com...