Sign In
Upload
Manuals
Brands
Vaisala Manuals
Radar
IRIS
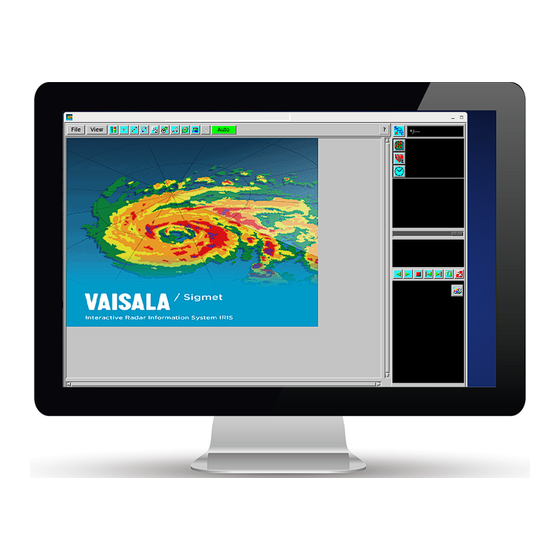
User Manuals: Vaisala IRIS Weather Radar Software
Manuals and User Guides for Vaisala IRIS Weather Radar Software. We have
1
Vaisala IRIS Weather Radar Software manual available for free PDF download: User Manual
Vaisala IRIS User Manual (394 pages)
Brand:
Vaisala
| Category:
Radar
| Size: 13 MB
Table of Contents
Table of Contents
3
About this Document
13
Version Information
13
Related Documents
13
Table Document Versions (English)
13
Table 2 Vaisala Weather Radar Documentation
13
Documentation Conventions
14
IRIS Product Overview
15
Table 3 IRIS Products
15
Table 4 Optional IRIS Products
17
Configuring IRIS Products
18
Configuring Products
18
Product Configuration Menu
19
Associating Products with Tasks
19
Configuring Map Projections
21
Example of 15-Tilt Volume Scan
21
Table 5 Supported Map Projections
22
Product Parameters
25
Table 6 Data Types
26
Table 7 Algorithms for Rain Alg
28
Display Parameters
29
Table 8 Display Units
30
Table 9 Display Parameter Formats
31
Color Legend Format Example
32
Table 10 Default Picture Resolutions
33
BASE: Echo Base Product
34
BEAM: Antenna Beam Pattern Product
36
CAPPI: Constant Altitude Plan Position Indicator
38
FCAST: Forecast
39
HMAX: Height of Maximum Intensity Product
42
LAYER: Layer Average
43
Example of 15-Tilt Volume Scan
44
MAX: Maximum Data with Side Panels
45
Figure 10 Example MAX Display
46
Configuring MAX Products
47
MLHGT: Melting Level Height
49
Figure 12 Melting Level Height Detection
50
MLHGT Algorithm
51
Figure 13 MLHGT Algorithm Flow Diagram
52
Configuring MLHGT Products
54
Figure 14 MLHGT Configuration Example
54
Using MLHGT Data Flow with Other Products
56
Figure 15 MLHGT Data Flow for Use with Other Products
56
PPI: Plan Position Indicator
57
Figure 16 PPI Example Configuration
57
RAIN1: Hourly Rain Accumulation
58
Figure 17 RAIN1 Example Configuration
58
Scheduling RAIN1 Products
59
RAIN-N: N-Hour Rain Accumulation
61
Figure 18 RAIN-N Example Configuration
61
Scheduling RAIN-N Products
62
RAW: Raw Data
64
Figure 19 RAW Example Configuration
64
Configuring RAW Products
65
Recording RAW Data Automatically
65
RHI: Range Height Indicator
66
Figure 20 RHI Example Configuration
66
RHI Cumulonimbus Example
68
Figure 21 RHI Cumulonimbus Example
68
Should I Use RHI or XSECT
69
Table 11 Comparison of RHI and XSECT
69
RTI: Range Time Indicator
70
Figure 22 RTI Example Configuration
70
SRI: Surface Rainfall Intensity
73
SRI Algorithm
73
Figure 23 SRI Reflectivity Profile Example
74
Input Reflectivity Profiles
75
Figure 24 VVP Reflectivity Profile Example
76
Table 12 First Guess Monthly Melting Height Values for the Northern
76
Setting the Current Melting Level Without Restarting IRIS
77
Configuring SRI
79
Figure 25 SRI Configuration Example
79
SRI Profile Correction Example
81
Format of Terrain Map File
83
Figure 26 Example Profile Correction against Range
83
SRI References
84
STAT: IRIS System Status
84
THICK: Echo Thickness Product
86
Figure 27 THICK Example Configuration
86
TOPS: Echo Tops
88
Figure 28 TOPS Example Configuration
88
Figure 29 Example of 15-Tilt Volume Scan
89
TRACK: Track/Forecast
90
Figure 30 TRACK Example Configuration
90
Figure 31 TRACK with Two Centroids
91
VAD: Velocity Azimuth Display
94
Figure 32 VAD Example Configuration
94
VIL: Vertically Integrated Liquid
95
Figure 33 VIL Example Configuration
95
Figure 34 Example of 15-Tilt Volume Scan
97
VVP: Velocity Volume Processing
98
Figure 35 VVP Example Configuration
98
Figure 36 Example of Radial Velocity against Azimuth Display
99
Producing VVP Product Output
101
WARN: Warning/Centroid Product
101
Figure 37 HAIL Warning/Centroid
103
Figure 38 Example of Warning Situation Display
104
Table 13 Warning Criteria Examples
105
Configuring WARN Products
106
WIND: Wind Speed and Direction
110
Figure 39 WIND Example Configuration
110
XSECT: Cross Section
112
Figure 40 XSECT Configuration Example
112
Figure 41 Cross Section Geometry
113
Scheduling Products
115
Product Scheduler Menu
115
Figure 42 Product Scheduler
115
Scheduling Products
116
Adding a Product to Schedule
121
Removing a Product from Schedule
121
Editing Product Configuration
121
Stopping Product Generation
121
Tips for Running Radar Products
122
Table 14 System Performance Considerations for Generating Radar Products
122
Configuring and Scheduling Optional IRIS Products
123
CATCH: Subcatchments Precipitation Accumulation
123
Configuring CATCH Products
124
Figure 43 CATCH Example Configuration
124
Subcatchment Definition
126
Scheduling CATCH Products
126
CATCH Algorithm
127
Displaying CATCH
128
Figure 44 CATCH Product Display
128
COMP: Composite
130
Figure 45 Example of Composite Projection Geometry
130
Composite Algorithm
132
System Manager Preparations for Composites
133
Configuring COMP
134
Figure 46 COMP Configuration Example
134
WARN Algorithm
138
COMP Scheduling
139
Figure 47 Composite Scheduling Example
139
DWELL Algorithm: Composite in Time
141
Figure 48 DWELL Schematic Example
141
DWELL Algorithm Examples
142
Figure 49 PPI of Dbz at a Single Time
143
Figure 50 DWELL of PPI for the Previous 2 Hours Showing Dbz
144
Applying the DWELL Algorithm to Product Scheduling
145
Figure 51 Dwell of PPI for the Previous 2 Hours Showing Time (Age)
145
Figure 52 Background Field for 2-Hour Dwell Showing Dbz
148
Configuring DWELL Products with Target Detection Disabled
150
Figure 53 DWELL Example Configuration with Target Detection Disabled
150
DWELL Target Detection Algorithm
153
Figure 54 Schematic of Target Warning Algorithm
154
Target Detection: Input Task and Product Optimization
155
Table 15 Optimizing Scan Task for DWELL Target Detection
155
Table 16 Suggested Input Product Types for Target Warning
156
Configuring DWELL Products with Target Detection Enabled
157
Figure 55 Target Detection Configuration Example
157
Table 17 Optimizing Input Products for DWELL Target Detection
157
Target Detection: Migratory Bird Examples
159
GAGE: Raingage Reports
167
Displaying GAGE
168
Figure 56 Raingage Product Display
168
NDOP : Multiple Doppler
169
Figure 57 Raingage Datagram
169
Figure 58 Dual Doppler Geometry Plan View
170
Input Velocity Corrections
171
Configuring NDOP Products
173
Figure 59 NDOP Example Configuration
173
NDOP Display and Algorithm
175
Figure 60 Example NDOP Display
176
SHEAR: Wind Shear
178
Figure 61 SHEAR Example Configuration
178
Figure 62 Schematic Examples of Wind Shear
180
SHEAR Algorithm
181
Figure 63 Radial Shear Algorithm Schematic
182
Optimizing SHEAR for Microburst Detection
184
Figure 64 B-Scan Space (PPI Surface)
184
Table 18 Mean Velocity Shear Correction
185
Figure 65 TASK Configuration for Microburst Detection
187
SLINE: Shear Line
190
Figure 66 SLINE Example Configuration
190
Figure 67 Typical Shear Line Example
191
Shear Line Radar Signatures
193
Shear Line Algorithm
194
SWS: Surface Weather Stations
194
Displaying SWS Data
195
Figure 68 Example of Radar Data with an Overlay of SWS Station Plots
195
Figure 69 IRIS Single Station Plot
195
Figure 70 Okta Standard Symbols
196
Figure 71 Present Weather (METAR Text-To-Symbol Matching)
197
Table 19 METAR Visibility Codes
198
Table 20 Cloud Height Codes for SWS
198
SWS Output Options
199
Figure 72 SWS Pressure Trend Symbols
199
SWS Raw Report
200
Figure 73 SWS Tool
200
Configuring SWS Input
201
Figure 74 SWS Raw Report Example
201
Feeding in SWS Data
203
METAR and WMO File Format Examples
203
Quick Look Window
204
Overview of Quick Look Window
204
Figure 75 Example QLW: PPI Reflectivity
204
Setting-Up and Starting Quick Look Windows
205
QLW Control and Monitoring
206
Viewing Products in Quick Look Window
208
Figure 76 Quick Look Window
209
QLW Live Action Tool: Product Generation and Display
210
Figure 77 Example Live Action Tool for CAPPI
210
Changing Window Size and Zoom Level
211
Color Scale Tool
212
Figure 78 Color Scale Tool
213
Highlight Tool
215
Display Options Tool - IRIS Product Output
215
Figure 79 Display Options Menu
216
Display Options Tool - Quick Look Window
221
Product Overlay Tool
222
Figure 80 Product Overlay Tool
223
Animation Tool
224
Figure 81 Quick Look Window Animation Tool
224
Slide Show Tool
229
Figure 82 Slide Show Tool
229
Cursor Tool
231
Figure 83 Cursor Tool
231
Selecting and Planting Home Points
232
Creating Named Home Points (Operators Only)
233
Figure 84 Cursor Set/Plant Tool
233
Track/Annotate Tool
234
Figure 85 QLW Track/Annotate Tool
234
Creating and Editing a Track
236
Adding and Editing Annotation Text
239
Adding and Deleting Tracking and Annotation Icons
240
Tracking Typhoons with the Add Spiral Option
240
Figure 86 Typhoon Track Example
241
Forecast Tool
243
Figure 87 Forecast Example with a Typhoon
244
Cross-Section (XSECT) Tool
245
Figure 88 Cross-Section with Typhoon Example
246
Creating a Cross-Section
247
Figure 89 Cross-Section Range Scale
247
Product Output Options Tool
249
CAPPI Height Selection Tool
250
THICK Output Options
250
Figure 90 THICK Output Tool
250
NDOP Output Options
251
VAD Output Options
251
Figure 91 Example of Velocity Azimuth Display
252
Figure 92 VAD Output Tool
252
VVP Output Options: Time-Height
253
VVP Output Options: Line Graphs
255
WARN Output Options
258
Figure 93 WARN Output Options
258
WIND and FCAST Output Options
259
Printing and Exporting Displays
260
QLW Keyboard Commands
261
Requesting Product Output
262
Overview of Requesting Product Output
262
Product Output Devices and Files
262
Accessing the Product Output Menu
263
Product Output Filters
263
Figure 94 Product Output Filters
263
Product Output: Product List
266
Table 21 Standard Product Generation Parameters
267
Sending a Product to a Device
268
Flagging a Product
270
Performing Archive Operations
271
Overview of Archive and Retrieve Operations
271
Using the Archive Menu
271
Figure 95 Archive Menu
272
Archive Control Area
273
Figure 96 Archive Control Area
273
Archive Log Area
276
Figure 97 Archive Log Area
276
Initializing a Tape or Disk for Recording
278
Mounting a Tape or Disk
279
Recording Data
280
Creating and Printing a Log
281
Creating a Tape Log
281
Printing a Tape or Disk Log
282
Retrieving Product Files from an Archive
282
Stopping an Archive Operation
283
Unmounting a Tape or Disk
284
Managing Ingest Files
285
Figure 98 Ingest Summary Menu
285
Tagging and Untagging Ingest Files
288
Choosing Overlay Files
289
Overlay Overview
289
Invoking Overlay
289
Overlay Header
296
Table 22 Overlay Latitude and Longitude Header Commands
296
Table 23 Overlay Map Unit Header Commands
296
Assigning an Overlay to a Radar Site
297
Figure 99 Site Overlay Example
297
Appendix A: Basic Radar Meteorology
298
Introduction to Radar Meteorology
298
Figure 100 Range bin Geometry
298
Reflectivity
299
Geometry
300
Figure 101 Dbz Values for Various Phenomena
300
Problems in Interpreting Radar Images
301
Figure 102 Beam Height Vs. Range
301
Doppler Wind Measurements
302
Clutter Cancellation
302
Figure 103 Typical Spectrum Plot
303
Appendix B: Radial Velocity Correction
304
Radial Velocity Correction
304
Motion Parameters and Coordinate Transformations
304
Table 24 Basic Variables of Ship Motion Sensing
304
Radial Velocity Correction
305
Figure 104 Vectors Used for Velocity Correction in Earth Coordinates
306
Aircraft Tail Radars
307
Configuring Radial Velocity Correction
308
Table 25 Velocity Correction for Aircraft Tail Radars
308
Testing Radial Velocity Correction
309
In Situ Testing Suggestions
309
Velocity Correction Algorithm: INU Example
310
Appendix C: IRIS 3Dview
312
IRIS 3Dview Overview
312
IRIS 3Dview in System Architecture
313
Figure 105 IRIS 3Dview User Interface
313
IRIS 3Dview System Requirements
314
Figure 106 IRIS 3Dview Data Flow
314
Installing IRIS 3Dview
315
Getting Started with IRIS 3Dview
321
Figure 107 IRIS 3Dview Starting View
321
Opening Data Files in IRIS 3Dview
322
Rendering Modes
322
Surface Rendering
322
Volume Rendering
323
Figure 108 Example of Surface Rendering
323
Figure 109 Example of Volume Rendering
324
Managing the IRIS 3D Display
325
Figure 110 IRIS 3D Display
325
Using the IRIS 3Dview Export Tool
326
Figure 111 Export Tool
327
Figure 112 IRIS 3Dview Background Output Configuration Window
328
Using the Product Information Tool
329
Figure 113 Product Information Tool
329
Using the IRIS 3Dview Cursor Tool
330
Figure 114 Cursor Tool
331
Adjusting IRIS 3Dview Screen Settings
332
Playing Back Data
332
Figure 115 IRIS 3Dview Animation Toolbar
332
Managing IRIS 3Dview Settings
334
Figure 116 IRIS 3Dview Settings Window
334
Appendix D: IRIS TDWR Features
336
Items Provided with IRIS/TDWR Option
336
IRIS/TDWR Terminology
337
IRIS/TDWR Hardware Configuration Example
338
Figure 117 IRIS/TDWR Hardware Configuration Example
338
Data Flow for Ribbon Display Generation
339
Figure 118 Data Flow for Generating TDWR Ribbon Display Products
339
IRIS/TDWR Configuration Summary
340
IRIS Preparation
340
Configuring Protected Areas (Arenas) for TDWR
340
Figure 119 Configuring Protected Areas for TDWR
341
Configuring IRIS Tasks and Products for TDWR
342
Configuring IRIS Product Outputs for TDWR
342
Ribbon Displays
344
Supported Ribbon Displays
345
Dale Ribbon Display Hardware Installation
345
Dale Ribbon Display General Use
346
Figure 120 Dale Ribbon Display Installation
346
Figure 121 Dale Ribbon Display Controls
346
Table 26 Ribbon Display Pin Assignments
346
IRIS Virtual Ribbon Display
348
Figure 122 Vribbon Display
348
Configuring Ribbon Display Software
349
Figure 123 Ribbon Display Setup Menu
352
Ribbon Display Testing with Tdwr_Sim
353
Ribbon Display Alert Messages
355
TDWR/LLWAS Integrator and Runways Utility
355
Figure 124 TDWR Ribbon Display Alert Messages
355
Configuring Integrator and Runways Utility - Runways.conf
356
Figure 125 Iris/Integrator Communication
356
Starting Integrator Utility
361
Runways Utility
362
Appendix E: Hydromet Raingage Correction
365
Hydromet Raingage Correction Overview
365
Hydromet Data Flow for Raingage Correction
365
Table 27 IRIS Features for Hydrometeorological Applications
365
Figure 126 RAIN1 Raingage Correction Data Flow
366
Gage Data File Format
368
Configuring RAIN1 with Raingage Correction
370
Algorithm for RAIN1 Gage Calibration
373
RAIN1 Scheduling with GAGE Product
374
Hydromet Raingage References
376
Appendix F: Task Configuration Examples
377
Task Configurations
377
Surveillance
377
Figure 127 SURVEILLANCE Task Configuration: Dual-Polarization
378
Vol_A
379
Vol_B
380
Figure 128 VOL_A Task Configuration - Dual Polarization
380
Wind
381
Figure 129 VOL_B Task Configuration - Dual Polarization
381
SUNCAL and ZDRCAL Tasks
382
Figure 130 WIND Task Configuration
382
Product Configurations and Scheduler
383
RAW Products
383
Figure 131 SUNCAL and ZDRCAL Task Configurations
383
Melting Height Products
384
Figure 132 Melting Height Product Configuration
384
Product Scheduler
385
Figure 133 Default Product Scheduler
385
Index
387
Warranty
391
Technical Support
391
Recycling
391
Advertisement
Advertisement
Related Products
Vaisala Indigo500 Series
Vaisala Indigo510
Vaisala Indigo520
Vaisala Indigo300
Vaisala Indigo80
Vaisala Indigo200
Vaisala Indigo201
Vaisala Categories
Transmitter
Measuring Instruments
Accessories
Weather Station
Test Equipment
More Vaisala Manuals
Login
Sign In
OR
Sign in with Facebook
Sign in with Google
Upload manual
Upload from disk
Upload from URL