Sign In
Upload
Manuals
Brands
Edwards Manuals
Measuring Instruments
HemoSphere Alta Advanced
Edwards HemoSphere Alta Advanced Manuals
Manuals and User Guides for Edwards HemoSphere Alta Advanced. We have
1
Edwards HemoSphere Alta Advanced manual available for free PDF download: Operator's Manual
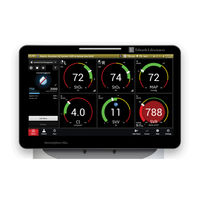
Edwards HemoSphere Alta Advanced Operator's Manual (448 pages)
Monitoring Platform
Brand:
Edwards
| Category:
Measuring Instruments
| Size: 22 MB
Table of Contents
Table of Contents
11
Using this Manual
23
Contraindications for Use
28
Intended Use Statement
28
Table 1-1: Hemosphere Alta Swan-Ganz Patient Cable Available Parameters List
29
Table 1-2: Hemosphere Oximetry Cable Available Parameters List
30
Table 1-3: Hemosphere Alta Swan-Ganz Patient Cable with Oximetry Cable Available Parameters List
30
Table 1-4: Hemosphere Alta Swan-Ganz Patient Cable with Hemosphere Pressure Cable or Hemosphere Alta Monitor - Pressure Cable Available Parameters List
30
Table 1-5: Hemosphere Alta Swan-Ganz Patient Cable with Two Hemosphere Pressure Cables or Hemosphere Alta Monitor - Pressure Cables Available Parameters List
31
Table 1-6: Hemosphere Pressure Cable / Hemosphere Alta Monitor - Pressure Cable Available Parameters List
32
Table 1-7: Hemosphere Pressure Cable / Hemosphere Alta Monitor - Pressure Cable Available AFM Output List
33
Table 1-8: Hemosphere Pressure Cable or Hemosphere Alta Monitor - Pressure Cable with Oximetry Cable Available Parameters List
33
Table 1-9: Foresight Oximeter Cable Available Parameters List
33
Table 1-10: Hemosphere Pressure Cable or Hemosphere Alta Monitor - Pressure Cable with Foresight Oximeter Cable Available Parameters List
34
Table 1-11: Hemosphere Clearsight Technology Available Parameters List
34
Table 1-12: Hemosphere Clearsight Technology with Oximetry Cable Available Parameters List
35
Figure 1-1: Hemosphere Alta Advanced Monitoring Platform Hemodynamic Technology Connections
36
Table 1-13: Technology Connections Available on Hemosphere Alta Monitoring Platform Configurations
36
Table 1-14: Hemosphere Alta Swan-Ganz Patient Cable Parameters Description
37
Table 1-15: Hemosphere Pressure Cable Key Parameters Description
38
Table 1-16: Hemosphere Oximetry Cable Parameters Description
40
Table 1-17: Foresight Oximeter Cable Parameters Description
41
Table 1-18: Hemosphere Clearsight Technology Key Parameters Description
42
Documentation and Training
43
Table 1-19: Operator's Manual Style Conventions
43
Table 1-20: Acronyms, Abbreviations
43
Safety and Symbols
48
User Interface Symbols
62
Table 2-1: Monitor Display Symbols
62
Table 2-2: Symbols on Product Labels
69
Table 2-3: Applicable Standards
73
Installation and Setup
74
Packaging Contents
74
Table 3-1: Hemosphere Alta Advanced Monitoring Platform Configurations
75
Table 3-2: Cables and Catheters Required for Monitoring Parameters with Hemosphere Alta Swan-Ganz Patient Cable
75
Table 3-3: Sensor Options for Monitoring Parameters with Hemosphere Pressure Cable/Hemosphere Alta Monitor - Pressure Cable
76
Table 3-4: Finger Cuff Options for Monitoring Parameters with Non-Invasive Clearsight Technology
76
Table 3-5: Catheters Required for Monitoring Parameters with Hemosphere Oximetry Cable
77
Table 3-6: Accessories Required for Monitoring Parameters with Foresight Oximeter Cable
77
Monitor Front
78
Figure 3-1: Hemosphere Alta Advanced Monitor Front View
78
Monitor Rear
79
Figure 3-2: Hemosphere Alta Advanced Monitor Rear View
79
Figure 3-3: Hemosphere Alta Advanced Monitor Bottom Panel
80
Figure 3-4: Hemosphere Alta Advanced Monitor Left Panel
81
Connecting Power Cord
83
Figure 3-5: Hemosphere Alta Advanced Monitor Power Entry Cover - Installation Steps
84
Equipotential Connection
84
Initial Start-Up
85
Start-Up Procedure
85
Figure 3-6: Startup Screen
85
Figure 3-7: Device ID Screen
86
Figure 4-1: Hemosphere Alta Advanced Monitor Screen Features
88
Navigation Bar
88
Figure 4-2: Navigation Bar and Icons
89
Monitor Views
91
Graphical Trend Screen
91
Figure 4-3: Graphical Trend Screen
92
Tabular Trend Screen
92
Figure 4-4: Tabular Trend Screen
93
Change Parameters
95
Figure 4-5: Example of Key Parameter Selection Tile Configuration Menu
96
Change Alarm/Target
96
Status Indicators
97
Figure 4-6: Parameter Tile
97
Table 4-1: CVP Value Prioritization
99
Split Screen
99
Physiology Screen
99
Figure 4-7: Split Screen with Large Scale Physiology Selection
100
Figure 4-8: Split Screen with Magnified Physiology Selection
100
Figure 4-9: Goal Positioning Screen
102
Cockpit Screen
103
Figure 4-10: Cockpit Monitoring Screen
103
Table 4-2: Hemosphere Alta Advanced Monitoring Platform Hand Gesture Commands
104
Figure 4-11: Voice Listening State (English Only)
105
Table 4-3: Hemosphere Alta Advanced Monitoring Platform Voice Commands (English Only)
106
Derived Value Calculator
109
Event Scrolling
110
Table 4-4: Reviewed Events
110
Figure 4-12: Clinical Tools - Intervention Menu
119
Table 4-5: Intervention Types
121
Status Bar
122
Figure 4-13: Status Bar - Icons
123
Figure 4-14: Status Bar Quick Settings Menu
124
Table 4-6: Battery Status
124
Figure 4-15: Status Bar
125
Monitor Screen Navigation
125
User Interface Settings
129
Figure 5-1: Primary Settings Screen
130
Table 5-1: Hemosphere Alta Advanced Monitoring Platform Password Levels
130
Table 5-2: Advanced Settings Menu Navigation and Password Protection
130
Table 5-3: Export Data Menu Navigation and Password Protection
131
Changing Passwords
131
Patient Data
132
Figure 5-2: New or Continuing Patient Screen
132
New Patient
132
Figure 5-3: New Patient Data Screen
134
General Monitor Settings
135
Demo Mode
135
Table 5-4: Co/Pressure Averaging Time and Display Update Rates
137
Advanced Settings
139
Table 6-1: Visual Alarm Indicator Colors
139
Set Alarm Volume
141
Set Targets
141
Table 6-2: Target Status Indicator Colors
141
Table 6-3: Patient Versus Custom Alarm/Targets Settings Screen
142
Table 6-4: Target Defaults
142
Figure 6-1: Custom Alarm/Target Settings Screen
143
Figure 6-2: Set Individual Parameter Alarms and Targets
145
Export Data
147
Monitoring Data
148
Wireless Settings
149
Table 7-1: Wi-Fi Connection Status
150
Table 7-2: Hemosphere Remote Application Connectivity Status
152
Figure 8-1: Hemosphere Alta Swan-Ganz Patient Cable Connection Overview
155
Table 8-1: Available Hemosphere Alta Swan-Ganz Patient Cable Parameters and Required Connections
156
Connecting the Patient Cables
157
Figure 8-2: CO Connection Overview
157
Initiating Monitoring
158
Table 8-2: Unstable Thermal Signal Time Lapse for CO Alert and Fault Messages
158
Figure 8-3: Ico Connection Overview
161
Probe Selection
161
Configuration Settings
161
Figure 8-4: Ico Side Panel - New Set Configuration Menu
162
Figure 8-5: Thermodilution Summary Screen
166
Figure 8-6: EDV/RVEF Connection Overview
167
Figure 9-1: Hemosphere Pressure Cable
173
Table 9-1: Hemosphere Pressure Cable Configurations and Available Key Parameters
173
Figure 9-2: Illustration of PAOP Measurement
182
Figure 9-3: Example of Smart Wedge PAOP Measurement with Spontaneous Breathing (A) and Mechanical Ventilated (B) Inputs
183
Figure 9-4: Edit Wedge
186
Table 9-2: Wedge Index
187
Table 9-3: Performance Results of PAOP Identification
187
Table 9-4: Performance Results of PAOP Measurements
188
Table 9-5: Performance Results of PAOP Identification for Patients with Valvular Disorders, HCP Confirmed Arrhythmia, Catheter Flinging, and Heart Failure
188
Table 9-6: Performance Results of PAOP Measurements for Patients with Valvular Disorders, HCP Confirmed Arrhythmia, Catheter Flinging, and Heart Failure
189
Figure 9-5: Zero Screen - Zero Pressure Cable Channels
190
Figure 10-1: Hemosphere Non-Invasive System Connection Overview
195
Figure 10-2: Pressure Controller Application
197
Figure 10-3: Cuff Size Selection
198
Figure 10-4: Heart Reference Sensor Application
199
Table 10-1: 95% Confidence Interval (CI) Results for Repeated Blood Pressure Measurements from the same Patient (Bootstrap Re-Sampling)
200
Figure 10-5: Vertical Offset Entry Screen
202
Table 10-2: Arterial Waveform SQI Levels
204
Table 10-3: Physiocal Method Interval Status
204
Figure 10-6: BP Calibration Side Panel
207
Table 10-4: BP Calibration Performance Data
207
Figure 10-7: Pressure out to External Monitor
209
Table 10-5: Patient Monitor Connection Symbols
209
Figure 11-1: Venous Oximetry Connection Overview
212
Table 11-1: in Vitro Calibration Options
213
Table 11-2: in Vivo Calibration Options
215
Table 11-3: Signal Quality Indicator Levels
215
Figure 12-1: Foresight Oximeter Cable Front View
220
Figure 12-2: Foresight Oximeter Cable Rear View
220
Figure 12-3: Mounting Clip Attachment Points
221
Figure 12-4: Cable Housing - Mounting Clip Attachment Points
222
Figure 12-5: Attaching the Mounting Clip Vertically
223
Figure 12-6: Attaching the Mounting Clip Horizontally
224
Figure 12-7: Removing the Mounting Clip
225
Figure 12-8: Tissue Oximetry Monitoring Connection Overview
226
Figure 12-9: Foresight Oximeter Cable Status LED
228
Table 12-1: Tissue Oximetry Sensor Locations
228
Table 12-2: Sensor Selection Matrix
231
Figure 12-10: Removing Protective Liner from Sensor
232
Figure 12-11: Sensor Placement (Cerebral)
233
Figure 12-12: Sensor Placement (Non-Cerebral)
234
Figure 12-13: Connecting a Sensor to the Sensor Cable Connector
236
Figure 12-14: Connecting a Sensor to the Foresight Oximeter Cable - Channel Status LED
236
Table 12-3: Sto₂ Validation Methodology
238
Set Averaging Time
239
Figure 12-15: Tissue Oximetry Physiology Screens
240
Indications for Use
242
Intended Use
242
Figure 12-16: Block Diagram of the Edwards Algorithm for Measurement of Blood Hemoglobin (Thb Algorithm)
243
Figure 12-17: Thb Parameter Display
244
Figure 12-18: Thb Parameter Display at the Start of Monitoring
244
Table 12-4: Thb Parameter Display
244
Figure 12-19: Thb Parameter Recalibration Warning
245
Table 12-5: Patient Demographics Used for Verification Testing
246
Figure 12-20: Bland-Altman Plots for Thb Vs Blood Gas Analyzer for Thb
248
Table 12-6: RMSE and Bland-Altman Analysis Results Comparing Thb with Reference Blood Gas Analyzer Measurements
248
Table 12-7: Statistical Analysis to Assess Frequency of the Recalibrate Flag
248
Table 12-8: Thb Calibration and Recalibration Troubleshooting Messages
249
Advanced Features
250
Table 13-1: HPI Display Configurations
253
Table 13-2: HPI Value Graphical and Audible Display Elements
254
Figure 13-1: HPI Key Parameter Tile
256
Table 13-3: HPI Versus Other Key Parameters: Similarities and Differences
256
Figure 13-2: HPI Key Parameter on Cockpit Screen
257
Table 13-4: Parameter Status Colors for HPI
257
Figure 13-3: Information Bar with HPI
258
Figure 13-4: HPI High Alert Notification
259
Figure 13-5: HPI Parameter Hypotension Threshold Settings Screen
260
Figure 13-6: HPI Algorithm Side Panel - Relationship View
262
Figure 13-7: HPI Smart Alert Notification
263
Table 13-5: HPI Smart Alert Parameter Default Thresholds
263
Figure 13-8: HPI Algorithm Settings Menu
264
Clinical Application
264
Additional Parameters
265
Table 13-7: 95% Confidence Interval (CI) Results for Bias and Limits of Agreement (Loa)
267
Figure 13-9: Bland-Altman Plots for SVV, PPV, and Eadyn
268
Table 13-8: Patient Demographics (Minimally-Invasive Monitored Surgical Patients, N=1141)
269
Table 13-9: Analysis Dataset Length and Number of Hypotension Events (Minimally-Invasive Monitored Surgical Patients)
269
Table 13-10: Surgical Patient Characteristics (Minimally-Invasive, N=1141)
269
Table 13-11: Patient Demographics (Minimally-Invasive Monitored Non-Surgical Patients, N=672)
270
Table 13-12: Analysis Dataset Length and Number of Hypotension Events (Minimally-Invasive Monitored Non-Surgical Patients)
270
Table 13-13: Non-Surgical Patient Characteristics (Minimally-Invasive, N=672)
270
Table 13-14: Clinical Validation Study Results* (Minimally-Invasive Monitored Surgical Patients)
271
Table 13-15: Clinical Validation Study Results* (Minimally-Invasive Monitored Non-Surgical Patients)
272
Table 13-16: Event Rate Analysis (Surgical Minimally-Invasive, N=1141)
273
Table 13-17: Event Rate Analysis (Non-Surgical Minimally-Invasive, N=672)
274
Table 13-18: Patient Demographics (Non-Invasive Monitored Surgical Patients, N=927)
276
Table 13-19: Analysis Dataset Length and Number of Hypotension Events (Non-Invasive Monitored Surgical Patients)
276
Table 13-20: Surgical Patient Characteristics (Non-Invasive, N=927)
277
Table 13-21: Patient Demographics (Non-Invasive Monitored Non-Surgical Patients, N=424)
278
Table 13-22: Analysis Dataset Length and Number of Hypotension Events (Non-Invasive Monitored Non- Surgical Patients)
278
Table 13-23: Non-Surgical Patient Characteristics (Non-Invasive, N=424)
278
Table 13-24: Clinical Validation Study Results* (Non-Invasive Monitored Surgical Patients)
279
Table 13-25: Clinical Validation Study Results* (Non-Invasive Monitored Non-Surgical Patients)
280
Table 13-26: Event Rate Analysis (Surgical Non-Invasive, N=927)
281
Table 13-27: Event Rate Analysis (Non-Surgical Non-Invasive, N=424)
283
Study Design
284
Table 13-28: HPI Prospective Subject Selection Criteria
285
Table 13-29: MPOG Historical Control Patient Selection Criteria
286
Table 13-30: Patient Demographics (MPOG Study)
286
Table 13-31: Procedure Type (HPI)
287
Table 13-32: Surgery Type by CPT Grouping
288
Study Results
288
Table 13-33: Receiver Operating Characteristics (ROC) for HPI Subjects (N=482)
289
Table 13-34: Mean IOH Duration - Primary Effectiveness Endpoint
289
Table 13-35: Intraoperative Hypotension AUC - ITT, Pivotal Subjects
289
Table 13-36: Effectiveness Stratified by MAP Level, HPI Study Versus MPOG Historical Control
290
Table 13-37: Frequency Pattern of Subjects and Intervention Instances by HPI Threshold
291
Table 13-38: HPI Study - 30 Days Postoperative Composite Endpoint Components - CC Analysis Population (Pivotal Subjects, N=400)
292
Table 13-39: Length of Stay
292
Study Summary
292
Table 13-40: GHI Display Configurations
295
Table 13-41: GHI Value Graphical and Audible Display Elements
295
Figure 13-10: GHI Key Parameter Tile
296
Figure 13-11: GHI Key Parameter on Cockpit Screen
296
Table 13-42: Parameter Status Colors for GHI
297
Table 13-43: Patient Numbers in GHI Algorithm Clinical Validation Datasets
298
Table 13-44: Patient Demographics and ICU Diagnosis (ICU Patients, N=108)
298
Table 13-45: Patient Demographics and Surgery Types (Surgical Patients, N=189)
299
Table 13-46: Clinical Validation Study Results - All Patients
300
Indications for Use
300
Figure 13-12: CAI Key Parameter Trend Display and Parameter Tile
301
Table 13-47: General Interpretations and Recommended Actions for CAI Values
301
Table 13-48: Patient Demographics
302
Table 13-49: ROC Analysis Results for Clinical Data (N=50)
303
Table 13-50: Confusion Matrix for CAI at the Chosen Threshold of 45
303
Table 13-51: Percentage of Time When CAI < 45 and CAI ≥ 45 for Clinical Data
303
Table 13-52: ROC Analysis Results for UC Davis Clinical Data (N=9)
303
Table 13-53: ROC Analysis Results for Northwestern University Clinical Data (N=18)
304
Table 13-54: ROC Analysis Results for Amsterdam UMC Clinical Data (N=23)
304
Table 13-55: AFM Algorithm States
305
Principle of Operation
305
Figure 13-13: AFM Algorithm Dashboard - Session Initialization
309
Table 13-56: AFM Algorithm Fluid Status Icons
311
Figure 13-14: Acumen IQ Fluid Meter and Hemosphere Alta AFM Cable Connection Overview
313
Table 13-57: Subject Demographics
327
Table 13-58: AFM Algorithm Response Rates by Bolus Type
327
Table 13-59: AFM Performance by Bolus Volume (Ml)
328
Table 13-60: Accuracy Results of the AFM Feature (Bolus Level)
328
Table 13-61: Frequency of AFM Algorithm Recommendations Per Hour
329
Table 13-62: Complete Accounting of Fluid Boluses
329
Table 13-63: Reasons Boluses Were Discarded (Analysis Declined) in the Per Protocol Pivotal Subjects
330
Table 13-64: Reasons Suggestions Were Declined in the Per Protocol Pivotal Subjects
330
Figure 13-15: Swan-Ganz IQ Catheter Connection Overview
334
Figure 13-16: RVCO Calibrated Key Parameter Tile
335
Table 13-65: Patient Numbers in RVCO Algorithm Clinical Validation Datasets
335
Table 13-66: Patient Characteristics (Validation Dataset, N=370)
335
Table 13-67: Clinical Validation Study Results - (Non-Calibrated State)
336
Table 13-68: Clinical Validation Study Results - (Calibrated with Ico)
336
Figure 13-17: Transpulmonary Thermodilution Algorithm (TPTD) Patient Cable Connection Overview
338
Table 13-69: Recommended Injectate Volumes
339
Figure 13-18: TPTD Procedure
340
Figure 13-19: Review TPTD Set and View Results
341
Table 13-70: Transpulmonary Thermodilution Intermittent Parameters
342
Figure 13-20: GDT Menu Screen - Parameter Selection
343
Figure 13-21: GDT Menu Screen - Target Selection
343
Figure 13-22: GDT - Start Active Tracking
344
Figure 13-23: GDT - Active Tracking
344
Table 13-71: GDT Target Status Indicator Colors
345
Figure 13-24: Fluid Responsiveness Test Side Panel - Main Menu Screen
347
Figure 13-25: Fluid Responsiveness Test - Results Screen
350
Troubleshooting
353
On Screen Help
353
Figure 14-1: Hemosphere Alta Advanced Monitoring Platform LED Indicators
354
Table 14-1: Hemosphere Alta Advanced Monitoring Platform Visual Alarm Indicator
354
Figure 14-2: Pressure Cable LED Indicator (HEMPSC100 Only)
355
Table 14-2: Hemosphere Alta Advanced Monitoring Platform Power Light
355
Figure 14-3: Foresight Oximeter Cable LED Indicators
356
Table 14-3: Pressure Cable Communication Light (HEMPSC100 Only)
356
Table 14-4: Foresight Oximeter Cable LED Communication Lights
356
Figure 14-4: Pressure Controller LED Indicators
357
Table 14-5: Pressure Controller Communication Lights
357
Table 14-6: Monitoring Faults/Alerts
358
Table 14-7: Numeric Keypad Errors
361
Table 14-8: Hemosphere Remote Application Connectivity Errors
361
Table 14-9: Hemosphere Alta Swan-Ganz Patient Cable CO Faults/Alerts
362
Table 14-10: Hemosphere Alta Swan-Ganz Patient Cable EDV and SV Faults/Alerts
365
Table 14-11: Hemosphere Alta Swan-Ganz Patient Cable Ico Faults/Alerts
365
Table 14-12: Hemosphere Alta Swan-Ganz Patient Cable 20S Parameters Faults/Alerts
367
Table 14-13: Hemosphere Alta Swan-Ganz Patient Cable General Troubleshooting
368
Table 14-14: Smart Wedge Faults/Alerts
370
Table 14-15: RVCO Faults/Alerts
371
Table 14-16: RVCO Warnings
372
Table 14-17: Pressure Cable General Faults/Alerts
372
Table 14-18: Hemosphere Pressure Cable ART and RVP Faults/Alerts
374
Table 14-19: Hemosphere Pressure Cable TPTD Faults/Alerts
376
Table 14-20: Hemosphere Pressure Cable TPTD Warnings
377
Table 14-21: Hemosphere Pressure Cable AFM Faults/Alerts
377
Table 14-22: Hemosphere Pressure Cable AFM Warnings
379
Table 14-23: Hemosphere Pressure Cable CAI Faults/Alerts
379
Table 14-24: Hemosphere Pressure Cable CAI Warnings
380
Table 14-25: Hemosphere Pressure Cable General Troubleshooting
380
Table 14-26: Clearsight Monitoring Faults/Alerts
381
Table 14-27: Clearsight Monitoring Warnings
385
Table 14-28: Clearsight Monitoring General Troubleshooting
387
Table 14-29: Venous Oximetry Faults/Alerts
387
Table 14-30: Venous Oximetry General Troubleshooting
390
Table 14-31: Tissue Oximetry Faults/Alerts
390
Table 14-32: Tissue Oximetry General Troubleshooting
393
Table 14-33: Total Hemoglobin Faults/Alerts
393
Essential Performance Characteristics
395
Table A-1: Hemosphere Alta Advanced Monitoring Platform Essential Performance - Transient and Non- Transient Electromagnetic Phenomena
395
Table A-2: Hemosphere Alta Advanced Monitor Physical and Mechanical Characteristics
397
Table A-3: Hemosphere Alta Advanced Monitoring Platform Environmental Specifications
397
Table A-4: Hemosphere Alta Advanced Monitoring Platform Transportation Environmental Specifications
398
Table A-5: Hemosphere Alta Advanced Monitoring Platform Technical Characteristics
398
Table A-6: Hemosphere Alta Monitor Battery Technical Characteristics
399
Table A-7: Hemosphere Alta Swan-Ganz Patient Cable Physical Characteristics
400
Table A-8: Hemosphere Alta Swan-Ganz Patient Cable Parameter Measurement Specifications
400
Table A-9: Hemosphere Alta Swan-Ganz Patient Cable 20-Second Flow Parameter Measurement Specifications
401
Table A-10: Hemosphere Alta Swan-Ganz Patient Cable RVCO Algorithm Parameter Measurement Specifications
401
Table A-11: Transpulmonary Thermodilution Algorithm Parameter Measurement Specifications
401
Table A-12: Hemosphere and Hemosphere Alta Pressure Cable Physical Characteristics
401
Table A-13: Hemosphere and Hemosphere Alta Pressure Cable Parameter Measurement Specifications
402
Table A-14: Hemosphere Oximetry Cable Physical Characteristics
403
Table A-15: Hemosphere Oximetry Cable Parameter Measurement Specifications
403
Table A-16: Foresight Oximeter Cable Physical Characteristics
403
Table A-17: Foresight Oximeter Cable Parameter Measurement Characteristics
404
Table A-18: Hemosphere Alta Clearsight Technology Parameter Measurement Specifications
405
Figure A-1: Spectral Irradiance and Location of Light Emission Aperture
406
Table A-19: Edwards Finger Cuff Characteristics
406
Table A-20: Hemosphere Alta AFM Cable Physical Characteristics
406
Table A-21: Hemosphere Alta AFM Cable Operational Environmental Specifications
406
Table A-22: Hemosphere Alta AFM Cable Transportation Environmental Specifications
407
Table A-23: Hemosphere Alta AFM Cable Parameter Measurement Specifications
407
Accessories List
408
Table B-1: Hemosphere Alta Advanced Monitoring Platform Components
408
Roll Stand
409
Figure B-1: Applying Pressure Controller Cover
410
Table C-1: Cardiac and Oxygenation Profile Equations
411
Patient Data Input Range
418
Table D-1: Patient Information
418
Trend Scale Default Limits
418
Table D-2: Graphical Trend Parameter Scale Defaults
418
Parameter Display and Configurable Alarm/Target Ranges
420
Alarm and Target Defaults
421
Table D-4: Parameter Alarm Red Zone and Target Defaults
421
Alarm Priorities
422
Table D-5: Parameter Alarms, Faults, and Alerts Priorities
422
Table E-1: Computation Constants for Bath Temperature Probe
424
F.1 General Maintenance
425
F.2 Cleaning the Monitor and Cables
426
F.3 Cleaning the Platform Cables
426
Figure F-1: Removing Pressure Controller from Band
430
F.4 Service and Support
430
F.5 Edwards Lifesciences Regional Headquarters
430
F.6 Monitor Disposal
431
Battery Recycling
431
F.7 Preventive Maintenance
431
Battery Maintenance
432
Battery Storage
432
F.8 Testing of Alarm Signals
433
F.9 Warranty
433
Electromagnetic Compatibility
434
Table G-1: Electromagnetic Emissions
435
Table G-2: Guidance and Manufacturer's Declaration - Immunity to RF Wireless Communications Equipment
435
Table G-3: Recommended Separation Distances between Portable and Mobile RF Communications Equipment and the Hemosphere Alta Advanced Monitoring Platform
437
Table G-4: Wireless Coexistence Radiated Anechoic Chamber (RAC) Results - Normal Mode (2.4, 5 and 6 Ghz
437
Table G-5: Wireless Coexistence Radiated Anechoic Chamber (RAC) Results - Normal Mode (2.4, 5 and 6 Ghz Wifi) for Companion Device (Router) with Unintended Signal Present
438
Table G-6: Electromagnetic Immunity (ESD, EFT, Surge, Dips and Magnetic Field)
438
Table G-7: Electromagnetic Immunity (RF Radiated and Conducted)
439
Wireless Technology Information
440
Table G-8: Hemosphere Alta Monitor Wireless Information
440
Wireless Security Measures
445
Industry Canada Statements
446
Advertisement
Advertisement
Related Products
Edwards HemoSphere HEMPSC100
Edwards HemoSphere
Edwards HemoSphere Vita
Edwards HemoSphere ClearSight HEMCSM10
Edwards LaserSense HSSD-2
Edwards HP20T
Edwards HAT1000
Edwards HV8000 VF
Edwards HV8000 HF
Edwards HT10
Edwards Categories
Water Pump
Control Unit
Industrial Equipment
Measuring Instruments
Controller
More Edwards Manuals
Login
Sign In
OR
Sign in with Facebook
Sign in with Google
Upload manual
Upload from disk
Upload from URL