Table of Contents
Advertisement
Advertisement
Table of Contents

Related Manuals for Microgate OPTOJUMP Next

Summary of Contents for Microgate OPTOJUMP Next
- Page 1 User Manual Manual Version 1.10 Software Version 1.10...
-
Page 2: Table Of Contents
Software Installation ............................. 20 Description .......................... 24 Athletes ..........................25 Test ............................25 Results and Video Analysis ....................25 OptoJump Next Driver and Hardware Installation ................26 Driver Installation ........................ 26 OptoJump Next Hardware Installation................26 Power Supply ........................30 3.3.1 OptoJump Next Battery life .................. - Page 3 4.1.1.2 Importing and Exporting Athletes' Personal Data Excel ........38 4.1.1.3 RFID Tag management ..................39 4.1.2 Insert / Edit Group ....................... 41 4.1.3 MediaGallery ........................ 43 4.1.3.1 Acquisition from Webcam ..................46 Test ............................47 4.2.1 Execute ......................... 47 4.2.1.1 Execute Configuration ..................
- Page 4 4.3.1.10 Analysis Notes ....................... 98 4.3.1.11 Signature ....................... 98 4.3.1.12 Parameters ......................98 4.3.1.13 Using Markers ....................... 99 4.3.2 Compare ........................100 4.3.2.1 Print, Analysis, Notes, Signature ................. 101 4.3.3 History ........................102 4.3.4 Export ......................... 104 Utility ..........................105 4.4.1 Basic Settings ......................
- Page 5 4.4.6.3 Save as ........................ 126 4.4.7 Check Update ......................126 4.4.8 Reset to Default values ....................126 4.4.9 About .......................... 126 BioFeedback ........................128 Operating Principles ........................... 133 Definition of Result Columns ..................... 133 5.1.1 General information ....................133 5.1.2 Jump and Reaction Test .....................
- Page 6 6.1.1 2D Drift Protocol ......................185 Five Dot Drill Protocol ....................... 186 'GG' Protocol........................190 Single Leg 3 Hops Protocol ....................193 MIP (March in Place) Protocol ................... 195 VERTEC LIKE Test ....................... 197 Ski Test ..........................198 Body Sway Protocol ......................199 Technical Data ..............................
-
Page 7: Introduction
(even at a distance of months or years). Quick Start: Online Video Tutorial For a brief introduction to the software for OptoJump Next, we strongly recommend you watch the introductory webcast available on the official site: http://www.optojump.com/support/software-tutorial.aspx... -
Page 8: Single Meter
1.1 S INGLE ETER In this configuration OptoJump Next allows already to carry out various test types: 1.1.1 J A series of exercises (squat jump, counter movement jump, drop jump, continuous jumps, jumps on one leg, etc.) and protocols ('Drift' for dynamic stability, '5 Dot Drill' for reactivity and endurance, 'Single Leg Three Hops' to verify the bending capacity and stability of the knee) are pre-configured. -
Page 9: Single Meter On Treadmill
NALYSIS NALYSIS Positioned on the side bars of a treadmill, OptoJump Next becomes a real portable lab for small spaces and with reduced costs. The system is compatible with the wide majority of treadmills and no synchronization is necessary to start and carry out a test. -
Page 10: The Modular System
1.3 T ODULAR YSTEM In this configuration, OptoJump Next allows to carry out: 1.3.1 G Gait tests can consist of simple exercises (moving from A to B), but also of more complex ones, such as 'roundtrip' or walking backwards. They can be more complex, if needed, adding obstacles (e.g. -
Page 11: The Two-Dimensional System
4-meter-long linear gait system. For serial numbers lower than 00500 it is possible to ship the bar to Microgate or a distributor and receive a free update (shipping costs for sending and receiving are excluded). It is also possible to buy one or more additional single TX bars. - Page 12 If using a Y-bar with drum, make sure that the power supply is SWITCHED OFF (power off). Power RX bars Power TX bars The bars situated on the perpendicular sides are connected using a variable-length cable (eg. $CAB155, 1.5m long); this allows to distance the actual measurement area (the rectangle formed by the regular bars and highlighted in gray in the following picture) of the Y bars;...
-
Page 13: The Gyko Inertial System
1.5 T NERTIAL SYSTEM Gyko is a new tool, developed by Microgate, which enables obtaining information on the kinematics of any body segment while making a movement. Gyko contains the latest generation components that are used for making accurate and repeatable measurements of acceleration, angular velocity and magnetic field in three dimensions. -
Page 14: Gyko To Analyze Walking, Running And Marching In Place
1.5.1 G YKO TO ANALYZE WALKING RUNNING AND MARCHING IN PLACE Gait analysis is one of the most widely used methods to determine any disorders of the nervous and/or musculoskeletal system. With OptoGait you can estimate the space-time parameters of the gait and isolate individual phases of the step, then accurately describe the behaviour of the lower body. -
Page 15: Dynamic Stability
1.5.1.1 D YNAMIC TABILITY In addition to graphics for Step, Stride, flight/contact times, etc. with Gyko there is another one called Dynamic Stability that can be activated from the legend on the left. The graphic is an ellipse whose size represents: ... -
Page 16: Gyko For Jump Analysis
1.5.2 G YKO FOR JUMP ANALYSIS Using field tests and in particular vertical jump analysis has always been a widely used method for evaluating lower limb muscle strength. OptoGait is the instrument used to measure and objectify the main features of a jump such as flight and contact time. Gyko placed near the centre of mass with a special belt enables enriching the temporal data with a variety of information regarding the dynamics of the jump. -
Page 17: Gyko For Posture Analysis
1.5.3 G YKO FOR POSTURE ANALYSIS Postural analysis is frequently used to evaluate the stability and balance of a quiet standing subject. Gyko, placed on the trunk or at the level of the centre of mass, provides important information about the body sway of the subject and through appropriate protocols it enables evaluating the relative contribution made by the various components of the postural system (visual, proprioceptive of different origin, labyrinthine, etc.). -
Page 18: Environmental Conditions And Disclaimers
1.6 E NVIRONMENTAL ONDITIONS AND ISCLAIMERS The system is intended only for indoor use and at a height of max. 2000 m a.s.l. Operating temperature 0°C ~ +35°C As of the manufacturer's specifications only the intended use is allowed The estimated product life cycle is of 20 years. Positioning of the bars on the ground To avoid interferences between the patient and the bars, we advise a distance of at least one meter between the bars and we advise to pay attention that bars don’t hinder the gait. - Page 19 Positioning of the bars on the treadmill The bars must be positioned at the sides of the treadmill so that the minimal security distance planned by the producer is obeyed.We advice to fix "L" stirrups outside the chassis. When mounting the bars on the treadmill ensure that vibrations caused by walking/running do not move or make the bars fall down or onto the mobile area.
-
Page 20: Software Installation
In the first installation window the user is asked where to save the files for the installation of OptoJump Next. We advise you to leave the directory unchanged and to click on <Next> to continue. Figure 2 – Installation wizard In the first installation program window click on <Next>. - Page 21 Figure 4 – Installation – data insertion. The next window offers to launch software installation. If all the data is correct, click on <Next>. Figure 5 – Installation – confirm installation The setup program will install the product on the PC, showing state of progress. Version 1.10 Page 21 of 203...
- Page 22 During installation the OptoJump Next and Logitech webcam drivers will also be installed. If for any reason this does not happen, please install the drivers separately. These are available on the Microgate USB key supplied with the hardware or on the site www.optojump.it...
- Page 23 Figure 8 – Installation – completed. By clicking on <Close> you exit the installation procedure. During the entire installation procedure, it is possible to return to the previous window by clicking on <Back>. Version 1.10 Page 23 of 203...
-
Page 24: Description
(see chap. 4.4.1.7). Click on a news title or an event to open the complete description in a browser window. Figure 9 – First page The interface with which the OptoJump Next system is managed is divided into three main sections: Athletes, Tests and Results. Version 1.10... -
Page 25: Athletes
2.2 A THLETES In this section the profiles of the athletes or patients are created and catalogued. Each profile can contain many items of information (personal data, notes, athlete’s photo, etc.). Membership Groups can be created to improve subdivision into different categories when the tests are to be performed. For example, a group “Football”... -
Page 26: Optojump Next Driver And Hardware Installation
'Support' section. To check that the drivers have in fact been installed, connect the two devices (OptoJump Next hardware and webcam). If installation has not taken place, the operating system will signal an error. In this case disconnect the hardware, install the drivers again and reconnect the hardware. - Page 27 Below is the step-by-step procedure for bar installation: Switch off the OptoJump Next device Place the two OptoJump Rx and Tx bars facing each other at a minimum distance of one meter (maximum 6 meters) Figure 11 – Maximum distance ...
- Page 28 To mount the connection cap just insert the cap in the dedicated slots and apply light pressure on both sides until it has been completely inserted (make sure it is parallel with the two bars; the two connectors should slot in simultaneously). The cap can only be inserted one way round.
- Page 29 Figure 20 - PC connection If more than three OptoJump Next meters are used (three Tx bars and three Rx bars), we recommend you use the adaptor Switch on the OptoJump Next device ...
-
Page 30: Power Supply
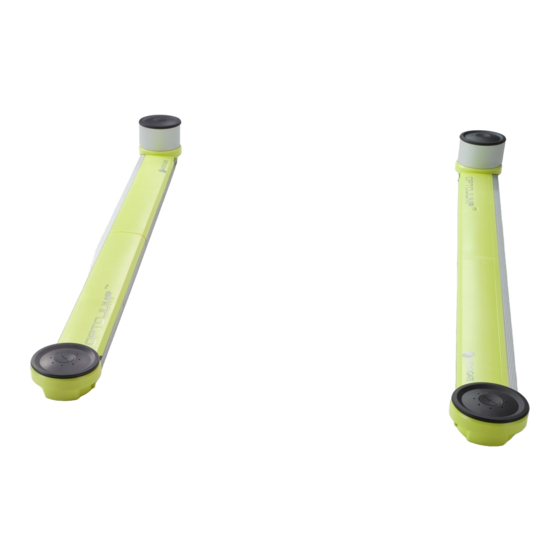
(10 and 30) and for TX and RX Figure 23 - TX bar Figure 22 - RX bar 3.3 P OWER UPPLY OptoJump Next runs on batteries with a life dependent on the number of bars connected (see Version 1.10 Page 30 of 203... - Page 31 OptoJump Next Battery life). The blinking LED next to the adaptor connector shows the battery charge status: Green-blinking = battery sufficiently charged Red-blinking = low battery; the bars must be connected to the mains supply Orange = battery being recharged Figure 24- Battery charge status LED Version 1.10...
- Page 32 To recharge the battery, connect the adaptor plug to the dedicated socket on the drum. The TX RX bars can be recharged simultaneously using the dedicated cable that connects the second drum to the adaptor. Figure 25 - Adaptor and cable for second bar The connection cable is long enough to make it possible to keep the bars at a normal distance (5 - 6 m) and therefore to work normally even when connected to the power supply.
- Page 33 DO NOT use power supplies other than the one supplied with the product. OptoJump Next contains rechargeable Li-Ion batteries (1800 mAh). Battery substitution must exclusively be carried out by authorized personnel. Do not directly connect the cable to the 3-pole socket on the drum.
-
Page 34: Optojump Next Battery Life
3.3.1 O ATTERY LIFE Battery life expressed in hours Bars Theoretical 11.54 5.88 3.93 2.88 2.27 1.86 1.57 1.34 1.14 1.02 Tx96 Theoretical 14.40 7.89 5.39 4.11 3.25 2.69 2.28 2.00 1.74 1.55 Rx96 Version 1.10 Page 34 of 203... -
Page 35: Description Of Functions
ESCRIPTION OF UNCTIONS In this chapter all the functions of every menu of the OptoJump Next program will be described, starting with the functions of the main menu. 4.1 A THLETES 4.1.1 I NSERT THLETES In this section all the athletes stored are displayed. - Page 36 To search for a particular athlete or to filter data (e.g. search for all athletes beginning with “Ros”), insert the text in the box at the top left and press <Search>. To remove the filter, press <Delete filter>. Pressing the button <New Athlete> opens a new panel in which the new athlete’s data must be inserted.
-
Page 37: Athlete Data Input Mask
After a few seconds the measurement is displayed and can be confirmed or repeated. The measurement (essential for the treadmill tests) is useful only with the 1 cm OptoJump Next version, as the resolution of the 3 cm version is too low to give a reliable value (e.g. depending on how the foot is placed, the measurement can vary from 15 to 18 cm). -
Page 38: Importing And Exporting Athletes' Personal Data Excel
THLETES ERSONAL XCEL Once compiled in OptoJump Next, the Athletes' Personal Data can be exported into an Excel-compatible format (XML Spreadsheet 2003). Press <Export List> and specify the name and location of the XML file. If you have Microsoft Excel installed on your computer, double-click on the file icon to launch the program and view the columns with all relevant athletes' data. -
Page 39: Rfid Tag Management
4.1.1.3 RFID T AG MANAGEMENT Witty·RFID is an automatic athlete/patient detection system that makes the trainer/therapist's work easier by not having to enter the name of the person about to perform a test in the software. The reader used on the field or in the lab is also used via the OptoGait software to write the RFID tags (yellow bracelets) with the subject's identification number (that we will call the "bib"... - Page 40 Version 1.10 Page 40 of 203...
-
Page 41: Insert / Edit Group
4.1.2 I NSERT ROUP In this section infinite groups and subgroups can be created, making it easy to manage the athletes’ personal data. Figure 29 – Managing groups As a default there is always a group called ‘Athletes’ which is the Parent group of the ones we will subsequently create. - Page 42 To add one or more athletes to a group there are two other possibilities: Select the group to which you want to add an athlete and press <Add to a Group>, select one or more athletes by checking them in the grid and press <Confirm>. It is possible to use <Select All>...
-
Page 43: Mediagallery
4.1.3 M EDIA ALLERY The patient panel can be used to access the "MediaGallery" module: the aim of this section is to archive images and videos of postural situations without needing to carry out a test with the bars. You can take photographs, record videos and capture stills, making the patient assume various poses which are useful for evaluating his/her anthropometric measurements, posture or pathologies. - Page 44 If we want to see two photos side by side (to make a comparison, for example), click the thumbnail while pressing the CTRL key. Figure 31 - Comparing two photos Version 1.10 Page 44 of 203...
- Page 45 When we are viewing a single image (or a still taken from a video), we can double-click - directly on the photo and not the thumbnail - to open the image editor with its various design tools, angles, etc. If we click Save, the image is saved with our annotations. Figure 32 - Photograph edited in the Still Image Analysis tool Version 1.10 Page 45 of 203...
-
Page 46: Acquisition From Webcam
4.1.3.1 A CQUISITION FROM EBCAM If no photographs have been taken and are ready to import, we can make use of the installed webcam (perhaps setting it to the maximum resolution as described in chapter 4.4.1.4.2). Click <Record from Video>. The webcam frame preview will be displayed. Click <Photo acquisition> to take a photograph which will be automatically added to the carousel. -
Page 47: Test
Once the video has been saved, its title and description can be edited by clicking on the thumbnail, while clicking on the video itself begins playback, with the following buttons appearing underneath: Slider for slow-motion playback (from 10% to 100%) ... - Page 48 Insert data To perform a trial it is advisable (but not obligatory) to follow the direction of the Figure 34 -Execute operations indicated by the red arrow at least the first time you enter this section. The basic flow is ...
- Page 49 Let’s look at an example: Choose one or more athletes by pressing the orange button <Select> under the ‘Athletes’ box, then tick one or more athletes in the grid and press <Confirm>. Shortcuts are possible using the <Select All> and <Deselect All> buttons, whereas if the athlete database has been organized in groups and subgroups, a group can be selected with <Select Group>.
- Page 50 The videos are always acquired in size 640 x 480, even if they are displayed small. The test acquisition can be simulated even if the OptoJump Next hardware device is not connected. The keys that simulate the device are: ...
-
Page 51: Execute Configuration
4.2.1.1 E XECUTE ONFIGURATION Figure 35 – Execute Configuration Test data viewing can be configured by the user. The parameters are: Execution o Rotation based on: if more than one test or athlete is selected, this indicates the chosen mode ... - Page 52 Chart o Chart: shows/hides the chart during the execution; if ‘show’ is chosen, it is possible to choose which values to display (Flight times, Contact times, Height, Power, Pace, etc.) and how (bars or lines) o Grid: shows/hides the white-dotted lines forming a grid on the chart o Labels: displays/hides the labels for the numerical values on each spot of the chart o View: displays the last n-number of acquired data items.
-
Page 53: Video Feedback
4.2.1.2 V IDEO EEDBACK The main idea of this new feature is to show the patient directly some main parameters of the test he/she is carrying out. This allows to request real-time 'corrections' of some trial anomalies, making the test become an exercise, not only a diagnosis. Particular attention is paid to the concept of asymmetry, i.e. - Page 54 The new feature (presently available only for Sprint and Gait Tests; Treadmill Gait, Treadmill Run, and Tapping) is found in Test Module > Execute > Configure, with the two parameters 'Output second monitor' and 'Save Test Data.' When the 'Output Second Monitor' option is selected, a window is created on the second monitor (or on the same monitor, when the second one is not physically present), where the displaying of one test parameter asymmetry can be configured (e.g.
- Page 55 Reference Value: only appears when Mode = Absolute Value and is the value taken as a reference when calculating the thresholds. Obviously it should be set in line with the type of measurement selected (e.g. 30 cm for height, 0.5 s for flight time, 70 cm for step length, etc.).
-
Page 56: Metronome
While performing certain exercises (gait, walking on the spot, jumps), some patients find it easier to maintain a cadence if they are able to follow a constant rhythmic sound. OptoJump Next has a virtual 'metronome' function, which can be used to set the cadence in bpm (beats per minute), and the tone (single or double). -
Page 57: Define / Edit Tests
Click on one of the three categories to view the list of tests pre-defined by Microgate or those you have added yourself in the grid (in the example below ‘Three Jumps’ is a test added by the user). -
Page 58: Main And Secondary Parameters
Name: name identifying the test type (e.g. ‘left foot monopodalic’ or ‘continuous jumps 30 seconds’, etc.) Test Type: this type indication is very important and conditions the fields below, which appear dynamically only after the type has been chosen from this drop-down menu: o Jump Test: type of test that measures flight time (and consequently height), as well as contact time during a series of jumps (in the former version this was called Contact/Flight time) - Page 59 Basic Configuration Parameter ↓ Test Definition Parameter ↓ Single Test Parameter For example: Under Utility/Basic Configuration set the ‘Minimum contact time’ to 60 ms. From this moment every time new types of ‘Jump Test’ are created, they will have a default value of 60 ms (if this value is acceptable, no further changes have to be performed in ‘Secondary Parameters’.).
- Page 60 Figure 40 – Single Test Definition Settings However it might be necessary to change the parameter ONLY for this single test. Insert for example 75 ms and press <OK> or <Apply>. After all values have been recalculated, the data in the table with the numeric results and charts will change.
- Page 61 4.2.2.1.1 Parameter Template The 'Template' field allows setting of secondary test parameters (in the definition but also at test level) following common usage cases. Let's suppose, for example, that a gait test is carried out on a modular system, with the athlete performing very short strides (typical of people who have had an injury), or shuffling the tip of the advancing foot.
-
Page 62: Jump Test
The available fields for the different test types are the following: 4.2.2.2 J Main Parameters Start type: Indicates if the start of the test must take place with a ‘status change’ (i.e. entering or exiting the bars) or with an ‘external impulse’ coming from the jack sockets (start button, signal light, etc.) ... -
Page 63: Reaction Times
4.2.2.3 R EACTION TIMES Main Parameters Start type: Indicates what type of reaction the test must assess, that is: “Visual stimulus”: on the PC screen a red circle becomes green after a random period of time; the athlete must ‘react’ to this stimulus (for example, by jumping) ... -
Page 64: Sprint And Gait Test
Entry point: allows to indicate if the entry point of the Sprint/Gait test is entering from the ‘interface side’ (drum) or from the ‘opposite side’. If ‘automatic’ is chosen, OptoJump Next automatically calculates the direction, considering the LED nearest the center of the foot as the beginning of the LEDs. - Page 65 Test timeout [ms]: this is the end of test timeout in milliseconds; if during a Sprint/Gait test with ‘Timeout’ stop type no input or output signal is received from the measurement area by the OptoJump device for a period longer than or equal to the time set here, the test is considered completed.
- Page 66 Figure 44– Example: bars with gap A practical configuration example of a system of 30 m could be the following: Starting block—50 cm – 13 meters OJ – hurdle – 8 meters – hurdle – 8 meters – hurdle – 1 meter Figure 45 –...
-
Page 67: Treadmill Running Test
4.2.2.5 T READMILL UNNING Main Parameters Start type: this can only be ‘Software command’ Stop type: this can only be ‘Software command’ or ‘End of time’ Test length: appears only if Stop type = ‘End of Time’ and specifies how many minutes:seconds the test must last (from 00:01”... -
Page 68: Treadmill Gait Test
4.2.2.6 T READMILL Main Parameters Start type: this can only be ‘Software command’ Stop type: this can only be ‘Software command’ or ‘End of time’ Test length: appears only if Stop type = ‘End of Time’ and specifies how many minutes:seconds the test must last (from 00:01”... -
Page 69: Tapping Test
4.2.2.7 T APPING Main Parameters Start type: Indicates if the start of the test must take place with a ‘status change’ (i.e. entering or exiting the bars) or with an ‘external impulse’ coming from the jack sockets Start: indicates if at the beginning of the test the athlete must be ‘inside the area’ of the bars or ‘outside the area’... -
Page 70: Vertec Like Test
4.2.2.8 V ERTEC Main Parameters Start type: Indicates if the start of the test must take place with a ‘status change’ (i.e. entering or exiting the bars) or with an ‘external impulse’ coming from the jack sockets (start button, signal light, etc.) ... -
Page 71: Static Test
4.2.2.9 S TATIC Static (Sway) tests are the only ones that do not need OptoGait bars but only the Gyko inertial sensor. The sensor is typically placed behind the patient's shoulder blades and measures the subject's antero-posterior and medio-lateral movements during the exercise (which can be bending on one foot, a squat, etc.) Main Parameters ... - Page 72 Press <Export Test> and save the XML file on your hard drive. Open another database (or create a new one) and press <Import Test> choosing the file previously saved. The tests preconfigured by Microgate can be neither edited nor eliminated, but duplicated. Version 1.10...
-
Page 73: Define / Edit Protocols
4.2.3 D EFINE ROTOCOLS In this section the protocols to be performed can be defined or edited. The protocols can be considered as a pre-defined series of tests to be performed in sequence (e.g. one ‘Squat jump’ + one ‘CMJ’ + one ‘Jumps 15 sec.’). To create a new protocol, select one of the three test macro-typologies (Performance, Gait Analysis, Rehab) and press <New Protocol>. -
Page 74: Results
4.3 R ESULTS Figure 50 – Results In the Results section, the performed tests or protocols are displayed. For better understanding these three terms are defined as follows: Test: is a single test (e.g. 15” jumps) performed on a certain date by a single athlete. Protocol: is a pre-defined list of tests to perform in sequence Analysis: when a single test is displayed or when two tests are compared, certain configuration parameters may be set for the video, the table with numerical data, charts, reports, printouts, etc. - Page 75 Filters Panel Select one of the three macro-categories (Performance, Gait Analysis, Rehab) using the corresponding buttons. With the ‘Data’ radio button, select whether single tests, protocols or analyses should be viewed.. In the latter case, with the icons expand or collapse the tests contained in the protocols. Figure 51 –...
- Page 76 Test List Figure 53 – Test List Components Click on the column names (Athlete, Test, Data) to display the list in order according to that field. Press again to reverse the order (A…Z, Z…A). To delete a test, press the symbol on the corresponding line of the chosen test;...
- Page 77 From the test list it is possible to perform two operations by RIGHT CLICKING on one test line. More precisely: Change person: allows to associate a test with another person, if the wrong association was made during execution; select the command and choose an athlete from the displayed mask; press <Confirm>...
- Page 78 Test Analysis To view a single test, select the corresponding line in the ‘TEST ANALYSIS’ table and press the button <View> (or double-click with the mouse). See chap. 4.3.1 View To compare two tests, insert the relevant tests in the ‘TEST ANALYSIS’ table and press the button <Compare>.
-
Page 79: View
The items from top to bottom are the following: Videos acquired by (one or two) webcam(s); if the webcams are not connected when the test is performed, a fixed image with the Microgate logo will appear Version 1.10 Page 79 of 203... - Page 80 Charts displaying the results: it is possible to choose the chart type (lines or bars) and the measurement to be displayed (times, heights, powers, etc.) Table with numerical data: a grid with various lines and columns displays actually acquired data and calculated data;...
-
Page 81: Configuration Panel
At the top left (see figure below) is the command panel for checking test progress. Figure 59 – Command panel From left to right the commands available are: Back to the start of the test Back one frame ... - Page 82 The <Set Start>, <Set Stop> buttons are for defining the start and end respectively of the part of interest. Place the cursor at the start and finish points of the desired movie clip and press <Set Start> and then <Set Stop>. Thus a part of the movie clip is isolated, deleting the uninteresting ‘dead’ periods.
-
Page 83: Charts
4.3.1.2 C HARTS In OptoJump Next charts there are usually some possible viewing possibilities. (e.g. in Figure 10 ‘Flight times’ and ‘Contact times’ are displayed). To change view type just left-click with the mouse on another option (such as ‘Power’ or ‘Height’). The buttons have the same colors as the chart bars/lines and are therefore used as legend. -
Page 84: Statistics Charts
If a setting is not available it is displayed in black, e.g. if no second webcam is connected, the option ‘View video#2’ is disabled. The OptoJump Next software has a graphic tool for analyzing images acquired by webcams. To enter this section, just double-click with the mouse on the still picture to process (see chap. 5.4). - Page 85 The Data Window allows us to decide every how many events a calculation to work out which of the three bands the patient falls into; e.g. by setting 5 DATA, every 5 steps (or jumps) the average of the selected measurement is calculated, compared with the reference value and the established thresholds and assigned to the good, warning or bad category.
- Page 86 4.3.1.4 T ABLE WITH UMERICAL In ‘Jump Tests’ or ‘Reaction Tests’, the numerical data to display are few and therefore almost always fit into one screen. In Spring/Gait Tests (regular or with treadmill), on the contrary, the numerical data have many columns (a horizontal scrollbar is shown);...
- Page 87 Figure 66 - Run Report At the bottom of the data, some statistical data are calculated: Minimum Value Maximum Value Average (µ) Standard Deviation (σ) Coefficient of Variation (CV: ratio of the standard deviation to the mean ) In some test type, values are calculated for each foot (left &...
- Page 88 4.3.1.4.1 Row Management Menu When RIGHT-clicking with the mouse on a table row a context menu appears with the following items: Figure 68 – Data row management menu Restore row: allows to reset a previously deleted row or a row connected to the row above or below as valid ...
-
Page 89: Start Foot
4.3.1.5 S TART The Starting Foot can be defined during the creation of a test (see 'Define / Modify Test'), or afterward - keeping it as 'not defined' - during the analysis. Sprint and Gait Test on modular systems: Starting outside the test area: the starting foot is the first one to touch the ground inside the area;... - Page 90 Should you realize that the assigned starting foot is wrong, just follow the above-stated procedure and switch the selection. Treadmill Running Test and Treadmill Gait Test. In this case the foot touching the ground after the START command is assigned as starting foot. If the START is assigned during a double support, as occurs quite often in Gait Tests, the starting foot is the one in front on the Treadmill.
- Page 91 Of course it is possible to do this afterwards using the same method described above for the Sprint and Gait Tests on modular systems (even as regards possible foot assigning errors). Figure 71 - Treadmill Running Test: assigning the starting foot Figure 72 - Treadmill Gait Test: assigning the starting foot (double support) Version 1.10 Page 91 of 203...
- Page 92 The starting foot of run and gait tests with modular systems can be change several times. In a round-trip test, for example, it can be useful to change the foot with which the athlete has entered the area after having changed direction. By positioning the mouse on the footprint to be changed and pressing the right button 'Invert foot' is viewed.
-
Page 93: Video Preview Popup: First Step Preview
4.3.1.6 V IDEO REVIEW OPUP IRST REVIEW In some test types, such as Sprint and Gait (run and gait on linear systems), treadmill gait and treadmill running, the operator must decide which foot is the one that began the test. In order to help the user in this operation, which is sometimes difficult because the patient is far away, a new feature called 'video preview popup' has been added, displaying a popup window for 10 seconds, where the first frame of the trial is viewed, allowing the operator to understand if the... -
Page 94: Viewing Of The Optojump Bars
4.3.1.7 V IEWING OF THE The OptoJump bars allows the user to view afterwards the LEDs that have been interrupted (in red) and, if a starting foot has been set, view the footfall thanks to the graphical footprints. The footprint length is directly proportional to the number of interrupted LEDs. - Page 95 the second LED to view the measure (the markers are green and red for the first and second point). Click anywhere on the bars and ESC to delete the measure. Figure 75 - Measure in cm or inches of the distance between two points In this view you can also temporarily delete a series of LEDs for a certain period of time.
- Page 96 Zoom and Config Buttons on the Bars Clicking on the "+" icon at the beginning of the displayed bars, the latter can be zoomed. Click on the "-" icon to go back to normal view. Using the Configure Bars button (useful mainly for run or gait tests) the information to be displayed can be set.
-
Page 97: Print
4.3.1.8 P RINT When <Print> is pressed, a multi-page report is printed with the athlete’s data, summarizing (average) test data, numerical test data (times, heights, power, etc.) and all the charts of the previous window. A box containing the index with the pages allows you (by clicking on each page) to rapidly select the desired section. -
Page 98: Save Analysis
The functionality of Report creation, printing and saving are offered by the external Crystal Report component. If this does not work correctly, we advise you to check whether you have installed different versions or editions of this software. If you have, uninstall the old versions and re-install the OptoJump Next packet. 4.3.1.9 S NALYSIS This function allows you to give the current settings configuration a mnemonic name, so that it can be recalled from the list of saved analyses for future use. -
Page 99: Using Markers
4.3.1.13 SING ARKERS In a test analysis, other markers besides Set Start and Set Stop can be added in certain spots of the video associating them to a note or a comment. The marker list (which can be created, edited and deleted freely) is also printed in the report showing minutes and comments. -
Page 100: Compare
4.3.2 C OMPARE In this section two selected tests are compared. The display structure is similar to the one presented in the previous section. Due to lack of space it is not possible to simulate the bars with the LEDs, which is possible when viewing a single test. -
Page 101: Print, Analysis, Notes, Signature
Another use of the <Synchro> button is to synchronize the two tests on a precise instant (e.g. 10 seconds after the beginning of the test). Set the yellow marker at 10 seconds for both tests; set the start (with <Set Start>) of the Red Test at 6 seconds and of the Blue Test at 8 seconds. Pressing the play button will play the Red Test only until the 8 seconds are over. -
Page 102: History
4.3.3 H ISTORY The History section allows you to analyze an athlete’s progress by graphically and numerically analyzing a series of tests. The section can also be used to analyze the team members, comparing them using the same test type. Select two or more tests (generally of the same type or uniform in order to ensure plausible data) and press <History>. - Page 103 Figure 87 –History of the left foot step length of an athlete Figure 88 – Team analysis; tests ordered by contact time, from the best to the worst Figura 89 - History of a single test for right/left asymmetries The <Print> option allows you to create a report to be printed or exported in pdf, Excel, Word or Html format.
-
Page 104: Export
4.3.4 E XPORT To export data of one or more tests to Excel, add at least one test to the ‘TEST ANALYSIS’ table and press <Export>. You will be asked whether you want the extended version (for each row of data the test heading and the athlete’s data is repeated –... -
Page 105: Utility
4.4 U TILITY 4.4.1 B ASIC ETTINGS The Basic Configuration section includes the following items: 4.4.1.1 G ENERAL Language: the language can be changed at any moment during the execution of the program. Select the desired language from the drop-down menu and press <Save> ... -
Page 106: Reaction Test Configuration
Under the heading ‘Video’, select a Logitech webcam from those available and press <Test>. The choice of webcams has been limited only to high-range Logitech webcams to prevent synchronization problems between OptoJump Next and video data. Webcams by other manufacturers are displayed in gray. - Page 107 Figure 93– Basic Panel for Webcam configuration Press the <Advanced> button to display other commands. Zoom allows you to apply a digital zoom via software. Contrast, Brightness, Saturation, Sharpness allows you to adapt the image; it is advisable to move the corresponding cursor to test the effects of the command.
-
Page 108: Sprint/Gait Test Configuration
4.4.1.4.2 Other video-related configurations End of time video acquisition [s]: this is the time between the end of the test and the end of video acquisition (i.e. a certain number of extra seconds are recorded after the end of the test). ... -
Page 109: Screen
4.4.1.6 S CREEN The OptoJump Next software works on most desktop PCs and notebooks of the most recent generation, usually with a resolution of 1024x768 (the minimum recommended resolution). For users who want to use computers with lower resolutions (e.g., netbooks which often have 1024x600) or computers with lower performance, we recommend that you select the ‘Reduced’... -
Page 110: Optojump (Only For Non-Next Hardware)
As described in chap. 2.1, when the software is launched, a series of news and events are displayed on the homepage, which are updated in real-time via the website www.optojump.com. If the computer is not connected to the Internet, the detection of missing connectivity may take a few seconds. -
Page 111: Optojump Hw Test
4.4.3 O HW T In this section the connected hardware (OptoJump Next bars and/or webcam) can be checked. Opening the function, if the webcam(s) is (are) connected, the live image should be displayed. If one or both images do not appear, check that they have been selected in the Basic Configurations | Video or the drivers have been installed correctly. -
Page 112: Database
4.4.4 D ATABASE OptoJump Next stores all data (athletes, tests, results, settings, etc.) in a database file (Sql Server CE format with the extension .SDF). Most users can use a single file to store all information, which by default will be called ‘OptojumpNext.sdf’, located in the following directory: Documents\Microgate\OptoJump Next The name of this directory changes depending on the operating system used and the language. -
Page 113: Current Database
VideoX_DD_MM_YYYY_HH_MM_SS_ZZZZZZZZ-ZZZZ-ZZZZ-ZZZZ-ZZZZZZZZZZZ.EEE If there is an error when loading the database, OptoJump Next notifies it at program startup, suggesting to look for the database or to continue. In the latter case, OptoJump Next creates a new empty database. The software makes it possible to handle more databases (one at a time) for particular needs: for... -
Page 114: Select
Figure 98 - Database organization example 4.4.4.3 S ELECT If more than one database has been created, you can choose (browsing on the hard disk) which one to be the ACTIVE one. 4.4.4.4 C LEAR Empties the current database of all Athletes, Groups, Test Definitions, and Tests (tests, protocols, analyses) data. -
Page 115: Import
Figure 99 - Saving the OJN file 4.4.4.7 I MPORT Imports an .OJN file previously exported to another PC or to the same PC, in case of data deletion or removal (restore). This command can also be used to merge two databases into one database. This operation is carried out in THREE steps: ... - Page 116 Figure 100 - Choosing the OJN file to import Version 1.10 Page 116 of 203...
- Page 117 Now choose the directory for the import; if not present, create it using <Make New Folder>. The selected folder will contain the extracted files. The database is automatically set as current, as you can see in the relevant field: Version 1.10 Page 117 of 203...
-
Page 118: Devices
IMER AND HOTOCELLS OptoJump Next may be used in combination with the wireless timer and photocell kit called Witty. The photocells have the purpose of giving the external start impulse and to stop the test, as well as recording intermediate times during the sprint/run test with modular systems, if needed. - Page 119 START LAP1 LAP2 STOP Wireless Radio Transmission Max 150 mt. The test has to be set up as start and stop test = "External impulse" (which is given by the Witty timer when the athlete passes the photocells), with a number of intermediate times equal to the number of intermediate photocells of the system.
-
Page 120: Heart-Rate Monitor
4.4.6 H EART ONITOR Starting from version 1.8, the OptoJump Next software can handle a series of external devices, among which heart-rate monitors. At present the following manufacturers and technologies are supported: Polar WindLink: USB stick using Polar W.I.N.D. technology 2.4GHz for transmission; compatible wraps ... - Page 121 To recognize it later and find it among other chest wraps, it is advisable to name it using a mnemonic name (e.g. “AthelteName Garmin Wrap” or “Polar#42” if you have numbered the wraps progressively, etc.) using the <Assign Name> function. Repeat for all the devices that you want to use;...
- Page 122 During the test session it is possible to ACTIVATE only one registered heart-rate monitor at a time. To do so, select the device and press the <Activate> button. The device will move to the top of the list and is ready for use. Version 1.10 Page 122 of 203...
-
Page 123: Sportzone Setup
4.4.6.2 S PORT ETUP From the Utility menu you can configure how the so-called "SportZone" will be displayed on graphs of executed tests. There are 3 possible settings: 5 colored bands (with customizable names), each one being a percentage of the athlete's Maximum Heart Rate ... - Page 124 The percentages of the various bands of course refer to the frequency of every single athlete and must be entered in the relevant fields of each athlete's card. Open an athlete's card, press <Next>>> in the lower right corner to go to the second page of the card and edit the 4 required values.
- Page 125 The athlete's max/min frequency values refer to the moment of the text execution. If the values on the athlete's card are changed, only future tests will be affected and not those already executed. Figura 101 - Viewing only the heart rate with SportZone %FcMax Figura 102 - Viewing the HRM with bottom and top SportZone FC Version 1.10 Page 125 of 203...
-
Page 126: Save As
4.4.7 C HECK PDATE This checks if the installed version is the most recent one. If not, OptoJump Next suggests that you download the newest version from the site. NB: before pressing <Check Update> check that the Internet connection is active. - Page 127 Figure 103 - About window showing the technical data for the Support Department Version 1.10 Page 127 of 203...
-
Page 128: Biofeedback
4.5 B EEDBACK The BioFeedback module (available as of version 1.10) was inspired by the “Video Feedback” feature (Sect. 4.2.1.2) where the user can see some basic test parameters in real time on a second monitor (usually a large TV or a screen/tablet placed in front of the treadmill). By trying to optimize these parameters while performing the test, for example by minimizing asymmetries or lengthening the stride, the patient "trains"... - Page 129 By clicking on the Menu command , we can decide whether to work in Asymmetry or Absolute Values Mode, whether the data are updated with a window containing few data or longer (the changes will then be "slower"). Version 1.10 Page 129 of 203...
- Page 130 Clicking on the black triangle to the left opens the "Thresholds" panel, that is, you can set the Bad Threshold (red) and the Warning Threshold (orange) percentages by dragging the dividing border up or down. Version 1.10 Page 130 of 203...
- Page 131 Whereas, clicking on the black triangle to the right opens another panel with which we can set other parameters. From top to bottom, we have: If we have chosen "Absolute Value" mode, here we can set the "Reference Value" that we need to follow.
- Page 132 To start a test press the <NEW> button, wait if Gyko or other devices need to initialize and press the <START> button Depending on the mode (Asymmetry or Absolute Value) we will see one or two bars with the values and colours depending upon how far they are from the set thresholds and/or reference values.
-
Page 133: Operating Principles
PERATING RINCIPLES 5.1 D EFINITION OF ESULT OLUMNS 5.1.1 G ENERAL INFORMATION Column #: contains information on the various row types. The following values are possible o External: row with a time generated by an external or end of test signal with a timeout or end of time o 1,2,….no. -
Page 134: Jump And Reaction Test
5.1.2 J UMP AND EACTION TCont. [s]: Contact times TFlight [s]: Flight times Height [cm or in]: Height of jumps calculated with the following formula Power [W/kg]: Expressed power calculated with the following formula (�� + �� ��... -
Page 135: Gyko
5.1.2.1 G If the jump test was performed using the Gyko inertial sensor as well (usually at the height of the belt), other columns are added to the previous values. The most important ones are those highlighted in the figure below: By clicking on the >>... - Page 136 = Eccentric Phase, Loading = Concentric Phase, Thrust Parameter Description Concentric phase duration The duration from the moment when the speed becomes > 0 until the moment of separation DurationConc [s] Eccentric phase duration The duration from the start of the movement to the instant before that when the speed becomes >...
- Page 137 Parameter Description Maximum power The peak in Power before separating from the ground (Force/kg * Velocity) Pmax [W/Kg] Concentric Work Area of the concentric part of the power curve. WorkConc [J/Kg] Similar to P * deltaT Eccentric Work Area of the eccentric part of the power curve. WorkEcc [J/Kg] Version 1.10 Page 137 of 203...
- Page 138 5.1.2.1.2 Landing Parameter Description Maximum landing force The peak in Force at impact, expressed as BodyWeight. 2BW is equivalent to 2 times body weight Fmax Land [BW] Time to Maximum Landing Force The time it takes to reach peak force starting from the moment of contact after jumping Time2Fmax Land [J/Kg] Loading Rate...
-
Page 139: Sprint/Gait Test
5.1.3 S PRINT The following are some useful definitions to explain the values displayed on the table with numerical data. Step: the distance between the tip (toe) of two subsequent feet or the distance between the heel of two subsequent feet depending on the settings in the parameter ‘Step length calculation’ (see chap. - Page 140 Figure 108 - Speed calculation Acceleration: is calculated as the relation between speed delta of the two steps and the sum of the contact and flight time. Figure 109 - Acceleration calculation �� − �� �� = �� + �� + ��...
-
Page 141: Gyko
5.1.3.1 G If the test was performed using the Gyko inertial sensor as well (usually at the height of the shoulder blade), there are the following in addition to the previous values: Area [cm ]: The Area parameter provides a dimension of how much the subject moves his/her trunk. -
Page 142: Reference Indexes
5.1.4 R EFERENCE NDEXES In the Sprint and Gait Test parameters (chap. 4.4.1.5) the speed of an 'ideal' athlete (the so-called 'super athlete') during the 3rd, 6th, and 9th step can be indicated. These are in fact the three most interesting moments of a sprint;... -
Page 143: Imbalance Index
5.1.5 I MBALANCE NDEX The Imbalance Index column (Imb%) in sprint tests (Run Data) is an indicator of running 'asymmetry' between the right and the left. At first a linear interpolation of two supports the same type can be assumed. Consequently, the contact time of an ideal athlete's support would be halfway between the previous and the following;... - Page 144 Figure 114 - Example of imbalance index in Run Data Version 1.10 Page 144 of 203...
-
Page 145: Static Tests (Sway)
5.1.6 S TATIC ESTS In the Test Data columns we find these values: Time [s]: Progressive time LH/RH [mm]: Medio-lateral displacement (positive values = to the right, negative ones = to the left) Ant/Post [mm]: Antero-posterior displacement (positive values = anterior, negative ones = posterior) Clicking on the Test Data link takes you to the Summary Data section where the data are displayed that we also find in the default Body Sway Protocol (see Sect. - Page 146 Let's take as an example a trajectory of a Posture (Sway) test. The graph is slightly different to the one used in the software but it gives us a better understanding of the data (the colour scale that describes the density of points by area – blue = low density, red = high density – is not present in the software).
-
Page 147: Area
5.1.6.1 A Area [mm Area of the ellipse of confidence (95%): the 95% ellipse of confidence is the ellipse that contains approximately 95% of the points of the trajectory. The output parameter is the area of the ellipse. Version 1.10 Page 147 of 203... - Page 148 Convex Hull Area [mm The Convex Hull is the smallest polygon that contains all the points of the trajectory. Compared to the ellipse, it is more strongly affected by the presence of outliers. Version 1.10 Page 148 of 203...
-
Page 149: Lengths
5.1.6.2 L ENGTHS M - Modulus Length [mm]: This is the total length of the trajectory obtained as the sum of the distances from one point to the next. (The sum of the points on the curve in the figure) Version 1.10 Page 149 of 203... - Page 150 AP - antero-posterior AP length [mm]: The AP length is the total distance in the antero- posterior direction given as the sum of the absolute distances between two consecutive points in the AP direction (the sum of the points on the curve in the figure) ML - medio-lateral ML length [mm]:...
- Page 151 Trajectories Distances DM - Modulus M - modulus - AP – antero-posterior DAP – antero-posterior ML - medio-lateral DML – medio-lateral Version 1.10 Page 151 of 203...
-
Page 152: Mean Distances
5.1.6.3 M ISTANCES M - Modulus Mean Distance [mm]: This is the mean distance from the midpoint of the trajectory. It is the average of the curve in the figure. Version 1.10 Page 152 of 203... - Page 153 AP - antero-posterior Mean AP Distance [mm]: This is the mean distance from the midpoint of the antero-posterior trajectory. It is the average of the curve in the figure ML - medio-lateral Mean ML Distance [mm]: This is the mean distance from the midpoint of the medio-lateral trajectory.
-
Page 154: Root Mean Square (Rms)
5.1.6.4 R (RMS) QUARE DM - Modulus RMS [mm]: This is the dispersion of the distance (root mean square). In this case, as the points are centred on the mean, it is equivalent to the Standard Deviation Version 1.10 Page 154 of 203... - Page 155 DAP - antero-posterior AP RMS [mm]: This is the mean distance from the midpoint of the antero-posterior trajectory. It is the average of the curve in the figure DML - medio-lateral ML RMS [mm]: This is the mean distance from the midpoint of the medio-lateral trajectory.
-
Page 156: Mean Frequency
5.1.6.5 M REQUENCY M - Modulus Mean Frequency The mean frequency is the frequency of rotation of the centre of [Hz]: pressure (COP) considering as if the COP had travelled the total length of the trajectory on a circle whose radius is the mean distance Version 1.10 Page 156 of 203... - Page 157 AP - antero-posterior Mean AP This is the frequency of a sinusoidal oscillation of mean value Frequency [Hz]: equal to the mean AP distance and total length equal to the AP length ML - medio-lateral Mean ML This is the frequency of a sinusoidal oscillation of mean value Frequency [Hz]: equal to the mean ML distance and total length equal to the ML length...
-
Page 158: Velocity
5.1.6.6 V ELOCITY M - Modulus Mean Velocity [mm/s]: This is the mean travel velocity of the trajectory. Version 1.10 Page 158 of 203... - Page 159 AP - antero-posterior Mean AP Velocity This is the mean travel velocity of the [mm/s]: trajectory in the antero-posterior direction ML - medio-lateral Mean ML Velocity This is the mean travel velocity of the [mm/s]: trajectory in the medio-lateral direction Version 1.10 Page 159 of 203...
- Page 160 Trajectories Power spectrum (PSD) FM - Modulus M - modulus - AP – antero-posterior FAP – antero-posterior The tests are analyzed in the frequency range 0.15 Hz to 5 Hz ML - medio-lateral FML – medio-lateral Version 1.10 Page 160 of 203...
-
Page 161: Total Power
5.1.6.7 T OTAL OWER We define for the modulus, AP and ML: the power spectrum at the frequency f[m] (power spectral density) the discrete increase in frequency in fft the spectral moment Version 1.10 Page 161 of 203... - Page 162 M - Modulus Total Power [mm This is the area of the power spectrum in the range 0.15 - 5Hz. Also equal to AP - antero-posterior Total AP Power [mm This is the area of the power spectrum in the range 0.15 - 5Hz of the AP trajectory.
- Page 163 Version 1.10 Page 163 of 203...
-
Page 164: 50% Power Frequency
5.1.6.8 50% P OWER REQUENCY M - Modulus 50% Power The frequency below which 50% of the total signal power is Frequency [Hz]: contained Version 1.10 Page 164 of 203... - Page 165 AP - antero-posterior 50% AP Power The frequency below which 50% of the total AP signal Frequency [Hz]: power is contained ML - medio-lateral 50% ML Power The frequency below which 50% of the total ML signal Frequency [Hz]: power is contained Version 1.10 Page 165 of 203...
-
Page 166: 95% Power Frequency
5.1.6.9 95% P OWER REQUENCY M - Modulus 95% Power The frequency below which 95% of the total signal power is Frequency [Hz]: contained Version 1.10 Page 166 of 203... - Page 167 AP - antero-posterior 95% AP Power The frequency below which 95% of the total AP signal power Frequency [Hz]: is contained ML - medio-lateral 95% ML Power The frequency below which 50% of the total signal power is Frequency [Hz]: contained Version 1.10 Page 167 of 203...
-
Page 168: Centroidal Frequency
5.1.6.10 ENTROIDAL REQUENCY M - Modulus Centroidal Frequency This is the frequency at which the "spectral [Hz]: mass" is concentrated Version 1.10 Page 168 of 203... - Page 169 AP - antero-posterior AP Centroidal Frequency This is the frequency at which the "spectral [Hz]: mass" in the AP direction is concentrated ML - medio-lateral ML Centroidal Frequency This is the frequency at which the "spectral [Hz]: mass" in the ML direction is concentrated Version 1.10 Page 169 of 203...
-
Page 170: Frequency Dispersion
5.1.6.11 REQUENCY ISPERSION M - Modulus Frequency Dispersion This is a measurement between 0 and 1 of the content variability in frequency of the power spectrum Version 1.10 Page 170 of 203... - Page 171 AP - antero-posterior AP Frequency Dispersion This is a measurement between 0 and 1 of the content variability in frequency of the power spectrum in the AP direction ML - medio-lateral ML Frequency Dispersion This is a measurement between 0 and 1 of the content variability in frequency of the power spectrum in the ML direction Version 1.10...
-
Page 172: Gait Analysis Definition
5.2 G NALYSIS EFINITION Note: The names of these measurements are used in English in other locales, because the English terms are standard technical Gait Analysis terminology. Terms such as Single Support, Double Support, Stance, Swing, etc. are well known among professionals; therefore these terms are not translated in any language. The following are some useful definitions to explain the values displayed on the table with numerical data: Figure 115 - Gait analysis terminology... - Page 173 Figure 116 - Gait Cycle: Stance & Swing Each gait cycle consists of two phases, where both feet are in contact with the ground, called Double Support. The first Double Support (DS1 in Figure 115 - Gait analysis terminology referred to the right foot) is also called ‘Load Response’, whereas the second (DS2) is called ‘Pre Swing’).
- Page 174 Run Data Columns TExt. [s]: External time: available only for external impulse. This is the time between the event (start/stop) of the impulse and the entry/exit into/from the OptoJump bars; it can also comprise split times Time [s]: progressive time (split) from the test beginning ...
- Page 175 Gait Data Columns TExt. [s]: External time: available only for external impulse. This is the time between the event (start/stop) of the impulse and the entry/exit into/from the OptoJump bars; it can also comprise split times. Stance phase [s | %]: The stance phase is the weight phase supporting phase of each gait cycle.
-
Page 176: Invalid Times Management
5.3 I NVALID IMES ANAGEMENT There are cases, during a test, where the program may acquire invalid times. The main cases are: The OptoJump device is not installed correctly: if the OptoJump device is badly positioned on the ground, or the ground is particularly uneven, during performance of a test invalid flight or contact times may occur ... - Page 177 Invalid contact time (delete contact time): Cont. time Flight time is Cont. time Flight time 0.35 0.43 0.35 0.43 0.30 0.15 0.30 0.45 (0.15+0.05+0.25) 0.05 (inval.) 0.25 0.32 0.41 0.32 0.41 Invalid flight time (delete flight time): Cont. time Flight time is Cont.
-
Page 178: Video Analysis
5.4 V IDEO NALYSIS Figure 118 – Video Analysis To analyze a still video picture, double-click with the mouse on the video window. In a Compare analysis or in a test, where two webcams are used, use CTRL+double-click to edit the two images. Available commands are the following, from top to bottom: ... - Page 179 Draw center-radius circumference Draw two-point arc Draw center-radius arc Draw three-point arc (Start / End / Include) Draw three-point arc (Start / Include / End) Draw lines viewing internal angle Draw lines viewing external angle ...
-
Page 180: Managing Images
5.5 M ANAGING MAGES When saving an image (or two images in the case of video frames of a test comparison) it is possible to add a caption (i.e. a short name used as title) and a note (a larger field for an image description). Images are managed (caption and note editing, changing of order of appearance and possible deletion) using the button <Images>... -
Page 181: Default Tests And Protocols
EFAULT ESTS AND ROTOCOLS Most tests are well-known standard tests (such as Squat Jump, Stiffness, Counter movement Jump) for which it is enough to follow the instructions on the screen (enter/exit test area, carry out a given number of jumps, wait for sound signal at the end of the test etc.). In this section you will find default tests and protocols which might raise some doubts as regards their initial setup and execution. -
Page 182: Drift Protocol
6.1 D RIFT ROTOCOL The Drift Protocol is a test developed for verifying an athlete's or a patient's 'dynamic stability' by having him/her carry out 4 tests one after another on one leg measuring his/her displacement (drift) on the vertical and horizontal axis. Go to Test >... - Page 183 Figure 121 - Drift Protocol sequence Carry out the 4 tests reminding to press SAVE at the end of each test before moving on to the following test. At the end of the protocol go to Results, select the option 'Protocols' from Display>Data and choose the protocol which has just been executed, with the symbol Figure 122 - Selecting a protocol to be printed Double-click on the protocol to be analyzed (or click the button <Display>);...
- Page 184 Each jump is displayed as a yellow dot (if you can not see 10 dots per leg some might be superposed); the two large red and green dots (left and right) represent the athlete's tendency to move into a certain direction (e.g. upwards to the right), whereas the dotted triangle indicates the 'stability area'.
-
Page 185: Drift Protocol
6.1.1 2D D RIFT ROTOCOL With its two-dimensional system (even the minimum 1 x 1 meter will suffice), the protocol can be significantly simplified by making the patient perform just 10 jumps (5 with the right and 5 with the left). -
Page 186: Five Dot Drill Protocol
BFS Bigger Fast Stronger, developed especially for this test and contributing to its standardization. Place the two OptoJump Next bars outside the longer side of the rectangle with the drum at the test entrance. Figure 124 - 5 Dot Drill circuit and positioning of bars The protocol is made of 5 different exercises to be carried out 6 times WITHOUT PAUSES. - Page 187 The 5 tests are carried out as follows (a video explaining the exercise is available on our website): Up & Back 1. Start with feet on A and B 2. Jump rapidly with both feet on C 3. Jump putting one foot on D and one on E 4.
- Page 188 Even though this is a single test, it must be carried out as PROTOCOL, because this allows to have a particular print report showing the 'level' based on the following table: DOT DRILL STANDARDS Less than 50 seconds Super Quick 50-60 seconds Great 60-70 seconds...
- Page 189 Figure 127 - 5 Dot Drill report output The parameter '% Compared average' is calculated as difference between the average of all 5 tests and the average value of each single test. E.g. for Up & Back: (8.328 – 8.565) / 8.328 The fatigability index is calculated using the average of the first 6 contact time values and compared to the average value of the last 6 contact times.
-
Page 190: Gg' Protocol
6.3 'GG' P ROTOCOL This protocol (whose name is based on the initials of its inventors) is made of the following test series with the object of an initial athlete evaluation to be used during scouting phase. 1. Treadmill Gait Test at 5 kmh (usually for 30 seconds) 2. - Page 191 The 'Knee angle' parameter is an index which can be derived 'manually' from a video still image. Once the parameter with had been defined using the dedicated graphic tools, the value can be entered to the 'Indexes' section and will be showing in your print. Example: Expand the GG protocol, find the 'SquatJump 2 Legs' test and display it as a single test Find the desired spot in the video, double-click on the video and enter Video Analysis.
- Page 192 Press the 'Indexes' button and enter the measured value: Version 1.10 Pag. 192 di 203...
-
Page 193: Single Leg 3 Hops Protocol
6.4 S INGLE ROTOCOL This protocol allows evaluation of the functionality of the anterior cruciate ligament with two one- leg jumps consisting of 3 forward jumps each (possibly after post-injury rehabilitation) as regards power, as well as stabilization. Have the athlete carry out 3 forward hops (starting slightly out of the test area on the interface drum side) first with the left leg and then with the right leg. - Page 194 At the end of the test, a report can be viewed under 'Results', showing the main values divided by leg and differences in %. Figure 130 - Report Of course it is possible to see the details of a test by expanding the protocol and selecting 'View' in a test or 'Compare' to compare two tests.
-
Page 195: Mip (March In Place) Protocol
6.5 MIP (M ARCH IN LACE ROTOCOL The MIP protocol consists of two tests in which the patient must march on the spot for 30 seconds, the first time with his/her eyes open and the second with his/her eyes closed. The test is defined with a starting point INSIDE the area and the right foot as the starting foot (the patient should therefore begin the test BY LIFTIING the right foot first). - Page 196 The Alpha angle is normally defined as follows: 0° -90° 90° Version 1.10 Pag. 196 di 203...
-
Page 197: Vertec Like Test
The test is not compatible with OptoJump Next bars with a resolution of 3 At the beginning of the test, the software prompts to extend one arm upwards closing the bar contacts (red led) to measure the athlete's height;... -
Page 198: Ski Test
6.7 S This test must be carried out with both feet parallel to the bars jumping sideways from one foot to the other (usually for 15 seconds). The main objective is to compare the contact and flight times, as well as the power of the right and left foot. Figure 133 - Ski Test: side jumps from one foot to the other Figure 134 - Ski Test results with separate times for right and left foot Version 1.10... -
Page 199: Body Sway Protocol
6.8 B ROTOCOL The "Body Sway" protocol consists of two static (Sway) tests in which the patient must stand as motionless as possible for 30 seconds, in the first test with eyes open and in the second one with eyes closed. There is no need for the OptoGait bars, but only the Gyko inertial sensor. -
Page 200: Technical Data
ECHNICAL 7.1 T TX/RX B ECHNICAL Internal power supply (range of measurement from 1 to 5 m) Rechargeable Li-ion battery 7.4V 1800mAh 24VDC ±5% External power supply (range of measurement from 1 to 10 m) Infrared wave length 890 nm Number of optical sensors 96 per meter Space resolution... -
Page 201: Pc Minimum Requirements
A 'regular' desktop or notebook PC with Microsoft Windows XP Sp3, Vista Sp2, or Windows 7 is usually enough for running the OptoJump Next software without any problems. We recommend to perform a Windows Update before setting up the software. - Page 202 Version 1.10 Pag. 202 di 203...
- Page 203 Microgate, REI2, RaceTime2 and MiSpeaker are registered trademarks of Microgate s.r.l. Windows is a registered trademark of Microsoft co. Microgate s.r.l. reserves the right to modify the products described in this document and/or in the relative manuals without notice. Microgate S.r.l.
Need help?
Do you have a question about the OPTOJUMP Next and is the answer not in the manual?
Questions and answers