Table of Contents
Advertisement
Quick Links
Advertisement
Table of Contents

Summary of Contents for CPO Science DataCollector
- Page 2 DataCollector designed by: Dr. Thomas C. Hsu Thomas S. Narro David Zucker in conjunction with: Darren Garnier Copyright © 2004 CPO Science 6/04...
-
Page 3: Table Of Contents
Starting the DataCollector Application ........ -
Page 5: Introduction
Chapter 1: Introduction The CPO Science DataCollector is a device used to view and record data from various sensors, including analog sensors from Fourier Systems and Vernier, as well as photogates from CPO Science. The DataCollector consists of a palmOne Zire™... - Page 6 Zire handheld computer • the CPO Science AC adapter • analog sensors (a temperature sensor is shown) • digital sensors (CPO Science photogates are shown) See Table 2 on page 5 for a list of kit configurations. Figure 1: Data Collection Components...
- Page 7 • the HotSync Manager software • the CPO Science DataCollector conduit software After completing an experiment, the data can be transferred to a personal computer for further analysis and manipulation. Each experiment from the Zire handheld is saved on the PC as a comma separated value (CSV) file, readable by Microsoft Excel, Mathworks Matlab, and many other programs.
- Page 8 Table 1 lists the software components involved in the transfer and analysis process. Table 1: Software Components Software Purpose Runs on... Source DataCollector Records data from Zire DataCollector sensors and presents Handheld Resource CD-ROM graphs and tables or Support Website...
-
Page 9: Kit Contents
Chapter 2: Kit Contents There are three different configurations of the DataCollector available. These are summarized in Table 2 below. Table 2: DataCollector Kits DataCollector DataCollector DataCollector Solo Standard Kit Starter Kit Part #792-1500 Part #792-1503 Part #792-1505 Includes: Includes: Includes: •... -
Page 10: Warnings And Precautions
Chapter 3: Warnings and Precautions Please make note of the following warnings and precautions. Failure to follow these guidelines can result in damage to your DataCollector and possibly bodily harm. IMPORTANT: The AC adapter that comes with the Zire handheld will not work with the DataCollector. -
Page 11: Getting Started
Zire handheld down until it snaps in place. Avoid pressing any of the buttons. To remove the Zire handheld from the DataCollector, gently pull back on the spring clip until the handheld pops up. Then, gently slide it off the alignment pin and USB connector. -
Page 12: Powering The Datacollector
Powering the DataCollector Use only the provided 9V DC, 500 mA CPO Science adapter with the DataCollec- tor. After connecting the adapter to the power jack on the DataCollector, slide the power switch down. The indicator should light up red. -
Page 13: Connecting Cpo Science Photogates
Fourier Sensor Adapter (CPO Science Part #392-1511). Connect the British Telecom end of the cable to either of the analog ports on the DataCollector and the 8 pin mini-DIN end of the cable to a Fourier sensor. Figure 5: Fourier Sensor Adapter... -
Page 14: Setting Up A Computer For Use With The Datacollector
Other Photogates To use Fourier, Vernier, or Pasco photogates with the CPO Science DataCollector, use the adapter to be released late 2004 (CPO Science Part #392-1513). No adapter is necessary to use CPO Science Photogates with the DataCollector. Setting up a Computer for use with the DataCollector CPO Science provides software that enables you to download experimental data from the Palm Zire handheld to your personal computer. -
Page 15: Using The Datacollector
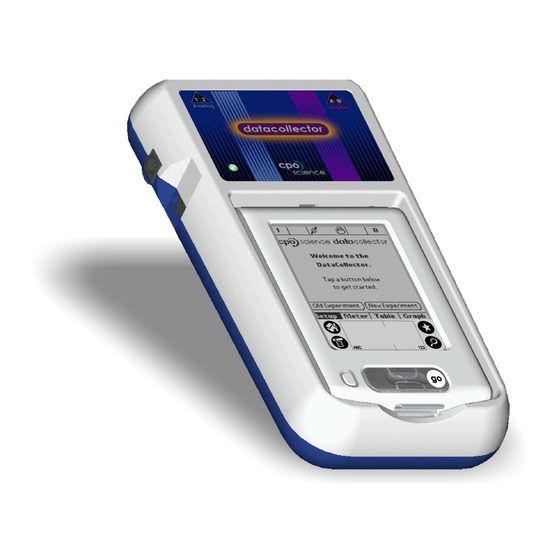
CPO Science, a Go sticker was placed on the correct button. Figure 6: The Zire Buttons and Silk-Screened Area Another way to start the DataCollector app is to tap the Home icon and find the DataCollector app in the list. Then, tap on the DataCollector icon to start the appli- cation. - Page 16 Figure 7: DataCollector Application Welcome Screen Indicators and Icons Across the top of the DataCollector application screen is a status bar with a variety of indicators. They are summarized in Table 3. Table 3: DataCollector Indicators...
-
Page 17: Setting Up A New Experiment
Indicates a running experiment or a stopped one. Setting Up a New Experiment To set up a new experiment, start the DataCollector app with Zire connected to the hardware and the hardware powered on (the indicator should be lit). Tap the New Experiment button on the startup screen. -
Page 18: Interval Mode
Use interval mode to record time intervals with digital sensors such as photogates. The New Experiment Setup dialog is shown in Interval mode in Figure 8. With input A enabled, the DataCollector records the time that photogate A’s beam was interrupted - this time is labeled T . - Page 19 Figure 9: Time Intervals and Photogates (A+B mode shown) The DataCollector records data until the number of Samples has been reached. However, if Samples is set to Continuous, the DataCollector will not stop the cur- rent experiment on it's own - stop it by pressing the 'Go' button.
- Page 20 Setup dialog box in Standard mode is shown in Figure 10. The DataCollector records data until the number of Samples has been reached. However, if Samples is set to Continuous, the DataCollector will not stop the cur- rent experiment on it's own - stop it by pressing the Go button.
- Page 21 Figure 10: The New Experiment Setup dialog in Standard Mode Choosing A Mode Use Table 4 to help you decide between Interval and Standard mode. Table 4: Choosing between Interval and Standard Mode If you want to... Just..measure only intervals Start a New Experiment of Interval type.
-
Page 22: Navigating Within The Datacollector Application
Tap the Meter Only button. Navigating within the DataCollector Application You’ll see four “tabs” at the bottom of the DataCollector application screen (see Figure 7) labelled Setup, Meter, Table and Graph. Tap on one of the tabs to switch between screens, or use the DateBook hard button (see Figure 6 on page 11), to... - Page 23 Setup Screen When the DataCollector application is started, a welcome message is presented (see Figure 7 on page 12) in the Setup Screen. As shown in Figure 11, once an experiment has been configured, the Setup Screen displays setup information such as the experiment name, mode, number of sam- ples, sampling rate, and the sensors connected.
- Page 24 Tapping the Old Experiment button brings up a dialog box, shown in Figure 12, that allows you to open, view and delete old experiments. To open an old experiment, tap on an experiment row in the dialog, then tap the Open button.
- Page 25 Meter Screen The Meter Screen displays current values for sensors included in the current exper- iment, and also displays the experiment clock. See Figure 13. The experiment clock runs while the experiment is running, and stops when the Go button is pressed to stop the experiment. In Meter Only mode, the experiment clock can be used like a stopwatch - it can be reset to zero by tapping the Reset button.
- Page 26 Table Screen The Table Screen shows data in the current experiment. See Figure 14. If the experiment is in-progress, data in the table is updated as it’s collected. The single row above the header row displays live data, similar to the Meter Screen.
- Page 27 Graph Screen The Graph Screen displays a graph of data from the current experiment (see Figure 15), using settings from the Table Screen. At the bottom of each column shown in the Table Screen (see Figure 14) are two buttons labeled X and Y. To set a column as the source for the data for the X-axis in the graph, tap the X button below that column.
-
Page 28: Application Menus
Application Menus The Options Menu The Options menu is available in any of the four screens of the DataCollector application. Tap the Menu icon in the silk-screened portion of the Zire, and you’ll see the Options menu, shown in Figure 16. - Page 29 The Preferences Dialog From the Preferences dialog, you can set the name of the DataCollector that is used in downloading experimental data to a personal computer (see “Downloading Data to a Computer” on page 26). In a classroom setting, it may be desirable to dif- ferentiate between multiple DataCollector units, and this can be accomplished through the DataCollector Name setting.
-
Page 30: Downloading Data To A Computer
Experimental data from the CPO Science DataCollector can be transferred from the Zire handheld to a personal computer via a HotSync operation. It is necessary to install the Palm HotSync Manager software as well as the CPO Science DataCollector Conduit before experimental data can be transferred. Please ensure... - Page 31 Table 5: Meaning of the file name UNITNAME The name assigned to a particular Zire handheld in the DataCollector Preferences screen. This value is set to “Unit ID” by default. EXPxxxx The letters “EXP” followed by a four digit number that increases with each experiment.
-
Page 32: Technical Information
Chapter 7: Technical Information The CPO Science DataCollector has the following technical specifications: Input voltage: 6 V DC/300 mA minimum Sensors: 2 Analog Sensor Ports (British Telecom jacks) 2 Digital Sensor Ports (RJ-11 jacks) See pinout descriptions below Handheld computer:... -
Page 33: Digital Sensor Pinout
Table 6: Analog Sensor Pinout Connection +5 V DC power supply (from DataCollector) Signal output (to DataCollector) Digital Sensor Pinout Digital sensors use telephone (RJ11) plugs with the following connections: Table 7: Digital Sensor Pinout Connection No connection Ground Signal output (to DataCollector) -
Page 34: Accessory Information
Accessory Information The DataCollector stand can simply be snapped back into place if it comes off. You can order a replacement stylus from the palmOne web store: http://www.palmone.com/ The following accessories are/will be available from CPO Science: Table 8: Accessory List Accessory Part No. -
Page 35: Glossary
Switch between the Setup, Meter, Table, and Graph screens by tapping the appropriate tab. Status bar ..a series of indicators at the top of the DataCollector App screen showing which sensors are connected and the status of the current experiment. -
Page 36: Warranty Information
CPO Science warranties this instrument against defects in materials and workmanship for a period of one year. Repair and/or replacement parts can be obtained from CPO Science by sending the damaged or defective parts to: CPO Science 26 Howley Street, 3rd Floor...
Need help?
Do you have a question about the DataCollector and is the answer not in the manual?
Questions and answers