
Related Manuals for YIC Technologies EMS8000

Summary of Contents for YIC Technologies EMS8000
- Page 1 EMScanner User Manual V01/0912 www.yictechnologies.com Distributed by: Sie haben Fragen oder wünschen eine Beratung? Angebotsanfrage unter +49 7121 / 51 50 50 oder über info@datatec.eu...
-
Page 2: Safety Notices
YIC Technologies shall not be liable for errors or for incidental or consequential damages in connection with the furnishing, use, or performance of this document or any information contained herein. -
Page 3: Minimum System Requirements
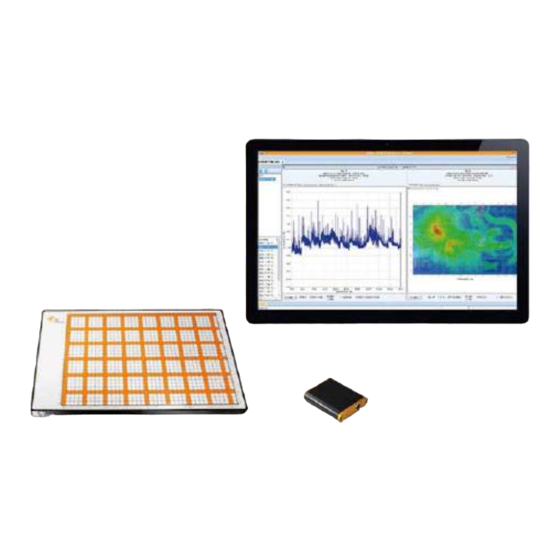
About the EMScanner Products EMScanners product family provides board-level design teams with world-leading fast nearfield magnetic data to help diagnose EMC design issues. EMScanner product line consists of EMScanner, EMScannerR+ and EMProbe, these instruments capture and display visual images of spectral and spatial scan results in seconds. This allows the design team to immediately analyze and compare design iterations. - Page 4 Technical Support To help us provide fast and seamless technical support, kindly gather the following information and contact Technical Support as instructed further below: 1. Serial number of your unit. 2. Software and firmware versions: 3. Windows OS information 4. Keysight IO version 5.
- Page 5 Cables & Component Checklist Components Supplied with the EMScanner System Scanner board EMScanner The adapter controls the EMScanner Adapter RF SMA to type It is referred as the RF cable in this manual. It connects the scanner to the N coaxial cable spectrum analyser and has a SMA connector for the scanner and a N connector for the spectrum analyzer 50...
-
Page 6: Options And Accessories
Customer Provided Components 1. Spectrum Analyzer: It must include the necessary options to work with the EMScanner (see Supported Spectrum Analyzers). It measures the radio frequency (RF) signal received from the EMScanner, generated by the very-near-field emissions of an adjacent activated PCB and it outputs the data to the PC. Most Keysight`s and R&D`s models are supported. -
Page 7: Connection Diagram
3. Connect PC, scanner, adapter and spectrum analyzer as per the diagram below. If you are using Ethernet between the PC and the spectrum analyzer, use a crossover Ethernet cable. If the spectrum analyzer has multiple trigger ports, always connect to Trigger 1 IN. Connection Diagram Hardware Setup 1. - Page 8 EMScanner and Adapter ports 1. SMB external trigger cable port 2. LED light shows three stages: Red: Boot mode (this stage is fast; you may not even notice it) Orange: Initiation mode (checking adaptor’s firmware) Green: User mode (adaptor is connected and ready) 3.
-
Page 9: Software Installation
Software Installation 1. Plug-in the EMScanner USB drive. Select the software folder and double click on Setup.exe file 2. When you are prompted “Do you want to allow the following program from an unknown publisher to make changes to this computer” click Yes 3. - Page 10 LAN Connection Step 1 - Spectrum Analyzer Setup • In order to make Technical Support easier, the IP address of the analyzer must be set to the default IP 172.16.1.148 and the PC’s at 172.16.1.99. • Please check Technical Bulletin #9 if you have a Keysight spectrum analyzer. Step 2 - PC Setup •...
- Page 11 • Click Finish • When you first connect to the spectrum analyzer open Keysight Connection Expert • Keysight IO will automatically detect the spectrum analyzer and display the analyzer model. If it doesn’t click Rescan. If it still doesn’t detect the analyzer, click Manual Configuration.
- Page 12 • Select LAN instrument and enter the IP address: 172.16.1.148 and click Accept. • Click Instruments tab to see that spectrum analyzer is successfully detected. It has to be a “favourite” to operate and must have a yellow star. www.yictechnologies.com...
- Page 13 Step 3 – EMScanner Software The software automatically detects the spectrum analyzer. Turn on the spectrum analyzer, connect it to the PC and start the EMViewer software. As soon as the EMViewer software is launched, two messages are displayed at the bottom of the screen.
- Page 14 If there is a connection problem between the spectrum analyzer and the PC, an error message will be displayed as shown below. Setup and Modes of Operation Setup EMScanner is a very-near-field scanning system. It is composed of 1,218 H-field probes that operate between 150 kHz and 8 GHz.
- Page 15 3. Cable testing Cables from and to the PCB can be tested for emissions. Place the DUT on the scanner and tape the cables on the scanner or simply tape only the cables on the scanner. 4. System testing EMScanner will help detect any leakages from a system under test for both frequency and location.
- Page 16 Menu Bar Menu Bar is shown below. It allows the user to start a project node, to select a scan type, to start a single scan, to scan continuously, and to stop a scan, as well as to specify scan settings.
- Page 17 If there are any changes compared to the saved version of the project file this will be indicated by an asterisk (*) behind the file name. If you want to keep your changes, be sure to save the file before you close. In the example below, a new project file is created and then a Spectral node is added to the project file.
-
Page 18: Viewing Scan Results
Viewing Scan Results Depending on the scan type, you can view the scan results in either spectral or spatial or both views. Spectral View The name of the scan is on the top of the graph. Below the name is the scan type, scan frequencies, minimum and maximum amplitudes of this span, LNA or Attenuator values used, patented scanner model and date and time of the scan. - Page 19 Spatial View The name of the scan is on the top of the graph. Below name is the scan type, scan frequency, minimum and maximum amplitudes of this frequency, LNA or Attenuator values used, patented scanner model and date and time of the scan. Mouse over the graph to display row / column coordinates, frequency and amplitude values.
- Page 20 View can be changed to 3D by clicking on the check box. You can rotate the 3D view by left clicking on the graph and moving the mouse. When Overlay is checked in 3D view, the wheel of the mouse will adjust the transparency. But if you press Ctrl key and then use the wheel you can move up and down the overlay to have the tip of the peaks right at the DUT level.
- Page 21 Left click and drag to zoom in. Right click and select Reset Zoom to return to the original view or Previous Zoom to return to the previous zoom level. www.yictechnologies.com...
- Page 22 Right click on the graph to display menu. Selecting Open Scan Data Description will give information about the scan. If you select Edit Overlay you can change the Overlay post-scan to, for example, match the emissions with the Gerber of different layers instead of the usual Bottom or Top layer. Or you could correct the position of the Overlay You can select a block of cells on your current spatial scan and then, by clicking on Confirm Selected Cells for New Scan, the Spatial Scan Probes settings have automatically been changed to these highlighted cells.
- Page 23 Nodes All scan types in a project are called nodes. A project is the root node. It can be considered a folder like in Windows directories to store related data. You can add different types of scans and/or notes to a project node. You can rename, copy and paste a node or node settings only.
- Page 24 How to Name a Node? To name a node open the Settings of the node and click on the “Description” tab. When you add a node for the first time, the Settings window opens automatically. If you want to rename a node after you add the node, either right click on the node and select Settings or select the node and then click the Settings button on the task bar.
- Page 25 Preferences: Analyzer and Display Options Preferences present the options for the user’s selection of the Spectrum Analyzer, Display Options and Probe Compensation. To access Preferences, click on. There are two tabs: Analyzer and Display Options. Analyzer Tab The Analyzer Tab lists models and firmware versions of the supported spectrum analyzers. Although the EMScanner software detects the spectrum analyzer automatically, you can override it by manually selecting the spectrum analyzer from the drop-down menu.
- Page 26 Display Options Tab Letters/Numbers: EMScanner columns are indicated by letters and all prior models’ columns are indicated by numbers. Check box Display Letter for Scanner for the software to display columns with letters to match your scanner grid format. Colour Spectrum: Colour options for the spatial display. Probe Compensation: This feature will take the calibration data for each of the 1218 probes and apply it to measured signals.
- Page 27 The tabs in the Project Settings window are covered in the following pages Spectral Scan Tab Enter Start Frequency and Stop Frequency to identify the span of the Spectral Scan to be implemented. RBW (Resolution Bandwidth): It is set by default at 120 kHz and can be reduced to the lowest level allowed by the spectrum analyzer.
- Page 28 Spectral Scan Probes Tab Select and activate the probes under the DUT. You can activate the probes by either a left click on individual cells or by left clicking and dragging the mouse and choosing Select Cells; or clicking on Select All to activate all the probes. Green indicates the activated probes.
- Page 29 Once the file is imported, a window as shown below will open. You need to position the image to match the actual DUT position on the EMScanner. Precise positioning of Gerber or picture is done with Arrow keys. You can resize the JPG file by left clicking and dragging the bottom right corner of the image (red/green/blue coloured corner).
- Page 30 Thumbnail view of the files is listed on the left-hand column. Right click on any image to Select to view it on the grid view or to Delete it from the thumbnail view. Spatial Scan Tab Enter Center Frequency manually or select it from the Peak Marker List. The Center frequency will be set automatically to the chosen frequency RBW (Resolution Bandwidth): It is set by default at 120kHz and can be reduced to the lowest level allowed by the spectrum analyzer.
- Page 31 Scan Data ID: Each spectral scan is indexed automatically and by selecting the ID of a scan you get the Peak Marker List automatically populated with the marked peaks. Interleaved Scan: This is the automated version of the Blind Spot Reduction Node. This scan is meant to overcome the limitations of the probe polarizations.
- Page 32 It is important to activate all of the probes under the DUT to have a complete view of the emissions on the DUT. Amplitude Adjustment Tab You can use an LNA or attenuator with EMScanner to increase or decrease the power level of the signals coming from the scanner and going to the spectrum analyzer.
-
Page 33: Report Generator
Description Tab You can name the node and add a description. Report Generator The Report Generator Node allows the user to generate standard scan reports by exporting the scans into Microsoft Office Word for Windows report template. Report generator needs Microsoft Office Word. To create a report, add Report Generator node to any node. -
Page 34: Scan Types
You can select any scan and any data of that scan to generate the report. Scan Types There are four scan types: • Spectral Scan: measures and displays the maximum amplitude vs. frequency of the magnetic field strength over the scanned area. •... -
Page 35: Spectral Scan
• Compare Spatial: is a quantitative comparison between two Spatial Scans that is generated by subtracting the values of the first scan from the values of the second scan cell by cell. To run a scan: 1. Place the PCB or other device under test (DUT) on the patented scanner 2. - Page 36 5 dB above the average noise floor of the scan. By default, the maximum number of peaks is set to 10. The maximum number peaks that can be measured is 30. 5. Peak Hold: Also known as Max-Hold this is a very important feature as it allows you to run a Spectral Scan continually replacing the peak amplitude with each successive higher measurement.
- Page 37 By limiting the scan area, you reduce the scan time. In the case of Spectral Scans, ensure to at least have 20% to 30% of the probes selected. Amplitude Adjustment Tab You can use an LNA or attenuator with EMScanner to increase or decrease the power level of the signals coming from the scanner and going to the spectrum analyzer.
- Page 38 When running the scan continuously, if Replace Data When Running Continuously in the Spectral Scan settings is selected, the EMScanner software replaces the previous scan data and keeps the last scan data. You will only see the last scan data and display the spectral graph of this data.
- Page 39 Spectral Scan/Spatial Scan A Spectral/Spatial Scan measures the magnetic field strength of radiated electromagnetic emissions from an object as a function of both frequency and position on the PCB. The Spectral/Spatial Scan collects a series of Spatial Scans over the entire frequency range of interest as opposed to a Spatial Scan (which gathers data at single frequency) or a Spectral Scan (which saves only the composite maximum data set over the scan area).
- Page 40 Decreasing the bandwidth will improve the amplitude accuracy and increase the sensitivity; the scan will however take more time to complete. The bandwidth you choose should not be disproportionate to the span. The suggested ratio of Span/RBW should be <10,000 e.g. 10 kHz bandwidth with a 100 MHz span, 100 kHz bandwidth with a 1 GHz span so that the scan can finish in a reasonable time.
- Page 41 It is important to activate all the probes under the DUT to have a complete view of the emissions from the DUT. Amplitude Adjustment Tab You can use an LNA or attenuator with EMScanner to increase or decrease the power level of the signals coming from the scanner and going to the spectrum analyzer.
- Page 42 To run the scan, click. Once the scan is completed, a spectral view and a spatial view will be displayed. By default, view tabs are set to full composite spectral and spatial views for the entire selected frequency. www.yictechnologies.com...
- Page 43 Full Composite Spectral View Composite Spectral looks like a normal Spectral Scan however it is a gateway to archived spatial data for each frequency. You can select single or multiple frequencies on the Composite Spectral view to analyze the location of them on the board. Select Full Composite View under spectral graph and User Composite View under spatial view.
- Page 44 Select multiple frequencies of interest on spectral graph. A red cross will indicate the selection. Spatial graph will update to display the emissions on the board at the selected frequencies. Selected frequencies will be displayed under Freq List (Frequency List) next to the spatial graph.
- Page 45 Delta Marker It displays the amplitude and frequency difference between the current mouse position and the delta marker position in the frequency spectrum viewed. 1. Select either Full Composite View or User Composite View on spectral graph 2. Right click on the spectral view 3.
- Page 46 5. To clear delta markers, right click on the spectral graph and select Clear Selected Delta Marker Full Composite Spatial View Composite Spatial looks like a normal Spatial Scan; it however is a gateway to the archived spectral data for each frequency. You can select single or multiple cells on the Composite Spatial view to analyze their amplitudes and frequencies.
- Page 47 Multi Frequency Marker Right click on the spatial graph and select Multi-Cells Select. Select multiple cells of interest on spatial graph. A cross will indicate the selection. Full/User Composite View tab overlays spectral graph of user selected cells on to the full spectral graph. Spectral graph of the selected cell will be displayed in green on the spectral graph.
- Page 48 User Composite View tab displays the spectral graph of user selected cells. To clear frequency markers, right click on the spatial graph and select Clear Selected Frequency Marker. www.yictechnologies.com...
- Page 49 Description Tab You can name the node and add a description. Click OK. To run the scan, close the settings and run once. Immediately upon running the scan you see a message describing where you need to position the handheld probe. www.yictechnologies.com...
- Page 50 Spectral Overlay A Spectral Overlay is a qualitative comparison of two frequency spectra. It displays two data sets superimposed on each other, which allows you to visually inspect data for differences, i.e. presenting a qualitative view. The Spectral Overlay node allows you to observe and compare two Spectral Scans with the same resolution bandwidth within their common overlapping range overlapping frequency range even though they may have different frequency ranges e.g.: Spectral 1: 10 MHz - 80 MHz and Spectral 2: 30 MHz - 120 MHz.Add Spectral Overlay node to Project node.
- Page 51 Spectral Comparison A Spectral Comparison is a quantitative comparison between two frequency spectra. It is generated by subtracting the values of one spectrum (Test View) from the values of the second spectrum (Reference View) at each frequency. The Compare Spectral node allows you to observe and compare two Spectral Scans with the same resolution bandwidth within their common overlapping range even though they may have different frequency ranges e.g.: Spectral 1: 10 MHz - 80 MHz and Spectral 2: 30 MHz - 120 MHz.
- Page 52 against it by linking them to the test node. Add Spectral Comparison node to Project node. Node settings window automatically opens. After you click OK, Spectral Comparison window opens. Go to the Spectral View. Select the data from the data list that you want to subtract from and click &...
- Page 53 Spectral Blind Spot Reduction For EMScanner & EMScannerR+ The Interleaved Scan is meant to overcome the limitations of the probe polarizations. Each of the 1218 probes on the EMScanner is created by using the vias and traces in a PCB to form a loop.
- Page 54 It was chosen to orient this blind spot at 45° and further to rotate every other row by 90° so that consecutive rows do not have the same blind spots. Because of this arrangement the blind spot can be eliminated by measuring a DUT twice with a small physical shift between scans.
- Page 55 However, if the device has H-field components then every other row will have very low reception sensitivity. The scan results are shown below in the top right. Now if this device is rotated 90° then dead spots will switch to the alternate row. Although the high-level results are as expected, the presence of these low values distracts the eye.
- Page 56 In certain situations, the presence of dead spots can create misleading results. An example of this is shown below. The image on the left shows a diagonal trace with one standard scan. The image on the right shows the same trace after two interleaved scans. Creating a Blind Spot Reduction Node 1.
- Page 57 b. Run the first spatial scan: Place the DUT on the scanner at the desired position. This position should align with the Gerber file overlay. Run the first scan. c. Run the second spatial scan: After the first scan, a message box will pop-up indicating to move the DUT up by exactly 1 row.
- Page 58 Spatial Comparison Spatial Comparison is a quantitative comparison between two Spatial Scans that is generated by subtracting the values of the first scan (Test View) from the values of the second scan (Reference View) cell by cell. The Spatial Comparison node allows you to see the difference between two Spatial Scans at the same frequency.
-
Page 59: Measurement Tips
Select the data from the data list of the Spatial Scan that you want to subtract from and click & drag & drop it on to Test View. Repeat these steps for the second data and drop it on to Reference View. - Page 60 used in Steps 1 and 2. If the peaks have not been measured accurately: 5. Run narrow Spectral Scans so that the frequency error of the spectrum analyzer is less than the bandwidth used for the Spatial Scan; e.g., for a spectrum analyzer with a frequency error of 1% of a scan, a Spectral Scan with a span of less than 10 MHz should be used for a Spatial Scan using a bandwidth of 100 kHz.
- Page 61 c. Set up a separate module or project for your DUT and use the ‘Description’ portion of the setup to quickly and easily identify the purpose of the scan. d. Use the note facility for descriptions and possible explanations for emissions on the DUT. This could come in very handy later when writing a follow up report.
- Page 62 Why does the peak marking process take longer than the estimated time? I am doing Before and After testing. What feature should I use? Can I create Limit Lines for FCC requirements? I want to do a Pass or Fail test. What feature should I use? Why is the result of the Spectral Scan different than the image displayed on the spectrum analyzer? How long does a typical Spectral Scan take?
- Page 63 4. How do I achieve higher frequency accuracy? Frequency accuracy is compromised by the spectrum analyzer frequency measurement accuracy of 1% to 2% of span, unless the spectrum analyzer is equipped with a higher accuracy frequency counter. Therefore, by decreasing the span, the user can increase the frequency accuracy.
- Page 64 9. How sensitive is EMScanner? (* 30 dB LNA) Sensitivity: -130 dBm to 35 dBm (Dependant on spectrum analyzer performance) (* 40 dB LNA; ** 38 dB Power amplifier) 10.I added a low noise amplifier (or an attenuator) between the EMScanner and the spectrum analyzer and forgot to enter the value in the Amplitude Adjustment menu.
- Page 65 the spectrum analyzer. Once you have captured the signal, reduce the frequency span and decrease the RBW if you want to improve the accuracy of the measurements. 12.Why does the peak marking process take longer than the estimated time? EMScanner build a peak list initially during the Spectral Scan. Then it goes back to each peak and zooms in to make a more accurate measurement.
- Page 66 16.Why is the result of the Spectral Scan different than the image displayed on the spectrum analyzer? EMScanner measures the DUT’s emission on the surface of the scanner. The spectrum analyzer records the signal that is coupled by the scanner and transmitted to its RF input. However, there is an insertion loss and probe loss between the DUT and the RF input into the SA.
-
Page 67: Appendix - Error Messages
Appendix – Error Messages If you receive other error messages please contact Y.I.C. Technologies Technical Support: support@yictechnologies.com Appendix – Error Messages Safety and Regulatory Information The Spectrum Analyzer connected with an Ethernet cable to the Personal Computer (PC) must all together comply with CE emission requirements •... - Page 68 • This device was qualified under test conditions that included the use of the specified cables, between system components. To ensure regulatory and safety compliance, use only the provided power and interface cables and install them properly. • Different types of cord sets may be used for connections to the main supply circuit. Use only a main line cord that complies with all applicable device safety requirements of the country of use.
- Page 69 • Connect the equipment into an outlet on a circuit different from that to which the receiver is connected • Consult the dealer or an experienced radio/television technician for help Modifications: Any modifications made to this device that are not approved by Y.I.C. Technologies may void the authority granted to the user by the FCC to operate this equipment.
- Page 70 About Y.I.C. Technologies Y.I.C. Technologies is a world leading developer of FAST magnetic very-near-field measurement technologies and applications, providing real-time test solutions to antenna and PCB designers and verification engineers, without the need for a chamber. The EMScanner is a compact EMC and EMI diagnostic tool.
Need help?
Do you have a question about the EMS8000 and is the answer not in the manual?
Questions and answers