
Related Manuals for Timewave AntennaSmith TZ-900

Summary of Contents for Timewave AntennaSmith TZ-900
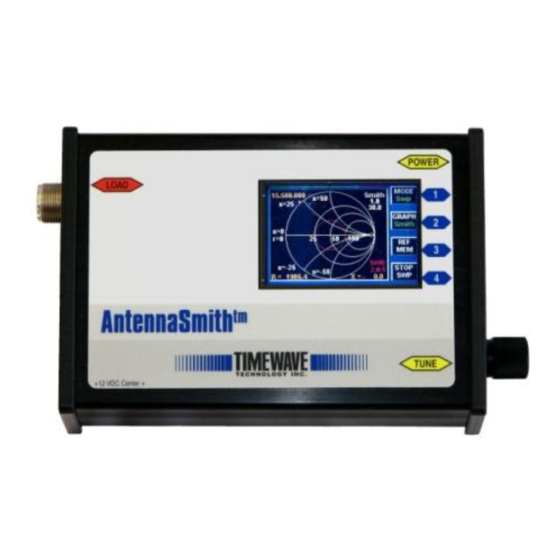
- Page 1 Hardware TZ-900 Manual AntennaSmith™ Revision 1.2 © Copyright 2006, Timewave Technology Inc., All Rights Reserved...
-
Page 3: Table Of Contents
Table of Contents INTRODUCTION ...................... 5 1.1. Power On/Off...................... 5 1.2. Automatic Power Off..................6 1.3. Function Modes ....................6 SWEEP MODE......................7 2.1. SETTING SWEEP START AND STOP FREQUENCIES........ 7 2.1.1. GRAPHICALLY SETTING SWEEP FREQUENCIES ......8 2.1.2. MANUALLY CREATING A NEW SWEEP RANGE......8 2.1.3. - Page 4 Troubleshooting ....................35 Specifications......................36 Timewave......................37 Warranty ....................... 38 Table of Figures ....................39...
-
Page 5: Introduction
1. INTRODUCTION The Timewave TZ900 AntennaSmith™ is a versatile rugged hand-held color graphical antenna analyzer. The analyzer has a number of features required for use in a field application. These features include: A color graphic display visible in bright sunlight as well as at night. -
Page 6: Automatic Power Off
After powering the instrument on, the state of the internal battery charge can be monitored by the battery bar graph indicator. If the indicator shows less than about 10% green (90% red), it is advisable to connect the fast charger to the instrument to initiate a fast charge and also guarantee enough power so the normal measurement accuracy is maintained. -
Page 7: Sweep Mode
2. SWEEP MODE The sweep mode provides the user with the ability to rapidly view selected parameter(s) as the instrument is linearly swept between two chosen frequencies. Two distinctly different graphic types of sweep are provided. When displaying single dependent variable resultants, an X-Y type graph is displayed. Polar graphs are used when two dependent variable resultants are simultaneously displayed. -
Page 8: Graphically Setting Sweep Frequencies
(If it is desired to keep using the current range, simply pushing the knob will restart the sweep.) Once the sweep is stopped two options are available. One option is to graphically set the sweep center frequency and the width of the sweep. -
Page 9: Sweeping A Standard Scan Range
Use the same technique as setting the start sweep frequency to set the end sweep frequency. In this case rapidly rotating the knob to a lower frequency will set the ending sweep frequency to the previously set starting sweep frequency for convenience. Then rotate the knob to higher frequencies to set the ending frequency pushing the knob to change the selected digit. - Page 10 2.2. VARIABLE VS. FREQUENCY TYPE OF GRAPH The sweep starting frequency is shown at the bottom left of the graph while the ending frequency is shown at the bottom right of the graph. Two yellow lines are also shown on the graph.
-
Page 11: Swr
2.2.2. SWR The SWR graph displays SWR from the starting to ending sweep frequency. The y-axis can be varied from 6,11,20,50,and 100 to 1. The default setting is 6:1 with the horizontal bar set at 2:1. This gives the user a quick means to determine the 2:1 SWR bandwidth with frequencies meeting the criteria shown in green and those not meeting the criteria shown as red. -
Page 12: Polar Graph Types
2.3. POLAR GRAPH TYPES Two types of polar graphs are provided. 2.3.1. SMITH CHART The Smith chart conveniently provides the relationship between frequency, SWR, real and imaginary components for the range of swept frequencies. It is important to set the sweep parameters so that the instrument’s algorithms can correctly display the... -
Page 13: Reflection Coefficent (Rho)
2.3.2. REFLECTION COEFFICENT (RHO) The reflection coefficient graph is used to determine the angle and magnitude of the reflection coefficient over the sweep range. The cursor consists of a yellow circle encircling the measured point of the desired frequency and a vector to the origin. - Page 14 be on the opposite side of the complex impedance half plane but with the correct magnitude. To optimize the instrument for proper complex impedance phase sign determination, adjust the sweep frequencies such that one major resonance can be seen on the SWR or Impedance (Z) graph before switching to the Smith or Reflection coefficient graph.
-
Page 15: Memories
2.4. MEMORIES Two banks of ten memories are available. The first bank is the “SCAN MEMORIES”. These are used for storing sweep settings for rapid setup. The second band is the “REFERENCE MEMORIES”. These memories store the complete data set of the results of a scanned antenna or other device being tested. This ”REFERENCE”... -
Page 16: Reference Memory Usage
Push the “Set Start” (#4) button. Select the ending frequency or accept the one shown. Push the “Save Scan” (#3) button. Using the knob or the “^” (#2) or “V” (#3) buttons select the desired scan memory location. Push the “Sel Mem” (#4) button and the data will be saved. The name of the scan memory will be changed to ‘USER n’... - Page 17 “V” (#3) buttons. After selection, pushing the “LOAD REF” (#4) button will display the reference memory graphically. At this point, everything is set up to do a comparison of the reference memory to what is currently connected to the analyzer. To start the comparison, simply push the knob.
- Page 18 When done, push the “SAVE REF” (#2) button to save the name and exit the edit name mode. When done saving a reference memory use the “LOAD REF” (#4) button to escape back to the sweep screen which will display the reference memory graphically.
-
Page 20: Manual Mode
3. MANUAL MODE Data acquisition can be started and stopped using the “ACQ” (#4) button. The backlight can be turned on and off using the “LITE” (#3) button. The knob is used to set the desired frequency. Pushing the knob allows the user to change the Figure 6: Manual Screen tuning step size. -
Page 21: Hi-Resolution Frequency Synthesizer Mode
4. HI-RESOLUTION FREQUENCY SYNTHESIZER MODE Use Knob to Set Frequency Push knob to change Tuning Step (current selected tuning step digit shown in Red) The instrument will output any frequency from 200 kHz to 60 MHz. at 1 Hz. resolution. Output level is approximately 2.84 V p- p into an open circuit and 1.32 V Figure 7: Set Manual Frequency Screen... -
Page 22: System Setup
5. SYSTEM SETUP Figure 8: Setup Screen 5.1. Settings Graphics parameters and system settings can be set on the “Settings” Screen. This screen is accessed by simultaneously pushing buttons (#1 and #3). Use the “Back” (#2) or “Next” (#3) buttons to select the parameter to change. Change the parameter using the knob. -
Page 23: Smith Swr
5.1.2. Smith SWR The Smith SWR setting determines the size of the SWR circle on the Smith Chart. 5.1.3. APO Settings The automatic power off function can be set to “Off, 5 minutes, 10 minutes (default), and 30 minutes”. 5.1.4. Level Settings Two separate user level settings are provided to accommodate different operating scenarios when using the AntennaSmith™. -
Page 24: Power Supply
6. POWER SUPPLY The analyzer is power by 4 internal Ni-MH 2500 mAh AA penlight cells. These cells are fast charged from an external wall wart or other 12 Volt source. Along the top of the display is a thin bar graph that always displays the current state of the batteries. -
Page 25: Host Communications
7. HOST COMMUNICATIONS The AntennaSmith™ uses a USB 2.0 and/or a RS232 connection to communicate with a computer. It is possible to upload and download reference and scan memories as well as control the instrument and upload realtime measurement data. After the supplied USB 2.0 drivers are installed, the device appears as a serial port running at 115 kbps, no parity and one stop bit to the host computer. -
Page 26: Special Service And Setup Modes
8. SPECIAL SERVICE AND SETUP MODES 8.1. Restoring default settings Hold the third button (#3) in when turning on instrument and wait until a pure blue screen appears with the message: ‘FACTORY MEMORY AND FREQUENCY CAL DEFAULTS RESET!’ WARNING! This will reset the all the user settings, including timeouts. Note: All user set scan memories will be overwritten with the standard factory ham band memories. -
Page 27: Application Notes
9. APPLICATION NOTES 9.1. Transmission Lines Transmission lines can easily be characterized by displaying the swept impedance of the un-terminated (open) line. (Use the Impedance (Z) sweeping graph mode). It may be necessary to change the impedance (Z) graphic scale to 1000 if the peak of the impedance cannot be seen on the current range chosen. -
Page 28: Antenna Measurements On Coax
Cut the line to a length ten per-cent longer than the calculated length. By watching the graphic impedance sweep, trim the line until the first half-wave peak is exactly on the frequency of interest. Be careful and not overshoot this point as you cannot go back. - Page 29 input on the oscilloscope. Adjust the Oscilloscope X and Y gain controls for the best display on the oscilloscope screen. Set the TZ-900 sweep start and stop frequencies for the desired sweep span. Useful accessories include a long- persistence or digital storage oscilloscope, a 50-ohm variable attenuator and a RF logarithmic detector.
-
Page 30: Quick Tricks
10. QUICK TRICKS 10.1. Rapidly Analyzing an Antenna As the TZ900 is shipped, it is factory set to User Level 1.0. This allows rapid measurement of any unknown antenna. To quickly get all of the parameters of any desired HF antenna: Briefly short the feedline or other connection of the antenna to remove any possible static charge buildup and then connect it to the TZ900. -
Page 31: Rapidly Zooming To A Section Of A Sweep
10.2. Rapidly zooming to a section of a sweep 1. Stop sweep by pushing “STOP SWP” (#4) button. 2. Using knob put cursor over desired center frequency. 3. Push “SET Center” (#3) button. 4. Using knob set desired sweep width as determined by blue cursors. 5. -
Page 32: Rapidly Setting A Scan Of 1.000.000 To 30.000.000
10.4. Rapidly setting a scan of 1.000.000 to 30.000.000 It is very convenient to start a sweep of 1.000.000 to 30.000.000 to quickly determine interesting impedance or SWR points that can then be quickly analyzed using the Set Center, Set Width method discussed in Section 2.1.1. When the instrument is powered on and is set to User Level 1.0, sweeping automatically starts over this range. -
Page 33: Antennasmith™ Connectors
11. AntennaSmith™ Connectors Data Control Connector Type: 8 pin mini-DIN 1. Reserved 2. Sweep Ramp Output 0 – 2.4 V. Do not make any 3. RX RS-232 4. Return (ground) connections to reserved 5. TX RS-232 pins! 6. Reserved 7. Reserved 8. -
Page 34: Additional Reading
12. Additional Reading ARRL Antenna Book 20 Edition (R.Dean Straw Ed) ISBN: 0-87259-904-3 Antenna Impedance Matching (Wilfred N. Cohen) First Edition ISBN: 0-87259-220-0 Mysteries of the Smith Chart -- Transmission Lines, Impedance Matching and Little Known Facts (Stephen D Stearns-Pacificon 2001) REFLECTIONS II Transmission Lines and Antennas (M. -
Page 35: Troubleshooting
Reset the TZ-900. o Make sure the Serial is plugged in. o Exit and restart the program. If there is still a problem, contact Timewave Technical Support. Timewave Technical Support 1025 Selby Ave, Suite 101 St. Paul, MN 55104 (651) 489-5080 support@timewave.com... -
Page 36: Specifications
14. Specifications Processors • 50 MHz CPU Memory • Scan range memories: 10 (user settable 8 character names, start sweep frequency, and end sweep frequency -- stored in flash.) • Reference memories: 10 (user settable 8 character names, start sweep frequency, and end sweep frequency -- stored in flash.) Input/Output •... -
Page 37: Timewave
Timewave’s extensive signal processing technology with its communication technology to create innovative networked and remote access solutions. This product is the AntennaSmith™. Timewave was established in 1984 in St. Paul, Minnesota. All Timewave products are manufactured in the U.S.A. Timewave Technology Inc. -
Page 38: Warranty
Timewave Technology Inc. products carry the following warranty: Timewave hardware products are warranted against defects in materials and workmanship. If Timewave receives notice of such defects during the warranty period, Timewave shall, at its option, either repair or replace hardware products which prove to be defective. -
Page 39: Table Of Figures
17. Table of Figures Figure 2: Smith Graph ...................... 12 Figure 3: Rho Graph ......................13 Figure 4: Scan Memory ....................15 Figure 5: Scan to be saved as a Reference................ 17 Figure 6: Manual Screen....................20 Figure 7: Set Manual Frequency Screen................21 Figure 8: Setup Screen ......................
Need help?
Do you have a question about the AntennaSmith TZ-900 and is the answer not in the manual?
Questions and answers