Table of Contents
Advertisement
Quick Links
Advertisement
Table of Contents

Related Manuals for TechnoAP APU101


Summary of Contents for TechnoAP APU101
- Page 1 Digital Spectrometer APU101 Manual Version 1. 2. 0 November 2021 TechnoAP Co., Ltd. 2976-15 Mawatari, Hitachinaka-shi, Ibaraki, 312-0012, JAPAN TEL: +81-29-350-8011 FAX: +81-29-352-9013 URL: http://www.techno-ap.com E-mail: info@techno-ap.com...
-
Page 2: Table Of Contents
Manual APU101 - Table of contents - 1. Overview ...................................... 5 2. Specifications ....................................6 3. Appearance ....................................8 4. Setup ......................................11 4.1. Application installation ..............................11 4.2. High-voltage power supply polarity check and change method ................. 11 4.3. Cable connection ................................12 4.4.... - Page 3 Manual APU101 10.4. Change IP address ............................... 50 11. Gauss fit ....................................51 11.1. Startup screen ........................... 51 11.2. On-line ............................53 11.3. Off-line ............................54 11.4. Notes ............................55 11.5. End............................. 55 12. Peak search ................................... 56 12.1. Startup screen ........................... 56 12.2....
- Page 4 Manual APU101 Safety Precautions / Disclaimer Thank you for purchasing the product of Techno AP Co., Ltd. (hereinafter referred to as "our company"). Before using the product, please read this "Safety Precautions / Disclaimer" and be sure to observe the contents to ensure correct use.
-
Page 5: 1. Overview
Manual APU101 1. Overview Digital spectrometer APU101 (hereinafter referred to as this device) is a digital spectrometer that integrates a high- voltage power supply, preamplifier power supply, and MCA (multi-channel analyzer) into one. Since it is a multi-channel analyzer (MCA) equipped with a real-time digital signal processing function (DSP), waveform shaping processing by an analog circuit is not required, and a very high-speed A / D converter is used to directly digitalize the signal from the preamplifier. -
Page 6: 2. Specifications
Manual APU101 2. Specifications Analog Input ・ Number of channels 1 CH ・ Input range ±1 V 1 kΩ ・ Input impedence ・ Coarse gain ×1, ×4, ×10, ×20 Set the value from the application ・ Sampling frequency 100 MHz ・... - Page 7 Manual APU101 ・ Connector for preamplifier output signal input ・ SHV connector for high voltage power output ・ LEMO compatible connector for high voltage power shutdown High-voltage power supply * If the specifications are changed, the maximum output voltage and current value may differ.
-
Page 8: 3. Appearance
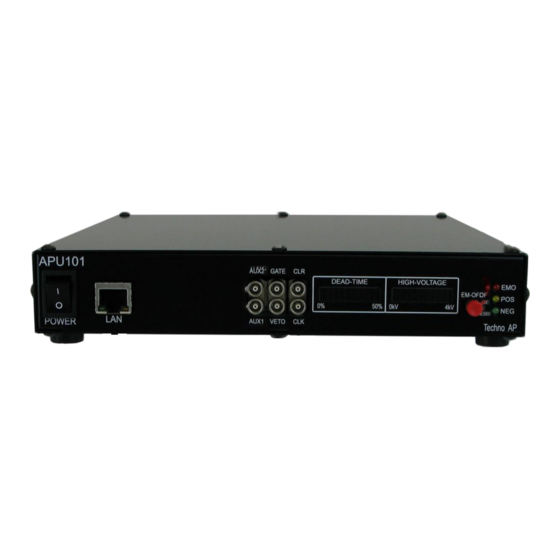
Manual APU101 3. Appearance Image 1 APU101 Front EMO (red) Lights during emergency. POS (orange) Lights when the HV is positive. NEG (green) Lights when the HV is negative. If both POS and NEG are off, it is in the high-Z state. It blinks long when stepping up, blinks shortly when stepping down, and lights up when the set voltage is reached. - Page 9 Manual APU101 RJ45 connector for connecting an Ethernet cable. The factory IP address is 192.168.10.128. POWER This is the main power switch of this device. The "O" side is OFF and the "I" side is ON. * Do not switch during high voltage power output. It may cause a malfunction of this device and connected devices.
- Page 10 Manual APU101 Introduction of conversion adapters and conversion cables LEMO EPL.00.250.NTN and the same shape are used for the signal input connector to this device. When using a BNC connector cable, it is possible to connect to this device by using the following conversion adapter.
-
Page 11: 4. Setup
Execute "setup.exe" in the Application or Installer folder on the attached CD-ROM. Proceed with the installation interactively. The default installation destination is "C: ¥ TechnoAP". In this folder, the executable file ".exe" of this application and the configuration file ".ini" in which the setting values are saved are installed. -
Page 12: 4.3. Cable Connection
Manual APU101 according to the specifications of the detector from this application by the following procedure. For details, refer to the explanation of the HV tab below. In "HV output polarity" in "advanced tab" in "HV tab", select the same polarity as the detector from the pull-down menu "HV output polarity"... -
Page 13: 4.4. Network Setup
Manual APU101 Connect the POWER output terminal (D-sub 9-pin connector) on the back panel and the power connector for the preamplifier on the detector side with a cable. Connect the INPUT input terminal (BNC connector) on the back panel and the preamplifier output signal on the detector side with a cable. - Page 14 Manual APU101 > ping 192.168.10.128 Figure 3 Communication connection confirmation, ping command execution Start this application. Search for and launch APP101 from the shortcut icon APP101 or Windows button on your desktop. If an error message indicating that the connection to this device failed is displayed when you start this application, refer to the troubleshooting below.
-
Page 15: 5. Application Screen
Manual APU101 5. Application screen 5.1. Startup screen Figure 4 Startup screen * Images may differ depending on option configuration and updates Menu File - open config Read the configuration file File - open histogram Read histogram data file File - save config... - Page 16 Manual APU101 Settings related to CH in the DSP of this device config Settings related to the measurement operation and measurement time of this device ROI, “Region Of Interest” and energy calibration settings histogram wave Waveform display in wave mode, settings related to display...
- Page 17 Manual APU101 ROI section peak (ch) Maximum count ch centroid (ch) Median value (ch) calculated from the sum of counts peak (count) Maximum count gross (count) Sum of counts between ROIs gross (cps) Sum of counts between ROIs per second...
-
Page 18: 5.2. Ch Tab
Manual APU101 5.2. CH tab Figure 5 CH tab CH availability analog coarse gain Analog course gain. Select from 1x, 4x, 10x, and 20x. The captured preamplifier output signal is amplified internally. ADC gain ADC gain (channel). Select from 8192, 4096, 2048, 1024, 512, 256 channels (ch). - Page 19 Manual APU101 The setting range is 0 to 8191. The default setting is 50 digits. Based on the captured preamplifier output signal, the FAST filter waveform that has been differentiated and integrated in the timing filter amplifier circuit is generated.
- Page 20 Manual APU101 rise time flattop time Peaking time pole zero Figure 6 SLOW (trapezoidal) filter * The figure on the right is an example where the SLOW filter has an undershoot and pole zero is not suitable. In this case, lowering the slow pole zero value below the current setting will raise the undershoot to the top.
- Page 21 Manual APU101 Figure 7 Setting Example of LLD and ULD * The above figure is an example of setting LLD to 955 and ULD to 1045. The part smaller than LLD and the part larger than ULD are not measured.
- Page 22 Manual APU101 polarity The polarity of the input preamplifier output signal. “pos” is positive, “neg” is negative. digital coarse gain Digitally select the gain from 1x, 2x, 4x, 8x, 16x, 32x, 64x, and 128x. For trapezoidal filters, the integrating circuit is calculated by a multiply-accumulate operation.
- Page 23 Manual APU101 CFD, Constant-Fraction-Disicriminator Timing For the different preamp waveforms, a and b in the figure below, the following waveforms c, d and e, f and g, h are generated. Waveform c, d: Waveforms a and b multiplied by CFD function and inverted...
- Page 24 Manual APU101 CFD function Magnification for reducing the original waveform for CFD calculation. Choose from 0.125, 0.25, 0.375, 0.5, 0.625, 0.75, 0.875. The default is 0.25 to 0.625 times. CFD delay Select the time to delay the original waveform for CFD calculation from 10, 20, 30, 40, 50, 60, 70, 80 ns.
- Page 25 Manual APU101 DAC monitor type Select the waveform of the DAC output. The waveform signal of the selected type in the waveform processed inside the DSP is output from the MONI pin. By viewing this signal on an oscilloscope, you can check the processing status inside the DSP.
-
Page 26: 5.3. Config Tab
Manual APU101 5.3. config tab Figure 11 config tab DSP section mode Data processing selection histogram Histogram mode stores the peak value of the preamplifier signal in a maximum of 8192ch and creates a histogram. list This mode uses the time stamp, peak value, and CH number of the preamplifier signal as one event data, and continuously transfers the data to the PC. - Page 27 Manual APU101 list save Set whether to save the list data to a file. Valid only when list mode is selected list file path Set the absolute path of the list data file. Can be set without extension. list file number Set the starting number of the number that cannot be used in the list data file.
-
Page 28: 5.4. Histogram Tab
Manual APU101 5.4. histogram tab Figure 12 histogram tab Graph Histogram graph. When history is selected in mode in the config tab, the energy histogram is displayed during measurement. Legend checkbox Select whether to display the histogram for each channel on the graph. - Page 29 Manual APU101 eV unit display. By two-point calibration of two types of peaks (center value) and energy value in one histogram, the slope a and intercept b of the linear function y = ax + b are calculated and set on the X axis so that ch becomes eV. increase. The unit such as FWHM of FWTM of ROI is eV.
- Page 30 Manual APU101 Cursor movement tool. When setting the ROI, you can move the cursor on the graph by dragging it with the mouse. Zoom. Click to select and execute the following 6 types of zoom-in and zoom-out. Phan tool. Grab the plot and move on the graph...
-
Page 31: 5.5. Wave Tab
Manual APU101 5.5. wave tab Figure 14 wave tab Graph Histogram graph. When histogram is selected in mode in the config tab, the waveform processed by the signal during measurement is displayed. Set whether to display the waveform. type Select the type of waveform to display. - Page 32 Manual APU101 position Offset score setting to the triggered point. Set this when you need waveform data before the trigger is applied. edge Select the rising edge or falling edge as the trigger acquisition timing. Falling edge Rising edge TechnoAP Co., Ltd.
-
Page 33: 5.6. Hv Tab
Manual APU101 5.6. HV tab Figure 15 HV tab, HV out tab HV OFF High voltage output OFF button. After clicking, the voltage is stepped down at the sweep voltage (V / min.) rate. HV out tab section output enable High voltage output ON / OFF. - Page 34 Manual APU101 bias shutdown LED Lights when the detector goes into a bias shutdown state. Immediately when lit, the high-voltage output is turned off at the step-down rate. bias-shutdown volt(V) The monitor voltage of the signal input to the HV-STHD terminal.
- Page 35 Manual APU101 advanced tab section HV output polarity Select from positive, negative and high-Z. set polarity paramter The above HV output polarity setting value is sent to this device. After fully checking the polarity of the HV of the detector, perform the following procedure.
-
Page 36: 6. Initial Setting
Manual APU101 6. Initial setting 6.1. Preamplifier output signal confirmation Connect the preamplifier output signal to the oscilloscope and check the peak value (mV) and polarity. In the case of a transistor reset type preamplifier, if it goes up to the right, it is positive, and if it goes down to the right, it is negative. -
Page 37: 6.4. Analog Course Gain And Analog Pole Zero Adjustment Of Preamplifier Output Signal
Manual APU101 Figure 18 Example of polarity setting in CH tab Click the menu “config” and configure all settings. 6.4. Analog course gain and analog pole zero adjustment of preamplifier output signal The ultra-low noise, high-speed programmable gain amplifier can amplify the signal from the preamplifier, which requires a fast rise and low noise, with high accuracy. - Page 38 Manual APU101 Gain is small Figure 19 Before adjustment Figure 20 After adjustment Change the setting of analog pole zero and adjust the pole zero so that the falling part is flat while switching the vertical and horizontal ranges of the oscilloscope.
-
Page 39: 6.5. Fast Filter Settings
Manual APU101 6.5. FAST filter settings This device has a FAST filter for obtaining time information at the time of radiation detection and a SLOW filter for acquiring energy (wave height). First, set the FAST filter-related settings. The settings have the same characteristics as a typical timing filter amplifier. -
Page 40: 6.6. Slow Filter Settings
Manual APU101 Set the signal detection threshold of the FAST filter with the fast trigger threshold. The Leading-Edge-Timing (LET) is time-stamped when this threshold is exceeded. It is also used as a threshold for baseline restorer and pileup rejector. Set this value to the lowest possible value that can be discriminated from noise when connected to a detector. The default setting is 25. -
Page 41: 6.7. Slow Threshold Setting
Manual APU101 Figure 26 slow pole zero, LEFT: Undershoot, before adjustment, RIGHT: After adjustment 6.7. SLOW threshold setting First, input a somewhat large value (about 100) and observe the throughput rate (cps). Find a value that gradually reduces the slow trigger threshold and increases the throughput rate (cps). -
Page 42: 6.8. Signal Processing By External Input Terminal
Manual APU101 6.8. Signal processing by external input terminal The following signal processing is possible by using the LEMO connectors GATE, VETO, CLR, and CLK on the front panel. An LVTTL or TTL level signal is required for use. The allowable High signal level is 2 to 5V, but since it is optimized with a 3.3V signal, it is recommended to use it at 3.3V or less. -
Page 43: 6.9. Calculation Method Of Half Width At Half Maximum (Fwhm) Full Width At Half Maximum
Manual APU101 6.9. Calculation method of half width at half maximum (FWHM) Full Width at Half Maximum The FWHM (Full Width at Half Maximum) in the ROI section is calculated as follows. Figure 28 FWHM calculation Find the maximum fmax between ROI Start and ROI end in the histogram. -
Page 44: 7. Measurement
Manual APU101 7. Measurement This chapter is for the purpose of explaining the measurement unit, and the procedure assumes that the power supply, high voltage, etc. have already been applied to the detector and preamplifier, and the signal from the preamplifier is input to the INPUT terminal. -
Page 45: 7.3. Measurement Stops
Manual APU101 wave mode ・ Wave is displayed in mode. ・ Waveform information is displayed on the wave tab. list mode ・ Select list in mode in the config tab, and the following will be executed when the measurement starts. -
Page 46: 9. File
Manual APU101 9. File 9.1. Histogram data file File format: CSV text format, comma-separated File name: any Composition: It consists of a Header part, a Calculation part, a Status part, and a Data part. [Header] Memo Memo Measurement mode Measurement mode. Real Time or Live Time Measurement time Measureent time. - Page 47 Manual APU101 Baseline select Unsed * CH is up to here Operation mode Measurement mode Measurement time Clock select WAVE sampling select [Calculation] * Saved for each ROI below ROI_ch Input channel number subject to ROI ROI_start ROI start position (ch)
-
Page 48: 9.2. List Date File
Manual APU101 9.2. List date file File format: Binary, big endian format File name: File path set in list file path in the config tab, with file number added to 0 and 6 digits Example 1: When "D: ¥ data ¥ 123456.bin" is set in the list file path and "1" is set in the number. -
Page 49: 10. Troubleshooting
Manual APU101 10. Troubleshooting 10.1. Connection error occurs If you get a connection error error at startup or in the menu config, the network may not be connected properly. In this case, check the followings Check if the settings in the configuration file config.ini before booting meet the following conditions. -
Page 50: 10.3. Histogram Is Not Displayed
Manual APU101 10.3. Histogram is not displayed If you see nothing in the graph on the histogram tab when you run Start on the menu bar, check the following: Set CH1 to ON by plot ON in the histogram tab. -
Page 51: 11. Gauss Fit
Manual APU101 11. Gauss fit This software has a peak analysis function by Gauss fitting. By opening the dedicated screen, you can calculate the half- value width, etc. by dividing the peaks with a small number of counts and the peaks that overlap with each other during measurement or for the histogram data in the data file. - Page 52 Manual APU101 Setting section data source Select the data to be analyzed online Targets the data being measured on the main screen offline Targets the data in the pre-read histogram data file or Gauss fit data file target CH Analysis target CH setting It is the number of data points to be analyzed to be displayed in the graph of gauss fit.
-
Page 53: 11.2. On-Line
Manual APU101 11.2. On-line For the histogram acquired during measurement, perform Gaussian fit analysis for the specified peak according to the following procedure. 1. Select data source, “online.” 2. Start measurement in histogram mode. The histogram during measurement is displayed in the histogram graph. -
Page 54: 11.3. Off-Line
Manual APU101 11.3. Off-line For the histogram obtained by reading the histogram data file or the Gauss fit data file, perform Gauss fit analysis for the specified peak by the following procedure. 1. Select data source, “offline.” 2. Click open gauss fit file or open histogram file from file in the menu. A file selection dialog is displayed. Select the data file to be read and open it. -
Page 55: 11.4. Notes
Manual APU101 11.4. Notes Please note the following points to operate normally on the Gauss fit screen. 1. When setting the number of fit to two or more, set fit1 and fit2 in this order from the left in the gauss fit graph. If fit1 is not working properly, the following fit2 and fit3 will also be hidden. -
Page 56: 12. Peak Search
Manual APU101 12. Peak search This software has a function to automatically detect peaks and perform peak analysis. You can open the dedicated screen and automatically detect the peak and calculate the half width etc. for the histogram data of the data file during measurement. - Page 57 Manual APU101 Setting section data source Select the data to be analyzed online Targets the data being measured on the main screen offline Targets the data in the pre-read histogram data file or Gauss fit data file target CH Analysis target CH setting Selection of peak detection threshold.
-
Page 58: 12.2. On-Line
Manual APU101 12.2. On-line Perform peak search analysis using the following procedure for the histogram acquired during measurement. 1. Select data source online 2. Start measurement in histogram mode. The histogram being measured is displayed in the peak search graph. -
Page 59: 12.3. Off-Line
Manual APU101 12.3. Off-line Perform peak search analysis according to the following procedure for the histogram obtained by reading the histogram data file or peak search data file. 1. Select data source as offline 2. Click open peak search file or open histogram file from file on the menu bar. A file selection dialog is displayed. Select the data file to be read and open it. -
Page 60: 12.5. End
Manual APU101 12.5. End To close this screen, click close from File on the menu bar. TechnoAP Co., Ltd. - Page 61 Manual APU101 TechnoAP Co., Ltd. 2976-15 Mawatari, Hitachinaka-shi, Ibaraki, 312-0012, JAPAN TEL: +81-29-350-8011 FAX: +81-29-352-9013 URL: http://www.techno-ap.com E-mail: info@techno-ap.com TechnoAP Co., Ltd.
Need help?
Do you have a question about the APU101 and is the answer not in the manual?
Questions and answers