
Summary of Contents for INDUSTRY DAVE II
- Page 1 Instruction manual DAVE II a compact system for recording data from pulse and analog meters offering a built-in web interface...
-
Page 2: Table Of Contents
Contents: 1. Installing and dimensions .............................3 1.1 Installing and connecting power supply ....................3 1.2 Setting PDImp address ..........................3 2. Product description ...............................4 2.1 Panel description ............................4 2.2 LED combination on the front panel ....................4 3. System configuration ............................5 3.1 System tab ..............................5 3.2 Network tab ..............................7 3.3 Modem tab ..............................8 3.4 User management tab ..........................9... -
Page 3: Installing And Dimensions
1. Installing and dimensions 1.1 Installing and connecting power supply 1.2 Setting PDImp address AThe address is set by attaching jumpers into appropriate places. An example describing how to set addresses 2 and 13 is given in the figure. -
Page 4: Product Description
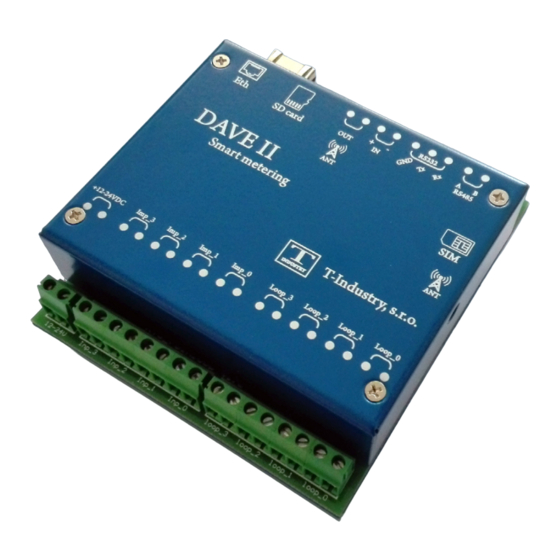
2. Product description DAVE II is a compact system designed to collect readings from meters with impulse output. The system is comprised of one main controller integrated 4 impulse converters and 4 analog con- verter with the possibility of connecting other several three-channel pulse converters. The con- troller is connected to the pulse converters by a two-wire RS485 bus. -
Page 5: System Configuration
3. System configuration The device can be completely configured via a web browser (Firefox, Chrome etc.). The address (URL) in the browser should be set to the IP address of the device. Initially, the main screen appears: After clicking “System configuration”, login is required (only users with administrative privileges will be granted access, see Section 3.1): default admin login: login: admin... - Page 6 The System tab is used for configuring basic system settings. Hostname (1) - identification name of the device (starts with a letter, may only contains lower- and uppercase letters or digits) Support VPN connection (2)- Allows to enable/disable a VPN connection. If enabled, a techni - cian can access the device remotely.
-
Page 7: Network Tab
3.2 Network tab This tab provides network management. Use DHCP: the IP address is obtained from a DHCP server Click Save to save your changes or Revert to return to the original settings Do not use DHCP: allows to manually set the IP address of the device... -
Page 8: Modem Tab
Addition of an IP address (1): 1. Click the area (1) 2. Enter the IP address (the format is ip_address/mask, e.g. 192.168.0.113/24) 3. Click Add It is possible to add several IP addresses; the device will listen on each of them. Addition of a network gate (2): analogous to the addition of an IP address Addition of a DNS server address (3): analogous to the addition of an IP address Click Save to save your changes or Revert to return to the original settings. -
Page 9: User Management Tab
3.4 User management tab This tab allows management of user accounts: creation, deletion and edits 3.4.1 Creating a new user account 1. Click “Add” 2. A dialog opens: Fill in all the fields Name: account name Full name: full name of the user Privileged: check if the account should have administrative privileges Password: password Retype password:... -
Page 10: Changing Details Of A User Account
3.4.2 Changing details of a user account 1. Choose the user account you would like to edit 2. Click “Edit” 3. Make changes as needed Full name: user name Privileged: true/false Password: user password Retype password: retype user password Name - It is not possible to change the name of the account; create a new account instead 4. -
Page 11: Deleting A User Account
3.4.3 Deleting a user account 1. Choose the user account you would like to delete 2. Click “Delete” 5. Click “Commit changes” if you really want to delete the account 6. Click “Revert changes” if you do not want to delete the account 3.5 DDNS tab Dynamic DNS (DDNS) is a system allowing real-time changes of information stored on a DNS server. -
Page 12: Journal Tab
3.6 Journal tab This tab provides access to system logging files process filter show the log only from the last booting 3.7 Maintenance tab firmware version restart the device restart the app 3.7.1 Updating firmware, Linux kernel, Restore configuration 1. connect to the IP address of the device via a web browser 2. -
Page 13: Application Setup
4. Configuration setup The Configuration setup allows to configure converters and related parameters. A Dave II module integrates 4 impulse converters (PDImp; used with meters with impulse output) and 4 analog converters (PDLoop; used with meters with 4 to 20 mA current loop output). It is possible to con- nect additional external PDImp and PDLoop converters over an RS-485 bus. -
Page 14: Adding A New Pdimp Module
4.1 Adding a new PDImp module 1. Click on the folder icon 2. Click “Add” 3. Click on name PDImp485 (system) - external PDImp converter (3 impulse channels) PDImpInternal (system)- integrated PDImp converter (4 impulse channels) 4. Choose an external or internal converter 5. -
Page 15: Adding A New Channel To A Pdimp Module
4.1.1 Adding a new channel to a PDImp module (pulse meter converter) 1. Click on the name of the module for which you would like to add a channel. 2. Click on the item in the list 3. Channel configuration dialog opens Description: the description of the channel, say, “impulzný... -
Page 16: Adding A Plot Of Measured Values To A Pdimp Channel
Consumption readout: Last good consumption readout: the last value of consumption with good quality Description: Number of decimal places to display [0 - 20]: 4.1.2 Adding a plot of measured values to a PDImp channel The collected meter readings can be represented graphically. There are two types of plots to choose from: consumption plot and current value plot. - Page 17 Fill in the description of the plot and the number of decimal places to display. For a current value plot, you also have to fill in the engineering unit and the corresponding conversion factor. If unsure about this, click “Help” Let the engineering unit for consumption be cubic meter [m3].
-
Page 18: Adding A New Pdloop Module
4.2 Adding a new PDLoop module 1. Click on the folder icon 2. Click “Add” 3. Select “PDLoop485” from the list that opens PDLoop485 (system) - externý PDLoop converter (3 channels) PDLoopInternal (system)- integrated PDLoop converter (4 channels) 4. Choose an external or internal converter 5. -
Page 19: Adding A New Channel To A Pdloop Module
4.2.1 Adding a new channel to a PDLoop module (analog meter converter 4-20 mA) 1. Click on the name of the module for which you would like to add a channel 2. Click on the item in the list 3. A channel configuration dialog opens Description: the description of the channel, say, “flow”... -
Page 20: Adding A Plot Of Measured Values To A Pdloop Channel
4.2.2 Adding a plot of measured values to a PDLoop channel 1. Click on the name of the channel for which you want to add a plot 2. Click “Add” 3. Select the type of plot 4. A configuration dialog opens Fill in the description of the plot and the number of decimal places to display. -
Page 21: Deleting Channels, Plots Or Modules
4.3 Deleting channels, plots or modules The system allows to remove all modules, channels and plots that are no longer needed. The de- letion procedure is the same for all element types. 1. Click the name of the element (module, channel, or plot) to remove 2. - Page 22 4a. If you have chosen “Purge”, you have to check the checkbox in the dialog that appears. 5a. Then click “Run!” 4b. If you have chosen “Preload”, a dialog appears. Enter the initial value (in engineering units of this channel). 5b.
-
Page 23: Displays
5. Displays After choosing “Dave” in the main screen, a table providing an overview of modules appears. System (1): description of the module, see Section 4.1 Channel (2): description of the channel, see Section 4.1.1 Display (3): two possible values for a channel here: the first one is the consumption value, the second one the last consumption value with good quality Value (4): the value for the display together with time of the measurement green colour indicates valid values (good quality), red colour indicates invalid values (bad quality) -
Page 24: Plots
6. Plots The choice “Plots” in the main screen allows to display the created plots Plots (1): the list of all available plots (created according to Sections 4.1.2 and 4.2.2) Tools (2): gives an option to add a horizontal line to the plot Time range (3): determines the time range (the horizontal axis in the plot) Read mode(4): determines how to select data from the archive Delta: the plot will contain all collected data (see Sections 4.1.1 and 4.2.1 for... -
Page 25: Displaying A Plot
6.1 Displaying a plot 1. Select a plot from the list that should be displayed 2. Choose the time range 3. Set resampling options (“Delta” for no resampling, “Resample” to resample with a given period) 4. Click “Apply” 5. The selected plot will be displayed 6. - Page 26 +421 69 200 1178 T-Industry, s.r.o. mob.: +421907 712 955 Hoštáky 910/49 web: www.tind.sk 907 01 Myjava emial: tind@tind.sk Slovenská Republika...
Need help?
Do you have a question about the DAVE II and is the answer not in the manual?
Questions and answers