Table of Contents
Advertisement
Quick Links
Advertisement
Table of Contents
Troubleshooting

Subscribe to Our Youtube Channel
Summary of Contents for Ceyear 3943B
- Page 1 Document No.: AV2.602.1000SSCN Version No. Technical status identification: Confidential: Non-confidential 3943B Monitoring Receiver Operations Manual Prepared by: Reviewed by: Standardized by: Countersigned by: Approved by: Ceyear Technologies Co., Ltd. April 2021...
- Page 2 3943B Monitoring Receiver User's Manual Ceyear Technologies Co., Ltd.
- Page 3 Foreword product after maintenance. Thanks for choosing the 3943B Product Quality Certification monitoring receiver developed This product is guaranteed to produced meet the specifications in this Ceyear Technologies Co., Ltd. manual from date We will spare no efforts to meet shipment.
-
Page 5: Table Of Contents
Contents Operations Manual ...................... I 1. Manual Navigation ....................1 1.1. About the Manual ........................1 1.2 Related Documents ........................2 2 Overview ........................3 2.1 Product Overview ........................3 2.2 Safe operating manual ....................... 3 2.2.1 Safety Marks ............................. 3 2.2.2 Operation Status and Locations ...................... - Page 6 4.1 Function operation guide ......................30 4.1.1 Fixed frequency receiving ......................30 4.1.2 Panoramic scan ..........................34 4.1.3 Frequency scan ..........................36 4.1.4 List scan ............................38 5. Menus ........................42 5.1 General Menu ..........................42 5.1.1 Scan menu ............................42 5.1.2 Setting menu ...........................
- Page 7 6.3.2 Initialize the controller ........................89 6.3.3 Initialize the instrument ......................89 6.3.4 Send Setting Command ......................89 6.3.5 Read the State of Measuring Instrument ................90 6.3.6 Read the frequency scale ......................90 6.4 I/O library ............................ 90 6.4.1 Overview of I/O Library ......................90 6.4.2 Installation and Configuration of I/O Library ................
- Page 8 Trace ..............................142 Frequency scale ..........................142 Differential frequency scale ....................... 142 Filter selectivity ............................ 142 LO ................................142 Spurious response ..........................143 Dynamic range ............................ 143 FFT ................................ 143 Resolution ............................144 Amplitude accuracy ..........................144 Intermodulation............................ 144 Detector Mode ............................. 144 Drift ................................
-
Page 9: Manual Navigation
Related Documents………………………………………………………………………………2 1.1. About the Manual In the manual, basic functions and operating methods of the 3943B monitoring receiver are introduced, including instrument characteristics, basic operating methods, measurement configuration operating manual, menus, remote control, maintenance, specifications and test methods to help you rapidly get familiar with and understand key points of the instrument operation method and use. -
Page 10: Related Documents
1. Manual Navigation 1.2 Related Documents terminology, remote control commands index, error messages index, etc. 1.2 Related Documents The documents related to 3943B monitoring receiver include: Quick Start User's Manual Program Control Manual Quick Start This manual introduces the instrument configuration and the basic measurement method, with the aim to enable users to quickly understand the characteristics of the instrument, master the basic settings and basic local and remote control operation methods. -
Page 11: Overview
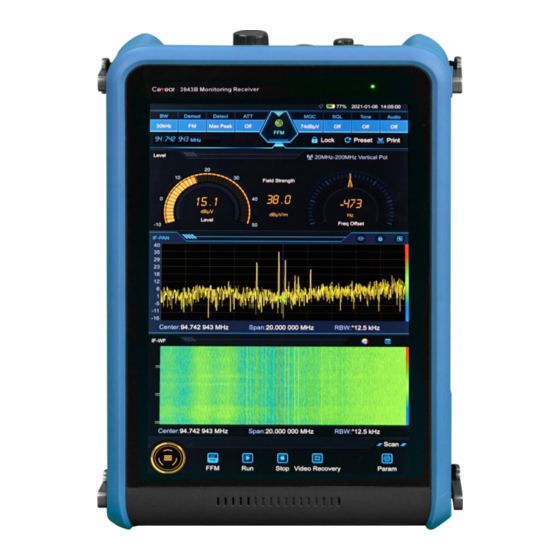
Safe operating manual 2.1 Product Overview The 3943B monitoring receiver can cover a frequency range of 9kHz to 8GHz, with the maximum analysis bandwidth of 20MHz, the overall dimensions of 182.5mm×289mm×69mm, the weight of the complete machine of less than 3.5kg, and the 10.1-inch TFT and integrated touch screen. It possesses many functions, such as radio signal search, interception, measurement, analysis, demodulation, direction finding, positioning, etc. - Page 12 2 Overview 2.2 Safe operating manual It reminds users of the operation information or instructions to be paid attention to. Note, handling heavy equipment. Standby indication Danger! Hazard of electric shock. Direct current (DC) Warning! Hot surface. Alternating current (AC) Protective conductive end Direct/alternating current (DC/AC) Ground...
-
Page 13: Operation Status And Locations
2.2.2 Operation Status and Locations Please note before operating the instrument: Unless otherwise stated, the operating environment of 3943B monitoring receiver shall meet the following requirements: stable placement of the instrument. The instrument should be operated and transported at places with an altitude no higher than 4,600m. The actual power supply voltage is allowed to vary within ±... -
Page 14: Operation Precautions
2 Overview 2.2 Safe operating manual 11) It is strictly forbidden to insert any objects into the instrument through the openings on the instrument shell, or shield the notches or openings on the instrument, as their function is to ventilate the instrument and prevent the instrument from overheating. -
Page 15: Transportation
2 Overview 2.2 Safe operating manual Discarded batteries and power modules shall be recycled and disposed of separately from other wastes. Because there are toxic substances inside the batteries, they shall be reasonably discarded or recycled according to local regulations. 2.2.7 Transportation When operating the instrument on the vehicle, the driver should drive carefully to ensure transportation safety, and the manufacturer is not responsible for any emergencies during the... -
Page 16: Quick Start
This chapter introduces the operation precautions, description of front and rear panels and interfaces, basic measurement methods, data file management, etc. of the 3943B monitoring receiver. It is aimed to enable the user initially understand the instrument itself and the measurement process. This section contains some contents consistent with the relevant sections in Quick Start. - Page 17 Please contact our company's service consultation center through the service consultation hotline in the manual, and we will provide the repair or replacement service quickly according to the situation. Table 3.1 List of Accompanying Articles of 3943B Name Quantity...
- Page 18 In any case, the instrument can be set to the best condition, and the display is in the best observation angle. When used as a desktop instrument, the 3943B monitoring receiver can be placed on a desktop or a fixed bracket to obtain the best observation angle.
-
Page 19: Precautions Before Energization
Pay attention to the following when turning on the power of the instrument: Power supply requirements The 3943B monitoring receiver has two power supply modes, namely, battery or power adapter. The 3943B monitoring receiver can be powered in two ways: Power adapter When using the AC power supply, the accompanying AC-DC adapter must be adopted. - Page 20 The battery stored for more than half a year should be additionally charged. Confirm and connect the power cord The 3943B monitoring receiver adopts three-core power line interface and conforms to national safety standards. Before the monitoring receiver is energized, you must confirm that the protective earth wire in the power line of the monitoring receiver is reliably grounded.
-
Page 21: Battery Use Instructions
The battery insertion port of 3943B monitoring receiver is located at the lower left side of the instrument. When disassembling and assembling the battery, place the instrument stably, push up the battery cover, remove the battery cover, and then insert or remove the battery. -
Page 22: Startup, Shutdown And Screen Off
Battery charging The battery can be charged when the 3943B monitoring receiver is shut down or in operation. Charging steps are as follows: First, place the battery to be charged in the instrument. -
Page 23: Correct Use Of Connectors
3 Quick Start 3.1 Get Prepared Fig. 3.5 Power Switch on Side Panel When the 943B monitoring receiver is started, all settings of the last shutdown will be restored. Shutdown Step 1. Press and hold the power switch key in the lower middle of the side panel for about 3s, and the shutdown interface will pop up. - Page 24 3 Quick Start 3.1 Get Prepared Caution Check the connector to prevent damaging ports of the instrument Any damaged connector may damage the good connector connected to it even in the first connection. In order to protect each interface of the monitoring receiver, the connector must be checked before the connector operation.
-
Page 25: Routine Maintenance
Figure 3.9. Usage of a torque wrench 3.1.6 Routine Maintenance This section describes the routine maintenance method of the 3943B monitoring receiver. 3.1.6.1 Cleaning Cleaning instrument surface Please follow the steps below when cleaning the surface of the instrument: Step 1. -
Page 26: Description Of Front And Rear Panels And Interfaces
Note Port impedance matching The radio frequency input port on the top panel of the 3943B monitoring receiver is a 50Ω connector. If the impedance connector is not matched, the test result will be affected. 3.2 Description of front and rear panels and interfaces This section introduces the elements and functions of the front panel operation interface of 3943B monitoring receiver, and the types and functions of the interfaces. - Page 27 3.2 Description of front and rear panels and interfaces ① ② ③ ④ ⑤ ⑥ Fig. 3.10 Front Panel of 3943B Monitoring Receiver Status information display area Measurement result display area 2 Menu functional area Measurement result display area 3 Measurement result display area 1 Function setting area Status information display area The top information display area is on the top of the front panel.
- Page 28 3 Quick Start 3.2 Description of front and rear panels and interfaces battery is in an undervoltage state, and the icon is shown as . When such an icon appears, please charge the battery in time. ] → [setting] → [general setting] Setting and modification of system date and time: set by pressing [ →...
-
Page 29: Description Of Side Panel Interfaces
Please refer to "5 Menus" in this manual for specific function description. 3.2.2 Description of side panel interfaces This section introduces the interfaces and functions of the side panel of 3943B monitoring receiver, and the side panel is shown in Fig. 3.13. -
Page 30: Description Of Top Panel Interface
It is the RJ45, TCP/IP and 10/100/1,000M adaptive interface, which can be used for remote operations of the receiver. USB interface The 3943B monitoring receiver provides two standard A type USB2.0 interfaces, which can be used to connect peripherals of USB interface type, such as USB storage device. SD card interface The 3943B monitoring receiver provides a Micro SD card interface for storing measurement data, map data or other user setting information. - Page 31 The 10MHz reference signal output function in the receiver is temporarily not supported. External trigger input The 3943B monitoring receiver can be set to the external trigger mode. The external trigger source is connected to the trigger input port of the receiver, and the output range of the source should be -5V~+5V.
-
Page 32: Basic Measurement Methods
Basic operation examples 3.3.1 Basic operation examples This section introduces details steps of common and important basic settings and functions of the 3943B monitoring receiver with examples to help the user rapidly know the characteristics of the instrument and understand basic measurement methods. - Page 33 3 Quick Start 3.3 Basic measurement methods Fig. 3.16 Sinusoidal Signal Measurement Results Press key to pop up the function menu, and select [Peak] to activate the frequency cursor and make it jump to the peak position of the signal on the display screen. The frequency and magnitude values can be read out by the cursor and displayed in the active functional area.
-
Page 34: Data Management
3.4.1 Reset state storage/ calling 3.4.1.1 Resetting Instrument Status The 3943B monitoring receiver uses the working state before the last shutdown by the user as the initial state during the startup measurement. If the working state before shutdown is unavailable, the factory startup state will be called by default. -
Page 35: Data Storage/ Calling
3.4.1.3 Associated user reset In addition to the association of user reset during the reset state saving, the 3943B monitoring receiver also supports setting the association between user reset and saved reset state separately. Click the edit icon [ ] behind user reset to enter the reset call dialog box, as shown in Fig. -
Page 36: Screen Shot Storage
3.4.3 Screen shot storage The 3943B monitoring receiver provides the function of storing screen shots in graphic files (png format). Press [Screen Shot] menu on the main interface to pop up the save screen dialog box, as shown in Fig. - Page 37 3 Quick Start 3.4 Data Management Fig. 3.22 Screen Saving Interface Click [Save] button to save the screen shots.
-
Page 38: Operation Guide
4 Operation Guide 4.1 Function operation guide 4 Operation Guide In this chapter, operating methods of different measurement functions of the 3943B monitoring receiver are introduced and measurement procedures are explained in detail. …………………………………………………………………………30 Function operation guide 4.1 Function operation guide This section respectively introduces operation methods of basic scan functions of the 3943B monitoring receiver, including fixed frequency receiving, panoramic scan, frequency scan and list scan. - Page 39 4 Operation Guide 4.1 Function operation guide Fig. 4.1 Fixed Frequency Receiving Mode Step 2: Set the frequency spectrum measurement channel parameters, including center frequency, bandwidth and resolution bandwidth (adaptive). Press [Center] number display area in the intermediate frequency spectrum window to pop up the numeric keyboard input area, enter the center frequency value with number keys, and select the frequency unit according to the corresponding unit area (or use a single finger to slide left and right in intermediate frequency spectrum window to modify the center frequency).
- Page 40 4 Operation Guide 4.1 Function operation guide Press [Squelch Level] area to pop up the squelch level digital slide bar, and select [On] to turn on the squelch level switch. Drag the middle slider to move left and right to adjust the squelch level value. The squelch level value is used to control the playback of demodulation sound.
- Page 41 4 Operation Guide 4.1 Function operation guide Fig. 4.3 Parameter Setting Window 4.1.1.4 Window selection Step 1. Touch to activate any window, press [Parameter] to enter the parameter setting window, and press [Window Selection] to enter the window selection interface, as shown in Fig. 4.4. Fig.
-
Page 42: Panoramic Scan
4 Operation Guide 4.1 Function operation guide Fig. 4.5 Intermediate Frequency Spectrum Intermediate frequency waterfall plot: the spectrum information within the bandwidth is displayed through the waterfall plot. The center frequency, bandwidth and resolution bandwidth can be set, and the parameters are associated with the intermediate frequency spectrum chart. As shown in Figure 4.6. - Page 43 4 Operation Guide 4.1 Function operation guide seen at a glance. During panoramic scan, RF panorama and RF waterfall are refreshed normally, while IF panorama and IF waterfall are not refreshed. When panoramic scan is stopped, the IF panorama and IF waterfall are refreshed normally, while the RF panorama and RF waterfall are not refreshed.
-
Page 44: Frequency Scan
4 Operation Guide 4.1 Function operation guide Fig. 4.9 Panorama Scan Parameter Setting Interface Step 3. Press [Start] to start the panoramic scan mode. 4.1.2.2 Window selection Please refer to 4.1.1.4 for specific operation steps. 4.1.2.3 Parameter Setting Step 1: Enter the parameter menu. In the panoramic scan mode, touch to activate the corresponding window and press [Parameter] to enter the parameter setting window. - Page 45 4 Operation Guide 4.1 Function operation guide For the situation that the signal exists but suddenly disappears in the measurement process, no signal time is used for judgment. When the level value of a certain frequency point is suddenly less than the squelch level after judging whether there is a signal or not, start the judgment of no signal time, and step to the next frequency point for measurement after exceeding the no signal time.
-
Page 46: List Scan
4 Operation Guide 4.1 Function operation guide Select [Dwell Time Mode], select manual from the drop-down box, select [Dwell Time] to pop up the numeric keyboard input area, enter the dwell time value with the number keys, and select the dwell time unit according of the corresponding unit area. - Page 47 4 Operation Guide 4.1 Function operation guide Demodulation Automatic frequency bandwidth switch Demodulation mode Signal description Attenuator mode 4.1.4.1 Editing storage table Step 1. Select [System Menu], click list to enter the list menu, and select [Storage Table], as shown in Fig.
- Page 48 4 Operation Guide 4.1 Function operation guide Fig. 4.12 Storage Table Editing 4.1.4.2 Start of list scan Step 1. After editing the storage table, set the list scan parameters, as shown in Fig. 4.13: After selecting the RF panorama, click [Parameter] to enter the parameter menu and select the [Measurement Related] submenu.
- Page 49 4 Operation Guide 4.1 Function operation guide Fig. 4.13 List Scan Parameter Settings 4.1.4.3 Window selection Please refer to 4.1.1.4 for specific operation steps. 4.1.4.4 Parameter Setting Step 1. Enter the parameter menu. In list scan mode, touch to activate the corresponding window and press [Parameter] to enter the parameter setting window.
-
Page 50: Menus
Section 5.1. Fig. 5.1 General Menu In addition to the general menu, the 3943B monitoring receiver corresponds to different menus in different windows of each scan mode, which will be described in detail in Section 5.2. ... -
Page 51: Setting Menu
5. Menus 5.1 General Menu Fig. 5.3 Secondary Menu of Panoramic Scan Mode When the menu of Fixed Frequency Receiving is selected, the menu items are shown in Fig. 5.4: Fig. 5.4 Secondary Menu of Panoramic Scan Mode When you select [Frequency Scan], the menu items are shown in Fig. 5.5. Fig. - Page 52 5. Menus 5.1 General Menu Fig. 5.7 Receiving End Setting Property Page Parameters in the receiving end setting property page are described as follows: [Gain Tracking Speed] Set the gain tracking speed, including three modes: fast, normal and slow, and the default is normal mode.
- Page 53 5. Menus 5.1 General Menu Fig. 5.8 General Setting Property Page Parameters in the general setting property page are described as follows: [System Time] Set the system time in the format of yyyy-MM-dd hh:mm:ss. [Time Zone] Set the system time zone. [GNSS Input Port] Set GNSS input ports, including GNSS port and AUX port.
- Page 54 5. Menus 5.1 General Menu [Fan Control] Set fan control modes, including off, on and automatic control modes, which is automatic mode by default. [Level Unit] Set the display unit of level, including dBm and dBuV, and the default is dBuV. [Outdoor Display Mode] Set the switch state of outdoor display mode, which is off by default and turned on when used outdoors.
-
Page 55: List Menu
5. Menus 5.1 General Menu 5.1.2.4 About equipment This about equipment property page is shown in Fig. 5.10: Fig. 5.10 About Equipment Property Page Parameters in the about equipment property page are described as follows: [Version Number] Display the current version number of the system software. [Update Source] Select the source of software version update, and support using USB flash drive to update programs. - Page 56 5. Menus 5.1 General Menu Fig. 5.11 Storage Table Property Page The storage table is used to store the parameters of scan frequency points during list scan. Each line stores one frequency point. The parameters include: serial number, activation, frequency, bandwidth, demodulation mode, attenuation mode, squelch switch, squelch value, automatic frequency control switch and description.
- Page 57 5. Menus 5.1 General Menu [Import] Import the storage table information in the external file into the current storage table. [Export] Export the information in the current storage table to an external file. 5.1.3.2 Suppression table The suppression table window is shown in Fig. 5.12: Fig.
-
Page 58: Record Menu
5. Menus 5.1 General Menu 5.1.4 Record menu The recording menu is related to the recording function, which is an option of this machine. When the complete machine has the recording function option, this menu is available. Click [Record Mode] menu to select [Record Mode /IQ], [Record Mode/Spectrum] and [Record Mode/Audio]. - Page 59 5. Menus 5.1 General Menu Fig. 5.17 IQ Recording Process 5.1.4.2 Spectrum record Enter the spectrum recording menu and click [Setting] to pop up the setting box option, as shown in Fig. 5.18: Fig. 5.18 Spectrum Record Setting Parameter Box Parameters in spectrum setting property page are described as follows: [Storage Location] There are two modes: internal memory and SD card.
-
Page 60: File Menu
5. Menus 5.1 General Menu Fig. 5.21 Audio Recording Process 5.1.5 File menu The file menu is used to display the related menu of internal storage and external storage. Click the file menu to pop up the file management dialog box. When the external storage device is not connected, only the internal storage path is displayed. -
Page 61: Self-Test Menu
5. Menus 5.1 General Menu 5.1.6 Self-test menu The self-test menu is used to complete the self-test of the instrument. Click on the self-test menu to complete the instrument self-test, and the test results are shown in Figure 5.23. Figure 5.23 Self-test results of the machine 5.1.7 Frequency scale menu Frequency scale can be enabled through the frequency scale menu.If the current activation window does not support the frequency marker function, the menu is grayed out. - Page 62 5. Menus 5.1 General Menu [Magnitude marker] Click the magnitude marker, two longitudinal frequency scales Y1 and Y2 will be displayed on the IF panoramic spectrum, as shown in Fig. 5.25. Both the Y1 and Y2 scales can be moved, and the magnitudes of Y1 and Y2, and the difference between the magnitudes of Y1 and Y2 will be displayed in the top column of the panoramic spectrum, and these values will change as the Y1 and Y2‘s longitudinal frequency scales are moved.
-
Page 63: Antenna Menu
5. Menus 5.1 General Menu scale as the demodulation frequency. Click frequency scale -> Demodulation menu, the frequency corresponding to the selected horizontal frequency scale is set as the demodulation frequency. 5.1.8 Antenna menu Antenna menu is used to set the antenna connected to this machine, click the antenna menu to bring up the antenna setting dialog, as shown in Fig. -
Page 64: Playback Menu
5. Menus 5.1 General Menu detailed description of the Peak menu in 5.1.7 Frequency scale menu. 5.1.10 Playback menu The function of this menu is to set the playback, the playback function is an option of the machine, when the whole machine has the playback function option, the menu is available. The playback function supports playback of the spectrum and audio data files recorded by this machine. - Page 65 5. Menus 5.1 General Menu Click [Playback Selection] to bring up the file options, and you can select any file you want to play back, as shown in Fig. 5.32: Fig. 5.32 Spectrum file selection Select the file and click [Read] to enter the spectrum playback status, as shown in Fig. 5.33: Fig.
- Page 66 5. Menus 5.1 General Menu Fig. 5.34 Playback mode/audio Click [Playback Selection] to bring up the file options, and you can select any file you want to play back, as shown in Fig. 5.35: Fig. 5.35 Audio file selection Select the file and click [Read] to enter the audio playback status, as shown in Fig. 5.36.
-
Page 67: Window Menu
Fig. 5.36 Audio playback 5.2 Window menu The 3943B monitoring receiver has different menus under different windows of different scan modes. This section details the menu information contained in each window of each scan mode, in the order of fixed frequency reception, panoramic scan, frequency scan, and list scan, respectively. - Page 68 5. Menus 5.2 Window menu Fig. 5.38 Level field strength window parameter setting property page The relevant parameters on the Parameter Settings property page are described as follows: [Level Display Lower Limit] Set the lower limit of the level display, the default value is -10dBuV. [Level Display Range] Set the level display range, default select 60.00dB.
- Page 69 5. Menus 5.2 Window menu Fig. 5.39 Level field strength window selection property page Select the combination of windows to be displayed, you can only choose to display 2-3 windows, if the number of windows selected does not meet the requirements, a dialog box will pop up to prompt: the number of windows selected is incorrect, please choose again! 5.2.1.2 IF panoramic window The parameter setting dialog box corresponding to the IF panorama window contains three property...
- Page 70 5. Menus 5.2 Window menu Set the detection type, including dynamic refresh, minimum value, maximum value, and average four trace types, and the default is dynamic refresh. [Filter Selectivity] Set the filter type, including auto, regular, narrow, and sharp four selection types, and the default is regular.
- Page 71 5. Menus 5.2 Window menu Set the maximum display level of the window. The range is -30dBuV~110dBuV, and the default value is set to 76.99dBuV. [Lowest Level] Set the minimum display level of the window. The range is -230dBuV~100dBuV, and the default value is set to -23.01dBuV.
-
Page 72: Panoramic Scan
5. Menus 5.2 Window menu Fig. 5.42 Display property pages under IF waterfall window The display parameters are described below: [Spectrum/Line] Set the compression ratio of spectrogram and waterfall map, including 1:1, 2:1, 5:1, 10:1, 20:1, 50:1, 100:1, where the larger the compression ratio the slower the waterfall map. The default compression ratio is set to 1:1;... - Page 73 5. Menus 5.2 Window menu contains three property pages, including measurement, display and window selection, which is the same as 5.2.1.2 IF panorama window in fixed frequency reception mode. 5.2.2.2 IF waterfall window The parameter setting dialog corresponding to the IF waterfall window in panoramic scan mode contains three property pages, including measurement, display and window selection, which is the as 5.2.1.3 IF waterfall window in fixed frequency reception mode.
- Page 74 5. Menus 5.2 Window menu Set the measurement mode, including two modes: periodical and continuous, and the default is periodical mode. [Measurement Time Mode] Set the type of measurement time, including automatic and manual modes. Auto mode is selected by default (in the auto mode the measurement time is automatically calculated by the receiver).
- Page 75 5. Menus 5.2 Window menu [Max Hold Display] Sets the maximum hold display switch, which is turned off by default. [Max Hold Continuous Mode] Set the maximum hold continuous mode which is valid when the maximum hold display status is on. It includes wireless and manual states, and the unlimited mode is set by default.
- Page 76 5. Menus 5.2 Window menu Fig. 5.45 Measurementproperty page under the RF Waterfall window The measurement-related parameters are described below: [Center Freq] Set the center frequency with the range of 13.5kHz~7.999995GHz, the default value is 98MHz, if the set center frequency and the current bandwidth are not coordinated, the bandwidth will be automatically adjusted to the best value that is compatible with the desired frequency.
-
Page 77: Frequency Scan
5. Menus 5.2 Window menu [Differential Mode] Set the differential display of the spectrum. Differential mode will display when it is on, and it is in normal display when it is off. Display The corresponding display property pages of the RF waterfall window in panoramic scan mode are shown in Fig. - Page 78 5. Menus 5.2 Window menu Click [Run-] menu, in the RF panorama window the trace is scanned forward in every step starting from the termination frequency. Click the [Stop] menu to stop the step scan in the RF Panorama window and RF Waterfall window. Click the [Restart] menu to restart the step scan.
- Page 79 5. Menus 5.2 Window menu Set the center frequency with the range of 13.5kHz~7.999995GHz, the default value is 98MHz, if the set center frequency and the current bandwidth are not coordinated, the bandwidth will be automatically adjusted to the best value that is compatible with the desired frequency. [Span] Set the frequency width with the range of 9kHz~7.999991GHz, the default value is 20MHz.
-
Page 80: Scan The List
5. Menus 5.2 Window menu Window selection The window selection property sheet corresponding to the RF panorama window in frequency scan mode is the same as the window selection property sheet under 5.2.1.2 IF panorama window. 5.2.3.5 RF waterfall window The parameter setting dialog corresponding to the RF waterfall window in frequency scan mode contains three property pages: measurement, display, and window selection. - Page 81 5. Menus 5.2 Window menu The measurement property pages corresponding to the RF panorama window in list scan mode are shown in Fig. 5.48. Fig. 5.48 Measurement property pages corresponding to the RF panorama window in list scan mode The measurement-related parameters are described below: [Memory Table Squelch Level] Set the state of the memory table squelch level, including the open and close states, the default is open.
- Page 82 5. Menus 5.2 Window menu Set the dwell time with the range of 0~60s. The default setting is 500ms, and the dwell time mode is valid when set to manual. [No Signal Time State] Set the no-signal time state, including on and off. The default setting is on. [No Signal State Dwell Time] Set the no-signal state dwell time.
-
Page 83: Remote Control
6 Remote control 6.1 Remote control principals 6 Remote control This chapter provides the basic information for operating the 3943B monitoring receiver by remote control to facilitate remote control operation. Specifically it includes: Remote control principals…………………………………………………………………………84 Instrument program control port and configuration……………………………………………………96 ... -
Page 84: Message
The ―host address‖ indicates the IP address or host name of the instrument, which is used to identify and manage the controlled instrument. The port identifies the socket port number. For the 3943B monitoring receiver it is 5025; The SOCKET represents the raw network socket resource class. -
Page 85: Scpi Commands
6 Remote control 6.1 Remote control principals Interface message During communication between the instrument and the host computer, the ―attention‖ cable shall be pulled down first before the interface messages can be transmitted to the instrument via the data cable. Only the instruments with GPIB bus function can send interface messages. - Page 86 Use with ANSI/IEEE Std488.1-1987. New York, NY, 1998. Standard Commands for Programmable Instruments(SCPI) VERSION 1999.0. For the collection, classification and description of remote control commands for 3943B monitoring receivers, please refer to: Appendix B SCPI command quick reference table.
- Page 87 6 Remote control 6.1 Remote control principals are easily identifiable. For example *IDN? , *OPC, *RST are all general commands. Common commands are not part of any instrument commands, and the instrument interprets them in the same way regardless of the current path setting of the commands. Instrument commands are easy to be recognized because they contain a colon (:).
- Page 88 6 Remote control 6.1 Remote control principals usually ignored as long as they do not appear STEP and 1MHz must be separated by a space. between keywords or in keywords. However, you That is: FREQuency :STEP 1MHz must use blank characters to separate commands and parameters without affecting the current path.
- Page 89 6 Remote control 6.1 Remote control principals Different parameter types have one or more corresponding response data types. During a query, a data type will be returned for a numerical parameter, and the response data is precise and strict, known as "Speak precisely"...
- Page 90 6 Remote control 6.1 Remote control principals Average value wave detection FAST Fast wave detection PEAK Peak wave detection Power wave detection d) Boolean parameters A Boolean parameter represents a true or false binary condition, which can only have four possible values.
- Page 91 6 Remote control 6.1 Remote control principals PERiodic measurement mode is periodic CONTinuous measurement mode is continuous Digital Boolean response data A binary value 1 or 0 is returned as Boolean response data. String response data String response data and string parameters are alike. The main difference is that the separators of string response data are double quotes instead of single quotes.
-
Page 92: Command Sequence And Synchronization
6 Remote control 6.1 Remote control principals the beginning of the command. It can be abbreviated to the following command line: HCOP:ITEM ALL;IMM 6.1.4 Command Sequence and Synchronization IEEE 488.2 defines the difference between an interleaved command and a sequential command: ... - Page 93 6 Remote control 6.1 Remote control principals SCPI status register includes: STATus:OPERation, STATus:QUEStionable registers (SCPI definition), STATus:TRACe and STATus: EXTension registers (SCPI definition), which contain instrument specific operation information. All SCPI status registers have the same internal structure (please refer to section 2.1.5.2 "SCPI Status Register Structure"...
- Page 94 6 Remote control 6.1 Remote control principals Fig. 6.1 Hierarchical structure of the status register 6.1.5.2 Application of status reporting system The status report system is used to monitor the status of one or more instruments in the test system. The master computer in the test system must receive and assess all instrument information with the following standard methods, so as to realize functions of the status report system properly: Service request (SRQ) initiated by the instrument;...
-
Page 95: Programming Considerations
Application of the connector at the master control port of Side USB The Type-A connector on the side panel is the USB master port connector, which in the 3943B monitoring receiver can be used to connect a USB flash drive for instrument resident software upgrades. -
Page 96: Basic Visa Interface Programming Method
6 Remote control 6.3 Basic VISA interface programming method Fig. 6.2 Main menu buttons and main menu In the [Settings] dialog box shown in Fig. 6.3, select [Network Settings] and set the "IP Address", "Subnet Mask" and "Gateway" to the subnet where the main controller is located. The subnet in which the main controller is located can be set. -
Page 97: Initialize The Controller
= viWrite(monitor, "FREQ:MODE FFM", 13, &retCnt); //Set the instrument operating mode (here the monitor receiver command is used as an example) 6.3.4 Send Setting Command /*************************************************************************/ The following example illustrates how to set the 3943B to monitor the receive frequency. /*************************************************************************/ void SimpleSettings() ViStatus status;... -
Page 98: Read The State Of Measuring Instrument
6 Remote control 6.4 I/O library 6.3.5 Read the State of Measuring Instrument /*************************************************************************/ The following examples show how to read the set state of the instrument. /*************************************************************************/ void ReadSettings() ViStatus status; long retCnt; char rd_Buf_CW[VI_READ_BUFLEN]; // #define VI_READ_BUFLEN 40 // Query center frequency status = viWrite(monitor, "FREQ?", 5, &retCnt);... -
Page 99: Installation And Configuration Of I/O Library
6 Remote control 6.4 I/O library plan, such as configuring the instrument, reading from the instrument, writing to the instrument and triggering the instrument, etc. Residing in the computer, it is the bridge and link between the computer and the instrument. By providing a high-level modular library for convenient programming, users no longer need to learn the complex low-level programming protocol for a specific instrument. - Page 100 6 Remote control 6.4 I/O library specification and have the same application development environment, including Visual Studio, Visual Basic, Agilent VEE, LabVIEW, CVI/LabWindows, etc. Two types of driver should be provided at present to meet the needs of different users in different development environments.
-
Page 101: Troubleshooting And After-Sales Services
Method to Obtain After-sales Services………………………………………………………………107 7.1 Working principles In order to facilitate the user to understand the function of the 3943B monitoring receiver and better solve the problems encountered in the operation process, this section introduces the basic working principle of the monitoring receiver and the hardware block diagram. - Page 102 Touch Screen Interface Battery Management Fig. 7.1 Block diagram of the 3943B monitoring receiver Optional inverter module After the antenna sends the received RF signal to the pre-selected frequency conversion module, it is switched by the microwave switch to 3 bands: 0-band (9 kHz to 30 MHz), 1-band (20 MHz to 3.6 GHz) and 2-band (3.6 GHz to 8 GHz).
-
Page 103: Troubleshooting And Debugging
Troubleshooting and instructions This section introduces the way on how to judge and handle failures (if any) of the 3943B monitoring receiver, and feed them back to the manufacturer as accurately as possible if necessary for quick solution. -
Page 104: Error Message
No screen display When 3943B monitoring receiver is powered on, the power indicator in the upper right corner of the front panel from orange to green, while the screen does not light up, connect the network cable, if the network port light blinks, and the network can be connected. -
Page 105: Error Message Description
Packaging and mailing…………………………………………………………………………107 7.4.1 Contact us In case of any failure to the 3943B monitoring receiver, check and save the error message, analyze ―7.2 Troubleshooting and debugging‖ possible causes, and refer to the methods provided in preliminary troubleshooting. You can also contact our service center and provide the error messages... -
Page 106: Package And Mailing
7 Troubleshooting and after-sales services 7.4 Method to obtain after-sales services you‘ve collected, and we will coordinate with you to solve the problem as soon as possible. Online website: www.ceyear.com for the nearest technical support station. Contact information: Service Consultation: 0532-86889847 800-868-7041... -
Page 107: Technical Indicators And Testing Methods
8.1 Statement 8 Technical indicators and testing methods This chapter describes the technical specifications and main test methods of the 3943B monitoring receiver. S t a t e m e n t … … … … … … … … … … … … … … … … … … … … … … … … … … … … … … … … 1 0 8 ... -
Page 108: Technical Indicators
8 Technical indicators and testing methods 8.3 Technical Indicators Group 1 Class B equipment. e) Electromagnetic radiation immunity: in accordance with the provisions of GB/T 17626.3-2006, test level 2, field strength 3V/m, frequency range 80MHz ~ 1000MHz, 1kHz sine wave 80% modulation magnitude. f) Electrostatic discharge immunity: According to GB/T 17626.2-2006, the test level is 3, 6kV contact discharge and 8kV air discharge. - Page 109 8 Technical indicators and testing methods 8.3 Technical Indicators +3dBm, 20MHz to 3.6GHz (low distortion mode); -24dBm, 20MHz to 3.6GHz (low noise mode); -24dBm, 3.6GHz to 8GHz. RF input port voltage standing wave ratio <2.5, 9 kHz to 5.8 GHz; <4.0, 5.8GHz to 8GHz.
- Page 110 8 Technical indicators and testing methods 8.3 Technical Indicators Carrier 500MHz, <-95dBc/Hz, 10kHz frequency deviation, <-95dBc/Hz, 100kHz frequency deviation; Carrier 3.4GHz, <-92dBc/Hz, 10kHz frequency deviation, <-92dBc/Hz, 100kHz frequency deviation; Carrier 7.499GHz, <-92dBc/Hz, 10kHz frequency deviation, <-92dBc/Hz, 100kHz frequency deviation; Carrier 8GHz, <-92dBc/Hz, 10kHz frequency deviation, <-92dBc/Hz, 100kHz frequency deviation.
-
Page 111: Additional Information
8 Technical indicators and testing methods 8.4 Additional information >90dB, 20MHz to 3.6GHz (low noise mode); >80dB, 20MHz to 3.6GHz (low distortion mode); >70dB, 3.6GHz to 8GHz. 12) Mirror frequency suppression (2 IF) >60dB, 20MHz to 3.6GHz (low noise mode); >60dB, 20MHz to 3.6GHz (low distortion mode);... -
Page 112: Performance Characteristics Test
Set the center frequency at 9 kHz and the frequency width at 10 kHz. Use the peak frequency scale to read out the signal frequencies and record the measurements in the 3943B Monitoring Receiver Functional Performance Test Auxiliary Table (hereinafter referred to as the "Auxiliary Table") B.1. - Page 113 B.1. Recording and data processing The records in Auxiliary Form B.1 are summarized in 3943B Monitoring Receiver Functional Performance Test Record Form (hereinafter referred to as the "Functional Performance Test Record Form") A.1.
- Page 114 8 Technical indicators and testing methods 8.5 Performance characteristics test Fig. 8.3 Schematic diagram of input port SWR test Test procedure Set the frequency range and output power of the vector network analyzer as appropriate parameters and select the SWR display. Single-port reflection measurement calibration (including open-circuit, short-circuit, and load calibration) for vector network analyzers.
- Page 115 8 Technical indicators and testing methods 8.5 Performance characteristics test Fig. 8.4 Display average noise level test schematic diagram Test procedure Connect a 50Ω load to the RF input port of the device to be tested in accordance with Fig. 8.4. Reset the device to be tested.
- Page 116 8 Technical indicators and testing methods 8.5 Performance characteristics test Connect a 50Ω load to the RF input port of the device to be tested in accordance with Fig. 8.5. Reset the device to be tested. Set the device to be tested to fixed frequency reception mode (FFM). Set the level unit to dBm.
- Page 117 8 Technical indicators and testing methods 8.5 Performance characteristics test recorded in the auxiliary Table B.6. Recording and data processing The data in Auxiliary Table B.6 are processed according to the following formula, and the calculation results are recorded in Auxiliary Table B.6 and the values of positive and negative frequency deviation phase noise difference at each frequency point are summarized and recorded in Functional Performance Test Record Table A.1.
- Page 118 8 Technical indicators and testing methods 8.5 Performance characteristics test signal generator until the audio analyzer shows a stable SINAD value of about 30 dB, reduce the signal power until the SINAD value drops to 12 dB, and record the corresponding power value read out from the signal generator at this time in the auxiliary table B.7.
- Page 119 8 Technical indicators and testing methods 8.5 Performance characteristics test The test results recorded in the auxiliary table B.8 are recorded in the functional performance test record table A.1 as a summary of FM demodulation sensitivity for the corresponding band. 8.5.1.9 Third-order intercept points Description of the test items The third-order intercept point (IP3) is a measure of the ability of the device under test to suppress...
- Page 120 8 Technical indicators and testing methods 8.5 Performance characteristics test 3dB, and set the lowest level less than the highest level by 100dB. Set the measurement time of the device to be measured manually, 350ms, and set the detection type to average. Set the frequency of synthesized signal generator 1 and synthesized signal generator 2 according to auxiliary table B.9, adjust the power of the two synthesized signal generators so that they arrive at the input port of the equipment to be tested with equal power and equal to the table power value, allowing...
- Page 121 8 Technical indicators and testing methods 8.5 Performance characteristics test Fig. 8.10 Schematic diagram of the second-order intercept point test Test procedure Connect the test equipment as shown in Figure 8.10. Reset the device to be tested. Set the device to be tested as fixed frequency reception mode (FFM) and set the frequency reference as external reference.
- Page 122 8 Technical indicators and testing methods 8.5 Performance characteristics test other. Each frequency of the LO has a mirror frequency of corresponding input signal, with the difference of two IFs between the signal and the mirror frequency. This test is to measure the ability of the equipment to be tested to suppress the interference signal whose input frequency is its mirror frequency rate.
- Page 123 8 Technical indicators and testing methods 8.5 Performance characteristics test Recording and data processing Process the test data according to the following formula and record the calculation results in the auxiliary table B.11. The minimum value of the calculated mirror frequency rejection ratio in each band is recorded as the summary of the mirror frequency rejection ratio in this band in the functional performance test record table A.1.
- Page 124 8 Technical indicators and testing methods 8.5 Performance characteristics test synthesized signal generator, and the frequency reference of the device to be tested is set as the external reference. Set the device to be tested to fixed frequency reception mode (FFM mode). In the IF Panorama window, set the bandwidth to 100 kHz and the resolution bandwidth (RBW) to auto.
- Page 125 8 Technical indicators and testing methods 8.5 Performance characteristics test Fig. 8.13 Schematic diagram of IF suppression test Test procedure Connect the test equipment as shown in Figure 8.13. Reset the device to be tested. The device to be tested shares a common time base with the synthesized signal generator, and the frequency reference of the device to be tested is set as the external reference.
- Page 126 8 Technical indicators and testing methods 8.5 Performance characteristics test The local oscillation re-radiation is a measure of the ability of the device to be tested to suppress the level of internal leakage from various local oscillation sources to the RF input port. Through the signal / spectrum analyzer test to be tested device RF input port radiation signal maximum, that is, the local oscillation re-radiation value.
- Page 127 8 Technical indicators and testing methods 8.5 Performance characteristics test Fig. 8.15 Schematic diagram of the residual response test Test procedure Connect a 50 load to the RF input port of the device to be tested according to Fig. 8.15. Reset the device to be tested.
- Page 128 8 Technical indicators and testing methods 8.5 Performance characteristics test 3GHz, 3.5GHz, 4GHz, 4.5GHz, 5GHz, 5.5GHz, 6GHz, 6.5GHz, 7GHz, 7.5GHz, 7.9 GHz total 22 points, output power -30dBm, dwell time T 0 is 3.9s, start single scan. After the end of a single scan, observe whether the device under test can display all burst signals, use the maximum hold frequency scale to measure the frequency and magnitude of all burst signals to meet the level error less than 5dB and frequency error less than 1 resolution bandwidth.
- Page 129 8 Technical indicators and testing methods 8.5 Performance characteristics test B.17. The signal power was measured using the peak frequency scale and recorded in the auxiliary table B.17. The same signal power is measured using a power meter and recorded in the auxiliary table B.17. Set the test frequencies in sequence to complete the test.
-
Page 130: Performance Test Log Sheet
8 Technical indicators and testing methods 8.5 Performance characteristics test 8.5.2 Performance test log sheet Instrument No.: Test Personnel: Test Condition: Test Date: Item Unit Standard Requirement Results The appearance of the instrument is neat and Design and beautiful, the panel markings are clearly written, the Structure keys are flexible, and the connectors are convenient and in place. - Page 131 8 Technical indicators and testing methods 8.5 Performance characteristics test ≤10.5dB, test frequency 50MHz ≤9.5dB, test frequency 140MHz ≤10.5dB, test frequency 430MHz Item Unit Standard Requirement Results ≤11dB, test frequency 1.1GHz ≤11dB, test frequency 1.5GHz ≤14.5dB, test frequency 3.4GHz Noise factor (level ≤17dB, test frequency 3.6GHz channel) ≤13dB, test frequency 5.5GHz...
- Page 132 8 Technical indicators and testing methods 8.5 Performance characteristics test >+18dBm, 9kHz to 30MHz >-10dBm, 20MHz to 650MHz (low noise mode) >-11.5dBm, 650MHz to 2.5GHz (low noise mode) >-8dBm, 2.5GHz to 3.6GHz (low noise mode) Third-order intercept points >+15dBm, 20MHz to 1.5GHz (low distortion mode) >+15dBm, 1.5GHz to 3.6GHz (low distortion mode) >-8dBm, 3.6GHz to 4.7GHz >-6dBm, 4.7GHz to 8GHz...
-
Page 133: Performance Test Auxiliary Tables
Table B.1 (Test of frequency range) Signal source output Item Test results frequency 9kHz Frequency range 8GHz (GHz) Table B.2 (Test of maximum linear operating level) Signal source output 3943B attenuation control Item Test results frequency 11MHz 75MHz Maximum linear operating level 160MHz 500MHz 1GHz... - Page 134 8 Technical indicators and testing methods 8.5 Performance characteristics test Signal source output 3943B attenuation control Item Test results frequency 2GHz 3GHz 75MHz 160MHz 500MHz 1GHz 2GHz 3GHz 4.1GHz 5.2GHz 6.3GHz 7.5GHz Table B.3 (RF input port voltage SWR test)
- Page 135 8 Technical indicators and testing methods 8.5 Performance characteristics test 9kHz 100kHz 100Hz dBm/Hz 100kHz 1MHz 100Hz dBm/Hz 1MHz 20MHz 10kHz 50ms dBm/Hz 20MHz 80MHz 10kHz 50ms dBm/Hz Explicit 80MHz 1.5GHz 1MHz 50ms dBm/Hz average 1.5GHz 3.6GHz 1MHz 50ms dBm/Hz noise level 20MHz 3.6GHz...
- Page 136 8 Technical indicators and testing methods 8.5 Performance characteristics test Test Frequency scale Item Freq Offset Test results frequency readings +100kHz dBc/Hz 312.5Hz -100kHz dBc/Hz +10kHz dBc/Hz 31.25Hz -10kHz dBc/Hz 3.4GHz +100kHz dBc/Hz 312.5Hz -100kHz dBc/Hz +10kHz dBc/Hz 31.25Hz -10kHz dBc/Hz 7.499GHz +100kHz...
- Page 137 8 Technical indicators and testing methods 8.5 Performance characteristics test Intermodulati Signal Signal Signal Signal Intermodulati Third-ord on of high Center generator generat generator generat on of low end Item end product Contr or 1 or 2 product level intercept Freq level frequency...
- Page 138 8 Technical indicators and testing methods 8.5 Performance characteristics test Intermodulati Signal Signal Signal Signal Intermodulati Third-ord on of high Center generator generat generator generat on of low end Item end product Contr or 1 or 2 product level intercept Freq level frequency...
- Page 139 8 Technical indicators and testing methods 8.5 Performance characteristics test Table B.10 (Test of second-order intercept points) Mutual Mutual tuning adjust Signal Signal Intermodul Intermodul Second- Signal Signal ment of Cente generat generat ation of high-e ation of order gener gener low-en Item...
- Page 140 8 Technical indicators and testing methods 8.5 Performance characteristics test Mutual Mutual tuning adjust Signal Signal Intermodul Intermodul Second- Signal Signal ment of Cente generat generat ation of high-e ation of order gener gener low-en Item or 1 or 2 low end high-end intercept...
- Page 141 8 Technical indicators and testing methods 8.5 Performance characteristics test Mirror Mirror Signal Mirror frequency frequency Center generator Test Item Frequency signal input interference frequency setting results Control Rate power output power power 2.6GHz 13.05GHz -25dBm 3GHz 13.45GHz -25dBm 3.5GHz 13.95GHz -25dBm 30MHz...
- Page 142 8 Technical indicators and testing methods 8.5 Performance characteristics test Mirror Mirror Signal Mirror frequency frequency Center generator Test Item Frequency signal input interference frequency setting results Control Rate power output power power 10.9GHz -25dBm 6.95GHz 3GHz -25dBm 11.45GHz -25dBm 7.5GHz 3.55GHz -25dBm...
- Page 143 8 Technical indicators and testing methods 8.5 Performance characteristics test Mirror Mirror Signal Mirror frequency frequency Center generator Test Item Frequency signal input interference frequency setting results Control Rate power output power power 3.22GHz -25dBm 30MHz 310MHz -10dBm 75MHz 355MHz -10dBm 90MHz 370MHz...
- Page 144 8 Technical indicators and testing methods 8.5 Performance characteristics test Mirror Mirror Signal Mirror frequency frequency Center generator Test Item Frequency signal input interference frequency setting results Control Rate power output power power 4.92GHz -25dBm 5.98GHz -25dBm 5.7GHz 5.42GHz -25dBm 6.13GHz -25dBm 5.85GHz...
- Page 145 8 Technical indicators and testing methods 8.5 Performance characteristics test Signal IF signal Center generator input Item interference Test results frequency frequency setting power Control output power power 140MHz -25dBm 5225MHz -25dBm 1.55GHz 140MHz -25dBm 5225MHz -25dBm 2GHz 140MHz -25dBm 5225MHz -25dBm 2.4GHz...
- Page 146 8 Technical indicators and testing methods 8.5 Performance characteristics test Signal IF signal Center generator input Item interference Test results frequency frequency setting power Control output power power 140MHz -10dBm 5225MHz -10dBm 2.6GHz 140MHz -10dBm 5225MHz -10dBm 3GHz 140MHz -10dBm 5225MHz -10dBm 3.5GHz...
- Page 147 8 Technical indicators and testing methods 8.5 Performance characteristics test re-radiation 90MHz 5.315GHz 160MHz 5.385GHz 210MHz 5.435GHz 500MHz 5.725GHz 660MHz 5.885GHz 1GHz 6.225GHz 1.45GHz 6.675GHz 1.55GHz 6.775GHz 2GHz 7.225GHz 2.4GHz 7.625GHz 2.6GHz 7.825GHz 3GHz 8.225GHz 3.5GHz 8.725GHz 3.601GHz 5.576GHz 4.1GHz 6.075GHz 4.6GHz 6.575GHz...
- Page 148 8 Technical indicators and testing methods 8.5 Performance characteristics test Table B.17 (Tests of magnitude accuracy) 0-band Synthetic Test value Power Synthetic Test value Power Test source of the meter Magnitude Test source of the meter Magnitude frequency output device to test error frequency...
-
Page 149: Recommended Instrument For Performance Characteristics Test
8 Technical indicators and testing methods 8.5 Performance characteristics test 8.5.4 Recommended instrument for performance characteristics test Table 8.5 Recommended instrument for performance characteristics test Recommended Instrument Main technical indicators model Frequency range:250kHz to 20GHz Power output:-100dBm to +15dBm Composite Signal Frequency Accuracy:±... -
Page 150: Appendix
Appendix Appendix Appendix A Glossary Description………………………………………………………………………147 Appendix B SCPI Command Quick Reference Table………………………………………………152 Appendix C Quick Reference Table of Error Messages………………………………………………162 Annex A Terminology Units of measurement The units of measurement commonly used for monitoring receivers are shown in Table 1. Table 1 Measurement Units Measurement parameters Name of Unit... -
Page 151: Spurious Response
Appendix Spurious response The unexpected spurious signal on the monitoring receiver display. Spurious response consists of spurious response and residual response, the former refers to the abnormal response occurred in the monitoring receiver display along with the input signal, consisting of harmonic response, intermodulation response, mirror frequency response, multiple response and out-of-band response;... -
Page 152: Resolution
Appendix Resolution Resolution is used to represent the capability of the monitoring receiver to clearly separate two input signals. It is subject to the influence of some factors such as IF filter bandwidth, rectangle coefficient, local-oscillator residual frequency modulation, phase noise and sweep time. Most monitoring receivers are using LC filters, crystal filters, active filters, digital filters, etc. -
Page 153: Frequency Range
Appendix Frequency range The range between the min. frequency and max. frequency that can be measured by monitoring receiver under the specified performance conditions. The frequency span and relevant frequency band division shall be specified in the product specifications. Frequency accuracy The measured frequency shows how close the value is to the true value. -
Page 154: Phase Noise
Appendix PdBm = -174dBm+FdB+10LogB Where: PdBm - the sensitivity of the monitoring receiver FdB - noise factor of the monitoring receiver B - 3dB bandwidth (in Hz) of the monitoring receiver Phase noise The oscillator in the monitoring receiver is used to convert the input signals of different frequencies to the intermediate frequency. -
Page 155: Appendix B Scpi Command Quick Reference Table
Appendix Appendix B SCPI Command Quick Reference Table Table B.1 SCPI Command Quick Reference Table Command Function *CLS Clear Status *ESE Set or query the event status enable register *ESE? Query event status enable register Read the event status register decimal value, *ESR? then set the register value to zero *IDN? - Page 156 Appendix adjacent peak Set the independent frequency scale of the RF CALCulate:RFPan:MARKer:MMAXimum[:PEAK] panoramic frequency scale pair to the maximum peak Set the independent frequency scale of the RF CALCulate:RFPan:MARKer:MMAXimum:LEFT panoramic frequency scale pair to the left adjacent peak Set the independent frequency scale of the RF CALCulate:RFPan:MARKer:MMAXimum:RIGHt panoramic frequency scale pair to the right adjacent peak...
- Page 157 Appendix DISPlay:LEVel:RANGe? horizontal scale view Automatically adjust level range DISPlay:PSCan:LEVel:AUTO reference level of RF panoramic scanning DISPlay:PSCan:LEVel:RANGe <set_range> Set or query the level range of RF panorama scan DISPlay:PSCan:LEVel:RANGe? DISPlay:PSCan:LEVel:REFerence <set_reference> Set or query the reference level of the RF panorama DISPlay:PSCan:LEVel:REFerence? DISPlay:WATerfall:CMAP <color_map>...
- Page 158 Appendix MEASure:MODE <meas_mode> Set or query measurement mode MEASure:MODE? MEASure:TIME <meas_time> Set and query measurement times for all measurement functions MEASure:TIME? Clear the configuration parameters of the MEMory:CLEar <mem_loc> [,<count>|MAXimum] specified memory location in the memory table MEMory:CONTents <mem_loc>,<mem_paras> Set or query configuration parameters for a specified memory location MEMory:CONTents? Copy the contents of one memory location to...
- Page 159 Appendix [SENSe:]FREQuency:DEModulation < demodulation _freq > Set or query demodulation frequency [SENSe:]FREQuency:DEModulation? [SENSe:]FREQuency:MODE <op_mode> Set or query measurement mode [SENSe:]FREQuency:MODE? [SENSe:]FREQuency:PSCan:CENTer Set or query the center frequency of the RF <center_frequency> panorama [SENSe:]FREQuency:PSCan:CENTer? [SENSe:]FREQuency:PSCan:SPAN <span_frequency> Set or query the bandwidth of RF panorama [SENSe:]FREQuency:PSCan:SPAN? [SENSe:]FREQuency:PSCan:STARt Set or query the starting frequency of panoramic...
- Page 160 Appendix [SENSe:]MSCan:HOLD:TIME <hold_time> Set or query list scan hold time [SENSe:]MSCan:HOLD:TIME? [SENSe:]PSCan:COUNt <cycle_count> Set and query the number of RF panoramic scans [SENSe:]PSCan:COUNt? [SENSe:]PSCan:STEP <res_bandwidth> Set or query the step value of RF panoramic scan [SENSe:]PSCan:STEP? [SENSe:]ROSCillator:EXTernal:FREQuency? Query external reference frequency [SENSe:]ROSCillator[:INTernal]:FREQuency? Query internal reference frequency [SENSe:]ROSCillator:SOURce <source>...
- Page 161 Appendix SYSTem:CLOCk:SETDate? Check the local date according to the set clock SYSTem:CLOCk:SETTime? Check the local time according to the set clock SYSTem:CLOCk:STARt <start_mode> Set or query the clock start method after clock adjustment SYSTem:CLOCk:STARt? SYSTem:COMMunicate:LAN:GATeway <ip-address> Set or query the default gateway SYSTem:COMMunicate:LAN:GATeway? SYSTem:COMMunicate:LAN:SUBMask <subnetmask>...
- Page 162 Appendix SYSTem:IF:REMote:MODE <if_mode> Set or query the mode of digital IF stream data SYSTem:IF:REMote:MODE? SYSTem:KLOCk <set-lock> Set or query touch screen lock status SYSTem:KLOCk? SYSTem:PRESet:FACTory Reset the device to factory settings SYSTem:PRESet:MEASurements Reset the device to the measurement settings Reboot the device and reset the device to its SYSTem:RESet:COLD default settings SYSTem:RESet[:WARM]...
- Page 163 Appendix TRIGger[:SEQuence]:COUNt? Set up IQ data to trigger reporting of compound TRIGger[:SEQuence]:COMPlex:COMMand commands TRIGger[:SEQuence]:DATA:SUM <data_sum> Set or query the total number of trigger points TRIGger[:SEQuence]:DATA:SUM? TRIGger[:SEQuence]:DELay <trig_delay> Set or query the trigger delay TRIGger[:SEQuence]:DELay? TRIGger[:SEQuence]:ENABle <Boolean> Set or query the trigger enable status TRIGger[:SEQuence]:ENABle? TRIGger[:SEQuence]:IQ:DATA:FORMat <iqdata_format>...
-
Page 164: Annex C Zoom Table Of Failure Information
Appendix Annex C Zoom table of failure information Table C.1 Table of Local Error Messages Failure code Key failure field Description Touch screen initialization failed, please check the hardware USBINITERR and driver LAN port initialization failed, please check the hardware and LANINIT ERR driver Functional hardware initialization failed. - Page 165 Appendix Power Temp Abnormal temperature in the power supply area CPU BD Temp CPU board temperature abnormal Battery Perc Lithium battery power abnormalities CPU CP Temp CPU chip temperature abnormalities BBS DEV Opening audio acquisition equipment failed BBS INIT Initializing audio acquisition equipment failed BBS WRKP Setting audio equipment working parameters failed A2 LO1 Temp...
- Page 166 Appendix Table C.2 Remote control error message table Failure code Description (English) No Error -100 Command error -101 Invalid character -102 Syntax error -103 Invalid separator -104 Data type error -105 GET not allowed -108 Parameter not allowed -109 Missing parameter -111 Header separator error -112...
- Page 167 Appendix -223 Too much data -224 Illegal parameter value -240 Hardware error -241 Hardware missing -250 Mass storage error -257 File name error -258 Media Protected -291 Out of memory -292 Referenced name does not exist -293 Referenced name already exists -300 Device-specific error -350...
Need help?
Do you have a question about the 3943B and is the answer not in the manual?
Questions and answers