Table of Contents
Advertisement
Quick Links
Advertisement
Table of Contents

Related Manuals for BPC instruments uFlow

Summary of Contents for BPC instruments uFlow
- Page 1 µFlow Gas flow meter Operation and Maintenance Manual...
- Page 3 µFlow...
- Page 4 This document contains proprietary information that is protected by copyright. All rights are reserved. No part of this publication may be reproduced in any form whatsoever or translated into any language without the prior, written permission of BPC Instruments AB. Copyright © 2022 BPC Instruments AB...
-
Page 5: Table Of Contents
ABLE OF ONTENTS PREFACE ..........................1 GENERAL INFORMATION ....................2 Conventional Gas Flow Meters ..................2 Advantages of µFlow over Conventional Flow Meters ........... 2 DELIVERY CHECKS......................4 Flow Gas Meter Box Content ..................4 Optional Equipment ......................4 PRE-COMMISSIONING...................... 7 QUALITY RULES AND RECOMMENDATIONS ............ -
Page 6: Preface
1 PREFACE BPC Instruments AB (BPC) is a privately held company and market leader in the area of advanced control technologies for the commercial biogas industry, providing technologies and services that support the efficient design and operation of biogas plants & processes. The company was founded in 2006, bringing to market more than 15 years of industry leading research in the area of instrumentation, control and automation of anaerobic digestion processes. -
Page 7: General Information
2 GENERAL INFORMATION Anaerobic biodegradation processes are gaining in interest among industry and local governments, due to their ability to produce energy and reduce sludge yields. In the anaerobic biodegradation process, gas flow rate represents a key parameter for evaluating the performance of a process. - Page 8 • Standard analogue current signal output for automatic data acquisition (4-20 mA) • Low maintenance requirements • LCD display for visualisation of variables • The design and calibration delivers highly precise measurements • One of the most cost competitive solutions on the market today.
-
Page 9: Delivery Checks
3 DELIVERY CHECKS At delivery, unpack and check that the contents match with what is listed below in the Section “Box Content”. If the packaging or the equipment is broken or damaged at delivery, please: a) Document and take photos of the parts and packaging. b) Inform the transport company at the time of delivery. - Page 10 (2) Universal Data Logger with Ethernet interface The hardware module includes eight analog current input channels for high-performance control and monitoring applications. The system features analogue current input ranges of 4 to 20 mA. To protect against signal transients, the module includes a channel-to-earth ground double isolation barrier for safety and noise immunity.
- Page 11 support up to 8 µFlow devices. A Data Logger unit is not included in the standard µFlow package. A screenshot of the software user interface is presented below.
-
Page 12: Pre-Commissioning
4 PRE-COMMISSIONING The following items are not included in the delivered µFlow, however they will/may be required to operate the flow meter: • Data acquisition system available from BPC • Additional wall socket adapters (plugs/contacts), as the ones supplied are according to European, US or UK standards, depending on original purchase order •... -
Page 13: Safety Considerations
6 SAFETY CONSIDERATIONS The µFlow should be used in an environment with good ventilation, preferably in a laboratory fume hood, especially when this detection unit is connected to bioreactors, which are generating very high volumes of toxic or slightly aggressive gases. Always be cautious when handling electrical devices close to water. -
Page 14: Equipment Description (Design/Function)
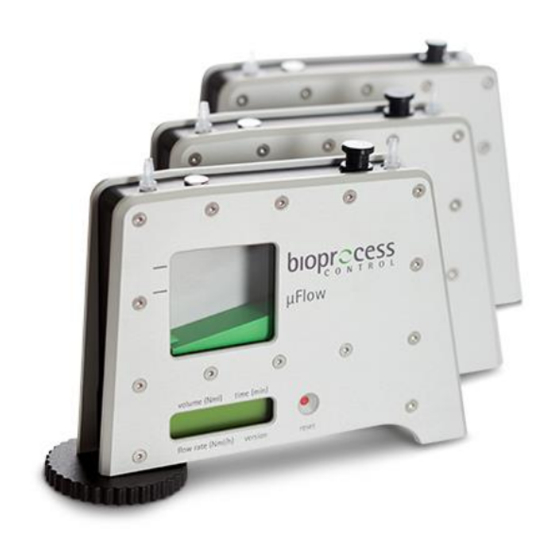
7 EQUIPMENT DESCRIPTION (DESIGN/FUNCTION) The µFlow is a flow meter for ultra-low gas flow detection. Its design and highly precise calibration delivers a measurement precision of ± 1%, with a resolution of about 10 ml. Therefore, the µFlow meets the needs of the most demanding biogas/biofuel labs and user applications. -
Page 15: Μflow Gas Meter With Front Power And Analogue Output Port
7.1 µFlow Gas Meter with Front Power and Analogue Output Port (1) Outlet for gas flow (7) Glass window for visual inspection of the flow cell movement (2) Level gauge (8) Liquid Crystal Display (LCD) for real time visualisation of normalised gas volume & flow rate, duration of the experiment and version of the software (3) Port for filling water... -
Page 16: Μflow Gas Meter With Side Power And Analogue Output Port
7.2 µFlow Gas Meter with Side Power and Analogue Output Port (1) Outlet for gas flow (7) Glass window for visual inspection of the flow cell movement (2) Level gauge (8) Liquid Crystal Display (LCD) for real time visualisation of normalised gas volume & flow rate, duration of the experiment and version of the software (3) Port for filling water... -
Page 17: Charger For The Μflow Gas Flow Meter
µFlow meter with the combined power input and analogue output port on the Angle view of the side: 7.3 Charger for the µFlow Gas Flow Meter The power input port is located at different positions on the two versions of the µFlow meters. The charger is inserted at (11b) on the front of the µFlow meter described in chapter 7.1, and at (11) on the side on the µFlow meter described in chapter 7.2. -
Page 18: Flow Gas Flow Meter Technical Characteristics
7.4 Flow Gas Flow Meter Technical Characteristics ENERAL Measuring resolution: 10 ml Measuring range: 20 to 4000 ml/h Signal output for flow rate: 4-20 mA Repeatability: 1% Working principle: liquid displacement & buoyancy Built-in sensors: pressure and temperature LCD display: normalised gas flow (NmL/h), volume (Nml) and time (min) Materials: high quality aluminium Dimension: 19×14×6 cm Weight: 0.180 kg... -
Page 19: Data Logger System Technical Characteristics
7.5 Data Logger System Technical Characteristics The PC-based Data Logger system for µFlow consists of a hardware module controlled by an easy-to-use software program. OGGER ARDWARE The hardware module has 8 plug & play terminal connectors that provide connections for 8 analog input channels. -
Page 20: Operation
8 OPERATION In this section, references are given to pictures in the Chapter 7 (Equipment Description) in the form of a number within parenthesis, e.g., (1). 8.1 Before Start up NSTALLATION OF THE µFLOW GAS METER a) Install the instrument on a flat and stable surface. Use appropriate instrumentation (i.e., bubble level device) to verify the horizontality of the surface and to adjust its position if it is needed. - Page 21 NSTALLATION OF THE OGGER HARDWARE a) Connect the Data Logger to the computer. The Data Logger (in the left picture below) uses an USB interface, and the Universal Data Logger (in the right picture below) uses an Ethernet cable. (The pictures show the back of the devices.) b) It is very important that the blue (or grey for some versions) end of the analogue signal cable is used when inserting the cable into the port on the Data Logger.
- Page 22 c) Insert the other end of the analogue signal cable to a µFlow Gas Meter. Important: If the Universal Data Logger is used, please refer to the Universal Data Logger Operation and Maintenance Manual, before connecting the signal cables. The Universal Data Logger has more options for measuring parameters and signal processing types.
-
Page 23: Start Up
OVING OF THE ILLED a) Care should be taken if the µFlow has to be moved after having been filled with packing liquid. In this case, transportation should be done in vertical position in order to avoid packing liquid from exiting the unit. 8.2 Start up At this stage, it is assumed that the µFlow is already installed according to section 8.1, the gas source is connected to the inlet port of the gas flow and the power supply also is connected. -
Page 24: End Of Operation
8.4 End of Operation a) Note the total running time if this is of interest. In the displayed values, the last data collected will be from the last opening of a cell. b) If an automatic data acquisition system is connected to the unit, then generate a report. Download the report and open it to make sure that the report has been generated properly and that no errors occurred while downloading the file. -
Page 25: Μflow Software
FLOW SOFTWARE µ 10.1 Installation of the Flow Data Logger Software (Windows 8) The procedure below describes the installation of the Flow Data Logger Software. The installation is divided into two steps. The files needed for the first part is collected in a folder called “MyFlowDAQ Additional Installers”, which also includes required installations of Adobe Reader and Open Office. - Page 26 2. Open the “Volume” folder. 3. Select the “setup.exe” file and open it.
- Page 27 4. When the setup.exe file is opened, installation will be initialised, and a green bar will show the progress. Select a destination directory for the “MyFlowData Logger” program files, and for the National Instrument products files that are part of the software.
- Page 28 5. Click next.
- Page 29 6. When the installation summary shows up, start the installation by clicking “Next”.
- Page 30 7. A window will show the installation progress.
- Page 31 8. A message will follow when the installation is completed. Click “Next” to finalise. 9. When the installation has been confirmed as successful, restart the computer. 10. Start the second part of the installation by opening the folder called “μFlow Installers”.
- Page 32 11. Open the “Volume” folder. 12. Select the setup.exe file and open it.
- Page 33 13. The installation is started, and a green status bar shows the progress.
- Page 34 14. Select a destination directory for the files.
- Page 35 15. Start the installation by clicking “Next”.
- Page 36 16. The green status bars show the progress.
- Page 37 17. Click “Finish” to complete the installation. 18. When the software installation has finished, use the power adaptor to connect the Data Logger hardware to a power outlet. Connect the Data Logger to a computer by the USB cable.
- Page 38 19. The Data Logger software can be uninstalled in the Windows Control Panel. The National Instruments files need to be uninstalled separately.
-
Page 39: Flow Data Logger Software User Guide
10.2 Flow Data Logger Software User Guide The software interface is organised in a number of pages, all reachable from the start page named “Home”. The pages are laid out in the same order that an experiment is set up, executed, monitored and finally documented. - Page 40 Load Data The Load Data page allows the user to load data from a specific time interval, and to generate a report of it. The report contains experiment data for each reactor/line. System This page contains general information related to the software version, Data Logger hardware and contact details.
- Page 41 SETTINGS This page is used to set up an experiment. Enter the name of the first reactor/line under “Channel 1”. (A channel name is limited to 10 characters.) In the “Use” attribute, select “In use”. Save the above settings by pressing the “Apply” button. Repeat this procedure for all the channels that will be used in the experiment, and press “Apply”...
- Page 42 RAPH This section shows the Graphs page. Start logging To start data logging, the user has to press the green button labeled “Start logging”. The button will turn grey and it will change its name to “Stop logging”. Under the “Start /Stop logging” button, there are checkboxes for all 8 channels. They can be used to hide and select which channels that should show up in the graph.
- Page 43 Scrolling and zooming in the graph plot By right clicking in the graph plot, a menu will show up. Choose “Visible Items” => “Graph palette” to find a bar with 3 buttons, where some zooming and scrolling tools will be found. The button with the hand icon can be used to move the graph in any direction.
- Page 44 Right clicking in the graph area (selected commands) Clear graph will just clear the curves in the graph view, but all data that has been recorded will be kept. The graph can be reloaded by pressing the “Load Data” button in the “Load Data”...
- Page 45 Colour This setting allows the user to define a different colour for the particular line. Export A picture of the current view of the graph can be exported as a picture, excel file, or added to the clipboard. (To export the experiment data, see the Load Data page guide.) In the “Load Data”...
- Page 46 Generate Report By pressing the button “Generate report”, a pop-up window will be displayed with the following message: “The data load in the graph is at an interval of 15 minutes. Choose at which interval you would like to save your report: 15 minutes, hour, or daily”. After selecting the unit for the time (e.g., quarter of hour, hour or day) and pressing “OK”, the data will be saved into a *.csv (comma-separated values) file.
- Page 47 YSTEM This section shows the System page. The page contains general information about the software, Data Logger hardware (i.e., serial number, IP address) and contact details for troubleshooting and support.
Need help?
Do you have a question about the uFlow and is the answer not in the manual?
Questions and answers