Table of Contents
Advertisement
Quick Links
943-TGXeNA
Automatic Process UV Spectrophotometer for Tail Gas Analysis
OPERATION MANUAL
P/N:
Revision 4
April 2020
Galvanic Applied Sciences, Inc.
7000 Fisher Road S.E.
Calgary, Alberta, T2H 0W3
Canada
Toll Free (North America): 1 800 458 4544wrong number
International +1 978 848 2701 (wrong number)
E-mail:
support@galvanic.com
www.galvanic.com
Advertisement
Table of Contents
Troubleshooting

Subscribe to Our Youtube Channel
Related Manuals for galvanic 943-TGXeNA

Summary of Contents for galvanic 943-TGXeNA
- Page 1 Automatic Process UV Spectrophotometer for Tail Gas Analysis OPERATION MANUAL P/N: Revision 4 April 2020 Galvanic Applied Sciences, Inc. 7000 Fisher Road S.E. Calgary, Alberta, T2H 0W3 Canada Toll Free (North America): 1 800 458 4544wrong number International +1 978 848 2701 (wrong number) E-mail: support@galvanic.com...
- Page 2 No part of this manual may be reproduced or transmitted in any form or by any means without the written permission of Galvanic Applied Sciences, Inc. Note: Changes or modifications not expressly approved by Galvanic Applied Sciences, Inc. could void the user's authority to operate the equipment.
-
Page 3: Table Of Contents
Table of Contents ........................13 EPAIRED RODUCTS ..................13 IMITATION OF EMEDY AND IABILITY 1 943-TGX NA T ............14 ECTION NALYZER NTRODUCTION .......................... 14 VERVIEW ......................14 NALYTICAL ETHOD ......................15 NALYZER ESIGN ....................16 AMPLE ANDLING YSTEM ................... 17 YSTEM PERATING ONTROL... - Page 4 3.3.2.4 Loss of Purge .................... 41 ..................... 43 ECTION OCAL YSTEM ONTROL .......................... 43 VERVIEW ............43 SING THE OCAL ISPLAY AND ANDHELD EYPAD 4.2.1 Local Display User Interface ................43 4.2.2 The Handheld Keypad ..................44 ......................45 NALYSIS ANEL 4.3.1 Online/Offline Mode Toggle .................
- Page 5 5.2.3 Indicators Page ....................76 5.2.4 Spectrum Page..................... 78 1.1.1 5.2.5 Absorbance Page ..................80 ....................83 ONFIGURATION ECTION 1.1.2 5.3.1 Parameters Page ..................83 1.1.3 5.3.2 Modbus Page ....................86 5.3.2.1 Enron Modbus Format ................89 5.3.2.3 Modicon 16 Format ................... 90 5.3.2.4 Modicon with Floating Point Format ............
- Page 6 12.3 M ....................139 ANUAL VERRIDE 12.3.1 Analog Output Calibration and Testing .............. 140 12.3.2 Testing the Digital Input ..................142 12.3.3 Testing Digital Outputs ..................142 NDEX Figures 1: M 943-TGX NA ...................... 16 IGURE ODEL 2: M ....................22 IGURE OUNTING IMENSIONS...
- Page 7 42: N ....................68 IGURE ETWORK ANEL 43: C ...................... 69 IGURE ONTROLLER OARD 44: B GUI S ................70 IGURE RIMSTONE PLASH CREEN 45: N ................... 71 IGURE AVIGATION ENU AND 46: A ................72 IGURE NALYSIS ECTION NALYSIS 47: T ............
- Page 8 Tables 1: A ................ 19 ABLE MBIENT EMPERATURE ANGE BY ODEL 2: S ..................20 ABLE TEAM UPPLY EQUIREMENTS 3: S ...................... 39 ABLE TATUS ELAY TATES 4: S ..................... 40 ABLE ERVICE ELAY TATES 5: M ......................40 ABLE ELAY TATES 6: C...
- Page 9 Safety Symbols used in Manual The Danger symbol indicates a hazardous situation that, if not avoided will result in death or serious injury. The Warning symbol indicates a hazardous situation that, if not avoided could result in death or serious injury. The Caution symbol with the safety alert symbol indicates a hazardous situation that, if not avoided could result in minor or moderate injury.
- Page 10 Any safety recommendations or comments contained herein are suggested guidelines only. Galvanic Applied Sciences Inc. bears no responsibility and assumes no liability for the use and/or implementation of these suggested procedures. This system, when operating in its normal mode, and/or when it is being serviced, maintained, installed and commissioned contains items which may be hazardous to humans if handled or operated incorrectly or negligently.
- Page 11 Never expose human skin to the radiation from the optical fibres. 943-TGXeNA (CSA) Class I, Division 2, Groups C and D, Temperature Code T3, Type Z Purge...
- Page 12 Manufacturer’s Warranty Statement Galvanic Applied Sciences Inc. (“Seller”) warrants that its products will be free from defects in materials and workmanship under normal use and service in general process conditions for 12 months from the date of Product start-up or 18 months from the date of shipping from Seller’s production facility, whichever comes first (the “Warranty Period”).
-
Page 13: Repaired Products
outside the environmental specifications for the instrument, use by unauthorized or untrained personnel or improper site maintenance or preparation. • Products that have been altered or repaired by individuals other than Seller personnel or its duly authorized representatives, unless the alteration or repair has been performed by an authorized factory trained service technician in accordance with written procedures supplied by Seller. -
Page 14: 943-Tgx Ena Tail Gas Analyzer Introduction
943-TGXeNA Tail Analyzer Section 1 Introduction Overview The use of a Tail Gas Analyzer to assist in the control of combustion air to acid gas ratios in Claus Sulfur Recovery Plants is a standard procedure in industry. The plant tail gas is analyzed using ultraviolet spectroscopy and an output signal that corresponds to the air requirement is determined. -
Page 15: Analyzer Design
This keypad is connected to a port on the control cabinet door. The Model 943-TGXeNA uses a fully electric heating system for the measurement cell block and the associated sample handling system. A drawing of the Model 943-TGXeNA is shown in Figure 1. -
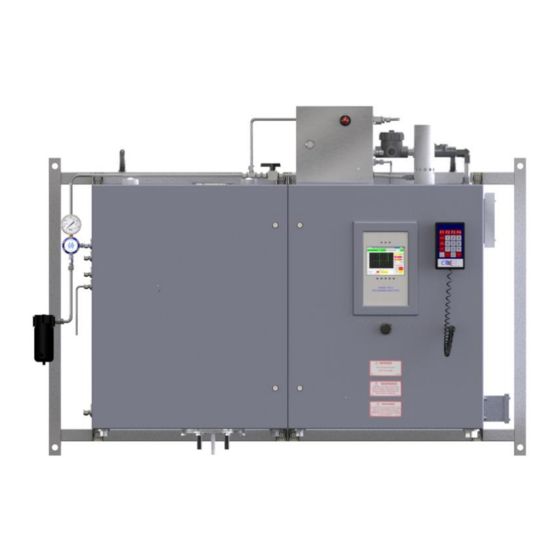
Page 16: Sample Handling System
Figure 1: Model 943-TGXeNA Sample Handling System The Analyzer system utilizes a close coupled mounting arrangement of the measurement cell block to the tail gas process sampling point to minimize the sample handling system length. The short length allows for analyzer response times to be optimized while sample transport problems are mitigated. -
Page 17: System Operating Control
absorbing species are present. To the sample system, zeroing and back purging are the same thing. The default state (power ‘off’) of the analyzer is to have the sample system in the back purge mode. Valving is provided for isolating the sample system components from the process stream. -
Page 18: Contents Of This Manual
Contents of this Manual This manual contains the following information: Section 1: 943-TGXeNA Tail Gas Analyzer Introduction presents introductory information about the analyzer system. Section 2: Installation describes unpacking the analyzer, installing it in the facility and interfacing with other devices. -
Page 19: Section 2 Installation
2.2.2 Space Requirements The 943-TGXeNA system is composed of two cabinets mounted side by side on a mounting frame. The dimensions of each cabinet are 30” (76 cm) H x 24” (61 cm) W x 12” (30 cm) D. -
Page 20: Instrument Air
The instrument air must be clean and dry, and meet the requirements for instrument air stipulated in ANSI/ISA Standard 57.3-1975 R (1981). 2.2.5 Steam For the Model 943-TGXeNA, a single low pressure steam supply is required, as indicated in Table 2. Table 2: Steam Supply Requirements... -
Page 21: Installation Procedure
227 kg / 500 lbs per ring. Installation Procedure The installation procedure of the 943-TGXeNA analyzer system consists of the following steps 1. Mounting of the Analyzer System (Section 2.4.1) 2. Mating of the Process and Analyzer System Flanges (Section 2.4.2) 3. -
Page 22: Mounting Of The Analyzer System
2.4.1 Mounting of the Analyzer System The framework that is used in the analyzer system must be securely attached to a support structure provided by the end user. The support structure must be positioned so that when the analyzer framework is bolted in place, the flange of the analyzer cabinet and the process sample access point are correctly aligned. -
Page 23: Mating Of The Process And Analyzer System Flanges
Figure 3: Service Connections 2.4.2 Mating of the Process and Analyzer System Flanges The analyzer is shipped with a 316 SS blind flange plate and gasket mounted inside the oven enclosure to prevent the process gas from flowing into the compartment before installation of the sample probe assembly. -
Page 24: Installation Of The Sample Probe
If all the above conditions are satisfied: 1. Put the new gasket in place and move the analyzer system into position placing the four bolts through the steam jacketed nozzle flange holes. 2. Place the four nuts onto the bolts and tighten. 3. -
Page 25: Figure 5: Oven Enclosure Tubing Removed
Tubing removed Figure 5: Oven Enclosure Tubing Removed 3. Insert the probe into the packing gland at the bottom of the oven indicated in Figure 6 until it reaches the steam jacketed ball valve. Sample probe Packing gland Figure 6: Inserting the Sample Probe 4. -
Page 26: Figure 7: Oven Enclosure Tubing Reinstalled
Explosive, toxic and hot gases and molten sulfur may be released once the stream jacketed ball valve is opened. All company and/or regulatory agency safety procedures and rules should be adhered to. Breathing apparatus and personal protective equipment (ie. gloves, coveralls and protective eye wear) should be worn and a safety person(s) should be observing. -
Page 27: Connection Of The Ac Power Service
‘sealed’. DO NOT energize the AC power supply to the analyzer at this time. The analyzer system will be powered up at the time of commissioning by Galvanic Applied Sciences Inc. personnel. 2.4.4 Connection of the Analog Signal Cables The conduit connector for the Analog Signals, with the label ‘Analog Signals’, is provided on... -
Page 28: Connection Of The Digital Signal Cables
Figure 9: Location of Analog Output Terminals on IO Board The user may connect to any or all of the available analog output signal terminals as per their specific requirements. The analog outputs are all loop powered. When loop power is provided and the current loop between the analyzer and the external control computer is complete, green LEDs above the connection terminals will illuminate for each connected analog output signal connected. -
Page 29: Connection Of The Instrument Air
Figure 10: Location of Digital Output Terminals on IO Board The user may connect to any or all of the available digital signal terminals as per their specific requirements. For a detailed drawing showing the digital signals connections on the IO board, refer to the DC Signals and Wiring Diagram drawing (Figure 86) in Section 9 of this manual. -
Page 30: Figure 11: Location Of Instrument Air Regulator
Figure 11: Location of Instrument Air Regulator Do not adjust the instrument air pressure with this regulator until all internal tubing has been installed in the oven enclosure as shown in Figure 8. Once all the tubing is installed, the instrument air pressure indicated on the gauge can be adjusted to a suitable value (typically 30-50 psig). -
Page 31: Connections Of Steam
control cabinet door is latched closed. Once normal purge flow has been established, the conduit connections are sealed, and the control cabinet door is latched shut, the purge indicator on the front of the purge control box will change colour from red (insufficient cabinet pressure) to green (normal purge pressure). -
Page 32: Section 3 Operation
Section 3 Overview The 943-TGXeNA analyzer system is designed to operate automatically with a minimum need for human intervention. Once installation, commissioning and initial start-up have been completed, the only human intervention required is when the system indicates a problem or when routine preventative maintenance is scheduled. -
Page 33: Flow Control Settings
All valves are clearly labeled according to their title and function. The Flow Diagram drawing shown in Figure 14 provides a schematic of the flow streams in the analyzer sample handling system. Figure 14: Sample System Flow Diagram In normal operation, valves V1, V3, and V5 inside the oven enclosure are open. Isolation on/off block valves V2 and V4 are provided in the oven enclosure to do the sample probe steam-out procedure, if required. -
Page 34: Cabinet Cooler Air Valve
The safe purge indication (Red to Green flag) occurs at a control cabinet pressure positive pressure of 1" H O (0.25kPa) above atmospheric pressure. The over-pressure relief valve opens at a control cabinet pressure of 4" H O (1kPa) above atmospheric pressure. The normal control cabinet purge flow rate is 1.3 SCFM (2.2m /h), as governed by selected orifices mounted in the cabinet purge vents. -
Page 35: Condenser Cooling Air Flow Adjust Valve
3.2.3 Condenser Cooling Air Flow Adjust Valve Sulfur vapour is always present in tail gas streams in sulfur recovery units. However, the presence of this sulfur vapour inside the analyzer sample probe and sample handling system is detrimental for two reasons. Firstly, sulfur vapour can interfere with the measurement of both hydrogen sulfide and sulfur dioxide. -
Page 36: Zero Air Flow Adjust Valve
The concentration of sulfur vapour in the process sample gas that makes it into the probe and into the measurement cell is measured and displayed on the analyzer display as Sulfur Vapour (Svap). The Condenser Cooling Air Adjust Valve can be adjusted to reduce the sulfur vapour concentration. -
Page 37: Aspirator Drive Air Flow Adjust Valve
3.2.5 Aspirator Drive Air Flow Adjust Valve The Aspirator Drive Air Flow Adjust Valve indirectly controls the rate of process sample gas extraction from the tail gas duct. The aspirator drive air is plumbed to a venturi-type eductor integral to the measurement cell block, as shown in the exploded view of the measurement cell in Figure 17. -
Page 38: System Regulator
Analyzer Outputs The 943-TGXeNA analyzer generates both analog and digital output signals for connection to the users’ plant control system. The analog output signals are used to output calculated concentration and other pertinent analysis values, and are user-configurable for range, output parameter, and output behaviour. -
Page 39: Digital Outputs (Relays)
concentration outputs are configured for Track, though this is entirely up to the user to decide. The value output by each analog output is updated once per second. The configuration of the analog outputs can be done either using the local display and keypad, as described in Section 4.8.1, or by using the Web GUI, as described in Section 5.4. -
Page 40: Service
3.3.2.2 Service The Service output indicates whether there is an issue with the analyzer that requires operator attention. Table 4 describes the Service relay states. Table 4: Service Relay States Condition Display Indicator Colour Explanation All monitored system parameters are Normal Green within normal limits. -
Page 41: Control
and the analyzer concentration measurements to return to stable process values prior to returning to the Run state. If there are any faults currently present (i.e. Status relay is in fault state) the Mode indicator CANNOT switch to Calibrate – Calibration is ONLY possible when all fault conditions are cleared, and the Status relay is in the Normal condition. - Page 42 door is opened, the purge indicator on the outside of the purge control box will be red and the Loss of Purge relay will be in the fault state. The relay contacts of the Loss of Purge relay MUST be connected to a plant alarm system in a continuously attended location, such as in the plant control room, in order to maintain the hazardous location certification of the analyzer.
-
Page 43: Section 4 Local System Control
Local System Control Section 4 Overview The operator can locally control the analyzer via the full colour, multi-page display mounted in the control cabinet in conjunction with the hand-held keypad that can be connected to a port on the control cabinet door. The keypad, in conjunction with the local display, can be used to view a variety of analysis and status information, as well as to make changes to some analyzer operational parameters. -
Page 44: The Handheld Keypad
The coloured indicator circle at the top right of the display is visible on all panels. It provides a quick indication of the analyzer status. When it is green, the analyzer has no active faults or warnings - all monitored parameters are within their specified ranges. When it is yellow, this indicates that the Service relay is in the Warning state. -
Page 45: Analysis 1 Panel
The handheld keypad should only be connected to the analyzer or disconnected from the analyzer when the installation location is known to be non-hazardous. Analysis 1 Panel The Analysis 1 panel shown in Figure 18 shows important current analytical parameter results, status indicators, and operator controls. -
Page 46: Air Demand
Figure 21: Analysis 1 Concentration Fields The analyzer’s physical measurement range, which is determined by the length of the measurement cell, is optimized for typical on-ratio (that is to say, non-upset) concentrations of H S and SO . COS and optionally CS concentrations are also displayed here. -
Page 47: Relay Indicator Fields
Figure 24. Figure 24: Manual Zero Control The Model 943-TGXeNA performs a zero calibration in order to check and adjust the analyzer’s zero baseline. It is ONLY performed when the analyzer is in back purge and the measurement cell is filled with a gas that doesn’t absorb UV radiation in the wavelength range of interest (i.e. -
Page 48: Back Purge Indicator And Control
existing faut conditions are cleared and prior to the analyzer returning to sampling mode, or automatically according to the set Auto Calibration Frequency (refer to Section 4.8.4 for more details on Auto Calibration). No span calibration is required under normal circustances for an installed analyzer. -
Page 49: Analysis 2 Panel
Figure 25: Back Purge Indicator and Manual Controls The back purge indicator shows the current back purge status. If it is green, this indicates that the analyzer is currently drawing sample into the measurement cell. If it is red, this indicates that the analyzer is currently in back purge, either due to the analyzer being manually placed into back purge OR due to a fault condition causing an automatic back purge OR because the analyzer is currently carrying out a zero calibration cycle. -
Page 50: Online / Offline Control
4.4.1 Online / Offline Control At the top right of the Analysis 2 panel is the Online / Offline toggle control, as shown in Figure 27. Figure 27: Online / Offline Control This toggle has the same function on the Analysis 2 panel as it does on the Analysis 1 panel. Refer to Section 4.3.1 for details. -
Page 51: System Operating Parameters
4.4.3 System Operating Parameters The Analysis 2 panel also displays several important system operating parameters, as shown in Figure 29. Figure 29: System Operating Parameters The approximate normal operating ranges for these parameters and an explanation of each parameter is given in Table 8. Table 8: System Operating Parameters Parameter Operating Range... -
Page 52: Figure 30: Indicators Panel
Figure 30: Indicators Panel The top 6 rows in the historical grid are for fault conditions, while the bottom five rows are for warning conditions. Every time a fault or warning occurs, an X is placed in the farthest right cell for that fault or warning (i.e. -
Page 53: Fault Conditions
4.5.1 Fault Conditions Table 9 describes each of the fault conditions listed in the fault table on the Indicators panel. Table 9: Analyzer Faults Fault Explanation Measurement cell temperature is either below Low Cell Cell Temperature Temperature setpoint or above High Cell Temperature setpoint. -
Page 54: Spectrum Panel
Spectrum Panel The Spectrum panel shown in Figure 31 shows the current transmission spectrum being received by the control computer from the analyzer’s spectrometer. Figure 31: Spectrum Panel The transmission spectrum shows the intensity of ultraviolet light, in A/D counts, being received at every pixel of the spectrometer. -
Page 55: Table 11: Spectrometer Parameters
Table 11: Spectrometer Parameters Parameter Explanation Displays the peak height of the transmission spectrum, in Peak Height A/D counts. Should be approximately 28000-29000 when analyzer is in back purge mode. Displays the intensity of light being received at the first First Vector Pixel vector pixel, in A/D counts. -
Page 56: Factory Reference
Figure 33: Integration Period Dialog Box The current value of the integration time is displayed in the Old Value field. A new integration period can be entered into the New Value field using the white numerical keys and the decimal point key. -
Page 57: Absorbance Panel
Take note of the following rules-of-thumb when comparing the pink trace of the factory reference with the red trace of the current transmission spectrum: • The factory reference should be largely similar to the current transmission spectrum when the analyzer is in back purge mode. If it is not, there is likely an issue with the analyzer optical system. -
Page 58: Figure 36: Absorbance Spectrum For H 2 S
The absorbance spectrum is calculated by subtracting the current transmission spectrum from the transmission spectrum that was obtained the last time the analyzer carried out a zero calibration cycle OR when the New Reference button was pressed on the Spectrum panel, whichever was most recent. -
Page 59: Config Panel
Config panel could result in the analyzer becoming unable to function correctly. The parameters on this panel should ONLY be changed by factory-trained personnel or under the direction of Galvanic Applied Sciences Inc. 4.8.1 Outputs The Outputs sub-panel shown in Figure 38 is used to configure the four analyzer analog... -
Page 60: Table 12: Analog Output Parameters
then press ENTER to move to the next analog output. When on Analog Output 4, pressing this button again will move back to Analog Output 1. The configuration options available for all four analog outputs are identical. The output parameters available are listed in Table 12. Table 12: Analog Output Parameters Parameter Description... -
Page 61: Calculation Sub-Panel
Unauthorized modification of the values of ANY of the calculation parameters listed in on this sub-panel could negatively affect the validity of data output by the analyzer. Calculation-related parameters should ONLY be changed by factory- trained personnel or under the direction of Galvanic Applied Sciences Inc. 4.8.2.1 Calculation Parameters The calculation parameters outlined in red are explained in Table 13. -
Page 62: Cell Length
Table 13: Calculation Parameters Parameter Normal Explanation Value Plant factor term used in the Air Demand calculation (Section 1.1). Gain term applied to the air demand output to adapt the process variable (Air Demand) to the plant’s front-end air adjustment capability. Defined by the equation below: −��... -
Page 63: Fixed Temperature And Pressure
4.8.2.3 Fixed Temperature and Pressure The calculated concentrations are compensated for both temperature and pressure. Typically, this temperature and pressure compensation uses the live values from the analyzer’s cell temperature and pressure measurement sensors. However, there is also the capability to use static values of temperature and pressure for this compensation. To use a Fixed Temperature and / or a Fixed Pressure value for compensation of concentration values, use the FIELD NEXT / FIELD PREV keys to highlight the checkbox of the fixed value to be used, then press ENTER to place an X in the box. -
Page 64: Backlight Adjustment
trend lines. The maximum time range that can be displayed on the trend graphs on both panels is fifteen minutes. Changing the displayed scale on the Analysis 1 / Analysis 2 trend graphs does NOT change the scale on the analog outputs for these parameters. These scales are for display purposes ONLY and have no effect on any other aspect of the analyzer operation. -
Page 65: Timers
To edit a parameter on this sub-panel, use the FIELD NEXT / FIELD PREV keys to highlight the parameter to be edited, then press ENTER to bring up the data entry dialog box. Enter the desired value for the parameter using the numerical keys and the decimal point key, then press ENTER to save. -
Page 66: Table 15: Temperature Control Parameters
Table 15: Temperature Control Parameters Parameter Normal Explanation Value Temperature control setpoint for the measurement cell. The setpoint for the cell MUST be set well above the condensation Cell point of sulfur vapour (≈120°C) to avoid plugging due to 150°C Setpoint accumulation of liquid sulfur inside the analyzer sample handling system. -
Page 67: Alarms
4.8.4.3 Alarms The parameters in the red Alarms box are described in Table 16. Table 16: Alarms Parameters Parameter Normal Explanation Value Measurement cell fault temperature setpoint. If the cell temperature falls below this setpoint, a cell temperature fault will be activated, causing the Status relay to switch to Fault state and the Control relay to switch to Manual state. -
Page 68: Network Sub Panel
4.8.5 Network Sub Panel The Network sub-panel shown in Figure 42 is used to view the network settings for the local Ethernet connection and view/edit the network settings for the remote Ethernet connection. Figure 42: Network Sub-Panel 4.8.5.1 Direct Connect The Direct Connect box shows the network parameters for the local Ethernet port on the front door of the analyzer’s control cabinet, below the display screen. -
Page 69: Figure 43: Controller Board
mounted on the inside of the control cabinet door, behind the analyzer display. The location of the Ethernet port on the controller board is shown in Figure 43. Figure 43: Controller Board The Ethernet cable connecting from the analyzer to the plant’s LAN can be connected to the indicated port (the other port is used to connect from the controller board to the Ethernet port on the analyzer control cabinet door). -
Page 70: Section 5 Web - Based Graphical User Interface (Gui)
Section 5 Overview The Model 943-TGXeNA Tail Gas Analyzer can be monitored, configured and controlled by use of a web-based GUI on a personal computer connected to the analyzer via an ethernet connection, either as a direct local connection or remotely through the plant’s local area network (LAN). -
Page 71: Analysis Section
Figure 45: Navigation Menu and Tips The Navigation menu is divided into four sections: Analysis, Configuration, Factory, and Help. Each of these sections may have several data display pages. The information pages for a given section can be displayed by pressing the (+) sign to the right of the section name. Note that only one section can be expanded at a time;... -
Page 72: Value Display
Figure 46: Analysis Section - Analysis Page The Analysis page is divided into 5 sections, each displaying different information. 5.2.1.1 Value Display The Value Display section displays concentration data, calculated analysis data, and analyzer parameter as described in Table 17. Table 17: Value Display Parameters Parameter Description... -
Page 73: Status And Control
The values displayed in this section are live values and cannot be edited. The associated setpoints and alarm setpoints for the pressure and temperature values can be edited in the Configuration section’s Parameters page. Refer to Section 5.3.1. 5.2.1.2 Status and Control This section displays indicators indicating general status of the analyzer as well as controls that can be used to manually control certain aspects of the analyzer operation. -
Page 74: Air Demand And H2S/So2 Trends
Table 19: Relay Indicators Relay Indicator Description Shows the current state of the Status relay. • Solid Green – Normal: No fault conditions noted in any of the parameters monitored by the analyzer. Analyzer can analyze process sample. Status • Flashing Red –... -
Page 75: Calibration Matrix Page
5.2.2 Calibration Matrix Page The Model 943-TGXeNA uses a spectrometer that connects to the control computer via a USB connection for the collection of the spectrum data needed for the calculation of concentration values and the air demand value. The spectrometer is shown in Figure 48. -
Page 76: Indicators Page
Figure 49: Calibration Matrix Each spectrometer’s unique calibration matrix is determined by Galvanic Applied Sciences Inc. during the production of the analyzer in which it is incorporated. The calibration matrix is determined by incorporating the molar absorptivity data of the gases to be measured with the specific spectral resolution and sensitivity characteristics of that spectrometer. -
Page 77: Figure 50: Indicators Page
Figure 50: Indicators Page The specific faults shown on the Indicators page are listed in Table 20. Table 20: Analyzer Faults Fault Explanation Spectrometer signal is out of range while analyzer is Measure Out of Range measuring sample (signal either off scale or too low) Spectrometer signal is out of range while analyzer is in back Reference Out of Range purge mode (signal either off scale or too low) -
Page 78: Spectrum Page
Table 21: Analyzer Warnings Warning Explanation Low Cabinet Control cabinet internal temperature is below low cabinet temperature Temperature setpoint High Cabinet Control cabinet internal temperature is above high cabinet temperature Temperature setpoint Low Reference Spectrometer signal peak height when analyzer is in back purge mode Peak <24000 A/D counts High Integration... -
Page 79: Figure 52: Spectrum Curve
Figure 52: Spectrum Curve Y-Axis Maximum Value Dialog Box Enter in the desired maximum value for the Y-Axis scale (the minimum will always be zero) and click on Save. Note that the normal maximum peak height for the spectrum curve is around 28000-29000 A/D counts when the analyzer is in back-purge mode. -
Page 80: Absorbance Page
Optimizing the Integration Time should ONLY be performed when the analyzer is in back purge mode. Attempting to optimize the integration time when the analyzer is in sampling mode may negatively affect the analyzer baseline, and thus the analyzer’s analytical results. As an alternative to automatically optimizing the integration time, the operator may choose to manually adjust the integration time instead. -
Page 81: Figure 54: Absorbance Page
Figure 54: Absorbance Page The Absorbance Curve, or absorbance spectrum, shown on this page shows the absorbance of the gas in the measurement cell, in absorbance units (AU) across the range of 530 spectrometer pixels that are used by the analyzer for analysis. The exact X (pixel number) and Y (AU) coordinates of each data point on the curve can be determined by placing the mouse cursor over the data point of interest. -
Page 82: Figure 56: Absorbances
line at an absorbance of 0 AU. If it is not, and the analyzer is NOT in a fault condition, first confirm that the current transmission spectrum in back purge is largely similar to the factory reference spectrum, then immediately carry out a new zero calibration cycle OR use the New Reference function on the Spectrum panel. -
Page 83: Configuration Section
absorbance spectrum into concentration values. For more information on the calibration matrix, refer to Section 5.2.2. Configuration Section The Configuration section consists of two pages that allow the user to configure many of the analyzer’s basic operating parameters as well as the Modbus output if required. 5.3.1 Parameters Page The Parameters page shown in Figure 58 shows a list of operational parameters that can... -
Page 84: Table 24: Configuration Parameters
Many of the parameters on this page are also available for editing on the analyzer’s local display using the analyzer keypad, though not all of them are. Table 24 gives an overview of the parameters available for editing on this page. Table 24: Configuration Parameters Parameter Editable... -
Page 85: Figure 59: Login Dialog Box
Time interval during a zero calibration cycle Config – Timers/Alarms Zero Purge (sec) after switching to back purge and before calculating the new zero baseline Time interval during a zero calibration cycle after the analyzer has switched back to Config – Timers/Alarms Zero Hold (sec) sampling mode and prior to the analyzer concentration outputs configured for Hold... -
Page 86: Modbus Page
As there are many possible configurations for Modbus communication, this manual will only cover the basics. If the user requires assistance in configuring the Modbus for their specific application, the Service Department of Galvanic Applied Sciences Inc. will be able to assist. Contact the Service Department at support@galvanic.com... -
Page 87: Table 25: Modbus Communication Parameters
Table 25: Modbus Communication Parameters Parameter Explanation Port number to be used if the communication protocol being IP Port Number used is Modbus TCP/IP. Modbus address of the analyzer. This address needs to be Modbus Address entered into the DCS to allow the DCS to communicate correctly with the analyzer. -
Page 88: Figure 61: Modbus Typed
Table 26: Available Modbus Points Folder Name Explanation Contains relay status points for each of the analyzer’s four relay outputs – Status, Service, Mode, and Control. This data Relay Status is output in the Modbus list as either 0 (off) or 1 (on). Allows for the output of the status of all possible analyzer faults. -
Page 89: Enron Modbus Format
Regardless of the format chosen, a Modbus list consists of three columns that are described in Table 27. Table 27: Modbus List Columns Column Explanation Contains a series of “nodes” (folders) which are used to hold data in different numerical formats depending on the specific Modbus Items data being output. -
Page 90: Modicon 16 Format
Figure 63: Enron Modbus Format The Enron Modbus format contains 4 nodes on the Modbus tree: Coils, Short Integers, Long Integers, and Floating Point. Coils are Boolean (i.e. ON or OFF) data points which have a value of either 0 or 1. Thus, points placed into the Coils should be points that have only an ON or an OFF state, such as Relay Status points, Fault Status points, or Warning Status points. -
Page 91: Modicon With Floating Point Format
5.3.2.3 Modicon with Floating Point Format If Modicon 32 (Modicon with Floating Point) format is chosen as the Modbus format, the Modbus list will contain 4 main nodes on the Modbus tree, as in Modicon 16 format. However, the Input Register and Output “Holding” Register nodes contain sub-nodes, as shown in Figure 65. -
Page 92: Table 28: Factory Parameters Colour Code
The parameters on this page are configured at the factory and in general should not require changing once the analyzer is in operation. When this page is first opened, it is opened in read- only mode. In order to make changes on this page, click on Change to Update Mode at the top right corner of the screen. - Page 93 Plant factor in the Air Demand equation (refer to Section 1.1). Plant factor is calculated as per Config – Calculation Plant Factor the equation shown in Table 13, Section 4.8.2.1. In most cases, this will be -3. Optimal ratio of H S to SO for the sulfur Config –...
-
Page 94: Changing The Passwords
Help Section The Help section contains information that may be useful to the user for installation, operation, and troubleshooting of the Model 943-TGXeNA analyzer. 5.5.1 Drawing Page When the Drawing page is opened, a PDF showing generic drawings of the analyzer exterior, interior, and electronic schematics is downloaded from the analyzer and displayed. -
Page 95: User Manual Page
5.5.2 User Manual Page When the User Manual page is opened, a PDF copy of this operator manual is downloaded from the analyzer and displayed. 5.5.3 Revision History Page When the Revision History page is opened, the revision number of the web GUI software installed on the analyzer is displayed, as shown in Figure 69. -
Page 96: Section 6 Maintenance
Section 11. Routine Preventative Maintenance Routine preventative maintenance of the 943-TGXeNA analyzer is used to ensure that the analyzer is continuing to operate in an optimal manner and all operating parameters are within a normal range. It consists of: •... -
Page 97: Maintenance Check Out Procedure
Table 30: Normal Operating Parameter and Indicator Conditions Indicator / Panel Location Normal Condition Parameter Online / Offline Analysis 2 Online (green) Backpurge Analysis 1 Off (green) • Status “Normal” (green) • Service “Normal” (green) Relay Indicators Analysis 1 • Mode “Run”... - Page 98 2. Place the analyzer in Offline mode using the Online / Offline control on the Analysis 2 panel. (Refer to Section 4.3.1) 3. Place the analyzer in back-purge by clicking the Back Purge check box on the Analysis 1 panel OR by pressing the PURGE key on the keypad. The displayed concentration and air demand outputs should stabilize to a near zero readings within seconds.
-
Page 99: Table 31: Maintenance Record Sheet
Table 31: Maintenance Record Sheet Processing Unit Number Analyzer Tag Number Analyzer Serial Number Date Time Instrument Technician As Found Fault Condition Cell Temperature Cabinet Temperature Cell Pressure Integration Period Air Demand Forced Zero On Time to Stabilize Air Demand Spectrum Spectrum Peak Height Standard Spectrum Shape... -
Page 100: Changing The Anti-Solarant Solution
1000 ms. The frequency of changing the Anti-Solarant Solution varies between one week and several months, depending on the analyzer’s specific operating conditions. Under typical conditions, Galvanic Applied Sciences Inc. recommends that the Anti-Solarant solution be changed on a monthly basis. When the analyzer is exhibiting a loss of spectrometer signal level (a high integration period >500ms... -
Page 101: Figure 70: Replacing Thea
Figure 70: Replacing the Anti-Solarant Solution 1. Disconnect the source optical fibre from the fluid holder bracket on the UV Lamp Supply (Item #1 in Figure 70). Let the fibre hang freely and ensure that the end does not contact anything. It is suggested that a protective plastic cap is placed onto the end of the fibre. -
Page 102: Optimizing The Spectrometer Signal
7. Rinse the chamber with a small amount of new anti-solarant solution. Shake and empty. Ensure that there are no solid deposits and the chamber windows are completely clear. 8. Fill the fluid holder with new anti-solarant solution. Tilt and tap the fluid holder to remove any air bubbles that may form. -
Page 103: Automated Optimization
Prior to carrying out spectrometer signal optimization, the analyzer MUST be in back purge and offline mode. 6.4.1 Automated Optimization 1. Place the analyzer in back purge mode. This can be done by selecting the Back Purge field on the Analysis 1 panel and pressing the ↵ key to place an X in the box OR by pressing the PURGE key on the keypad. - Page 104 9. After the Manual Zero is completed, place the analyzer back in Sampling mode by selecting the Sample field and then pressing ENTER to put an x in the box OR pressing PURGE on the analyzer keypad. 10. Place the analyzer back into ONLINE mode by toggling the button on the Analysis 2 panel Revision 4 April 2020...
-
Page 105: Section 7 Servicewhat Is Going On Here
A major component failure should be handled by contacting Galvanic Applied Sciences, Inc. Galvanic Applied Sciences, Inc. offers service on a call-out basis and/or factory assistance on the 943-TGXeNA analyzer. For Service and/or Assistance Contact: Galvanic Applied Sciences Inc. -
Page 106: Table 32: Analyzer Fault / Warning Troubleshooting
Table 32 shows potential troubleshooting solutions for all displayed active faults and warnings on the Indicators panel. Table 32: Analyzer Fault / Warning Troubleshooting Fault / Warning Troubleshooting Tips • Oven heater fuse is blown (ACTS:25) • Cell assembly is not securely clamped to the heaters •... -
Page 107: Testing And Replacement Of The Optical Fibres
Testing and Replacement of the Optical Fibres When a High Integration Period warning is present, and the anti-solarant solution has been replaced following the procedure in Section 6.3 within the last 30 days, one of the possible causes of this warning is that one or both of the optical fibres have been damaged and are not able to transmit ultraviolet radiation normally. -
Page 108: Figure 72: Location Of Cell
Figure 72: Location of Cell Heater Fuse on ACTS 5. Open the oven cabinet door and remove the black cover on the oven enclosure. The oven enclosure and all of its components are HOT (150°C). Wear appropriate personal protective equipment (gloves, eye wear, clothing etc) if working with hot surfaces or wait until surface have cooled to safe temperatures before performing maintenance tasks. - Page 109 significantly different from the factory reference spectrum, it will be necessary to test the fibres individually. Continue to Step 12. 12. Loosen the two inter-cabinet seal fittings through which the fibres pass from the oven cabinet into the control cabinet and unscrew the retaining caps. Lift out the plastic retainers and pull gently outward on the cable and rubber seal plug until free from the fitting.
-
Page 110: Troubleshooting The Uv Source Lamp
22. Use the PANEL NEXT / PANEL PREV keys to navigate to the Spectrum panel. Adjust the position of each SMA fitting in the measurement cell by rotating it slightly left and right and sliding it in and out to find the position that gives the greatest Peak Height. Once the optimal position is found for each fibre, re-tighten the set screw. -
Page 111: Table 33: Lamp Troubleshooting
28,000 counts at a <100 ms integration period. The setting of the iris is only to be changed in extreme situations. Please contact Galvanic Applied Sciences Inc. prior to making any changes to the iris position. To change the UV Source Lamp, follow the procedure below. -
Page 112: Figure 73: Uv Lamp Enclosure
Figure 72. Alternatively, place the UV Lamp power switch to the Off position. The location of the lamp power switch is indicated in Figure 73. Socket Head Cap Screw Figure 73: UV Lamp Enclosure 5. Remove the UV Lamp Enclosure lid by removing the four (4) socket head cap screws and pulling the cabinet lid outwards. -
Page 113: Figure 74: Uv Lamp Enclosure
Figure 74: UV Lamp Enclosure Internal Layout 6. Remove the two plastic hole plugs from the top of the UV Lamp Enclosure to gain access to the lamp retaining screws. The location of these two hole plugs is indicated in Figure 74 by the red circle (#1). 7. - Page 114 DO NOT touch the front face (light emitting side) of the lamp. Dirt, grease, and human skin oils can affect the lamp spectral performance. Always handle the lamp by the metal base. DO NOT apply power to the lamp with the cover removed. Intense UV radiation can cause severe eye damage.
-
Page 115: Measurement Cell Block Removal
Measurement Cell Block Removal The measurement cell block will require removal only when there is a suspected sampling problem or if it becomes necessary to clean or change the cell windows and/or O-Rings. A sampling problem could be due to system plugging or collection of nongaseous material in the measurement cell. -
Page 116: Cell Windows Cleaning / Replacement
9. Loosen one of the cell tubing fittings to vent positive pressure zero gas that may be trapped in the sample system. 10. To remove the measurement cell block, tubing connected to the measurement cell block assembly must first be removed. Disconnect the fittings circled in Figure 76. Process gas is still present at the probe side of these valves. -
Page 117: Figure 77: Measurementc
Cleaning or changing the cell windows is most easily accomplished by removing the entire measurement cell assembly from the oven enclosure, as described in Section 7.6. It is recommended that the measurement cell assembly is opened in a clean environment such as a bench top. -
Page 118: Measurement Cell Installation
The air pressure should be sufficient to loosen the cell window and allow it to be removed. 5. Repeat Steps 1-4 for the other cell window. If the other cell window sticks to the inner O-Ring, it may be removed by passing a soft tipped tool through the measurement cell and pushing on it gently from the inside until it comes loose. - Page 119 1. Place the measurement cell in its approximate position focusing on the engagement of the 3/8” elbow Swagelok ® fitting connection on the bottom left of the measurement cell block. Once this fitting is engaged, the aspirator drive air inlet fitting on the top left of the measurement cell can also be reconnected to finger tight.
-
Page 120: Steam Purging The Sample Probe
16. Close and latch the control cabinet and oven cabinet doors. 17. Once the measurement cell temperature rises to >140°C, and the Cell Temperature fault has cleared, use the PANEL NEXT / PANEL PREV keys to navigate to the Analysis 1 panel. Perform a manual zero calibration cycle by using the FIELD NEXT / FIELD PREV keys to highlight Manual Zero, then press ENTER. - Page 121 4. Close valves V1, V3, and V5. Prior to performing a steam purge, Galvanic Applied Sciences also recommends disconnecting the measurement cell side fittings on valves V1 and V3 and install plugs on these valves.
-
Page 122: Spectrometer Replacement
15. Allow the back purge to continue for five to ten minutes. 20. Once the measurement cell temperature rises to >140°C, and the Cell Temperature fault has cleared, use the PANEL NEXT / PANEL PREV keys to navigate to the Analysis 1 panel. - Page 123 3. Access the purged control cabinet following proper user company and/or regulatory agency procedure. The control cabinet door may NOT be opened while the analyzer is energized UNLESS the area is known to be non-hazardous. Observe all the warning labels on the analyzer enclosures. DO NOT look at the end of disconnected fibres connected to the UV lamp or place them in contact with skin.
-
Page 124: Figure 79: Utility Page
Figure 79: Utility Page 3. Under the Calibration Matrix Upload to Analyzer heading, click on the Browse button. Select the CSV format calibration matrix file with the file name indicated in the one-page PDF document provided along with the spectrometer. The folder in which this file and the calibration matrix will be found will have the spectrometer’s serial number (indicated on a label on the front of the spectrometer) as the folder name. - Page 125 Uploading an incorrect calibration matrix file may render the analyzer unusable. Be absolutely CERTAIN that the matrix file being uploaded is the correct file. If uncertain, contact Galvanic Applied Sciences Inc. for assistance. 4. Once the Calibration Matrix file has successfully uploaded to the analyzer, click on Reboot Analyzer to reboot the analzyer.
-
Page 126: Section 8 The Product Quality Assurance Program
Section 8 Overview The Galvanic Applied Sciences product quality assurance program is designed to ensure that the system meets all manufacturing specifications and is built to meet the customer’s specific requirements. This chapter consists of a number of forms which provide the overall QA procedure and should be retained. -
Page 127: Qa Document Package Check List And Requirements
QA Document Package Check List and Requirements Table 34 is completed during the manufacturing process and QA inspection to ensure that the all relevant operations are performed. Table 34: Document Package Checklist Serial Number: _______________ Description Initial Date Sample System Pressure Checked - System Heaters Sample System Pressure Checked –... -
Page 128: Section 9 Drawings
Drawings Section 9 Several generic analyzer drawings and schematics are provided in this section. These drawings are also available in PDF format via the Help section Drawing page in the web GUI. For serial number-specific drawings refer to the USB key that is shipped with the analyzer. Figure 81: Mounting and Service Connections Revision 4 April 2020... -
Page 129: Figure 82: Oven Cabinetd
Figure 82: Oven Cabinet Door Removed Revision 4 April 2020... -
Page 130: Figure 83: Control Cabinet
Figure 83: Control Cabinet Door Removed Revision 4 April 2020... -
Page 131: Figure 84: Power , Steam , A
Figure 84: Power, Steam, Air, Signals Connection Details Revision 4 April 2020... -
Page 132: Figure 85: Ac Wiring Schematic
Figure 85: AC Wiring Schematic Revision 4 April 2020... -
Page 133: Figure 86: Dc Signals Andw
Figure 86: DC Signals and Wiring Diagram Revision 4 April 2020... -
Page 134: Figure 87: Flow Diagram
Figure 87: Flow Diagram Revision 4 April 2020... -
Page 135: Section 10 Specifications
Specifications Section 10 Performance Specifications Auto Calibration User Selectable Frequency Zero Drift < 0.25% of full scale per day (based on autozero frequency of once/hour Accuracy +/- 1% of Full Scale with pressure compensation (with all species present) Sensitivity +/- 1.0 % of Full Scale Repeatability Better than 0.5% of full scale (with all species present) -
Page 136: Section 11 Recommended Spare Parts
Fax: 403-255-6287 Email: parts@galvanic.com Alternatively, local Galvanic gas products distributors in many countries and regions around the world may be contacted for spare parts assistance. Refer to the distributor list found at the following website: https://www.galvanic.com/service-support/representatives Table 35: Recommended Spare Parts - 1 Year Kit... -
Page 137: Section 12 Input / Output (Io) Board Configuration
Input / Output (IO) Board Configuration Section 12 12.1 IO Board Web GUI To access the web GUI used to configure the IO board, connect a PC to one of the Ethernet ports on the analyzer’s control board inside the control cabinet, and ensure that the local connection status displayed on the Config panel Network sub panel is showing as Active. -
Page 138: Status Page
Table 37: IO Board Web GUI Pages Page Title Manual Section Purpose Presents the current status of all inputs and outputs Status 12.2 (analog and digital) on the IO board; all data is read only. Used for testing of digital outputs (solenoids and Manual 12.3 relays) as well as for calibration of the four analog... -
Page 139: Manual Override Page
Table 38: Status Page Sections Section Purpose Shows the current calibrated value being received at each of the IO board’s four analog inputs. Displayed measurement units are based on the factory calibration of these inputs. Analog Inputs Pressure is the measurement cell pressure input, RTD1 is the measurement cell temperature input, and RTD2 is the probe temperature input (if present). -
Page 140: Analog Output Calibration And Testing
Figure 90: Manual Override Page In order to make any changes on this page, Direct Peripheral Board Control must first be enabled by placing an X in the checkbox. Once this is enabled, the IO board will be under manual control of the user and the analyzer’s control computer will have no control of this board until this direct board control is manually disabled. -
Page 141: Figure 91: Analog Outputt
2. The value in the Zero field must be set to 4, and the value in the Span field must be set to 20. 3. Connect a multimeter set to milliamp measurement to the analog output to be calibrated. The analog outputs are all on terminal block P3 of the IO board. The terminals for each analog output are clearly marked on the board. -
Page 142: Testing The Digital Input
10. If there are any issues with the calibration discovered while performing the test procedure in Step 9, repeat the calibration process in steps 4-8 and test again. 11. Repeat the calibration process steps 1-10 for each additional analog output that needs to be calibrated. -
Page 143: Figure 92: Relay Connection
Figure 92: Relay Connection Terminal Block P4 Each relay connection is clearly marked. Relay 1 is Status, Relay 2 is Service, Relay 3 is Mode, and Relay 4 is Control. The relays can be connected either as normally open (NO) whereby the circuit is only complete when the relay is energized or as normally closed (NC) whereby the circuit is complete when the relay is deenergized. -
Page 144: Index
Index Baud Rate, 87 Beer-Lambert Law, 62 Big Endian, 87 32 Bit Register Swap, 87 Cabinet Cooler Air Valve, 34 Absorbance, 62, 81 Cabinet Deadband, 66 Absorbance Page (Web Based GUI), 80 Cabinet Purge Air Flow Adjust Valve, 33 Absorbance Panel, 57 Cabinet Setpoint, 66 Absorbance Spectrum, 81 Cabinet Temperature, 34, 51... - Page 145 Digital Input Testing, 142 Digital Outputs. See Relay Outputs Indicators Page (Web Based GUI), 76 Direct Connect, 68 Indicators Panel, 51 Display Board, 17 Ingress Protection (IP) Rating, 20 Drawing Page (Web Based GUI), 94 Installation Procedure, 21 Drawings Instrument Air AC Wiring Schematic, 132 Clearing Sample Handling System / Probe Control Cabinet Door Removed, 130...
- Page 146 Manufacturer’s Warranty, 12 Changing the Passwords, 94 Factory Password, 92 Mating of the Process and Analyzer System Peak Height, 55, 56 Flanges, 23 Plant Factor, 14, 62, 93 Measure Analog Input, 85 Probe Control, 93 Measurement Cell Probe Deadband, 66 Installation, 118 Probe Setpoint, 66 Removal, 115...
- Page 147 Enclosure Layout, 112 Specifications Lifespan, 111 Hazardous Area Classification, 135 Mounting Orientation, 113 Performance, 135 Power Off Switch, 112 Physical, 135 Replacement Procedure, 111 Required Services, 135 Troubleshooting, 110 Spectrometer, 14, 54, 75, 78 Parameters, 54, 79 Replacement Procedure, 122 Spectrum, 54, 78 Vortex Cooler, 34 Absorbance.
- Page 148 Reason for Revision The changes incorporated in Revision 4 of the Operation Manual are in the addition of the level of detail for clarity only and do not affect product, processes or methods of protection used for approval. Revision 4 April 2020...
Need help?
Do you have a question about the 943-TGXeNA and is the answer not in the manual?
Questions and answers