Advertisement
Basic Connection and Operation of the DIGILENT Analog Discovery 2 (AD2)
This document provides an introduction to using the signal generator and scope features of the
Digilent AD2 module equipped with the BNC Adaptor Board. The BNC Board allows the user to
connect BNC cables to the two signal generators of the AD2. It also allows signals to be
displayed on the scope through scope BNC connectors.
The following procedure describes how to generate a 1kHz sine and triangular signals on
channels 1 and 2, respectively, of the AD2 signal generator. It also describes how to receive and
display these two signals on CH1 and CH2, respectively, of the AD2 scope. Finally, the "Math
utility" of the scope is exploited to compute and display the product of the two signals.
Before connecting the AD2 board to your computer, you must install its "Waveforms" software.
The software is free of charge and can be downloaded and installed from the following link:
https://reference.digilentinc.com/reference/software/waveforms/waveforms-3/start?redirect=1
After installing Waveforms, insert the USB connector of the AD2 into one of the available USB
ports of your computer. Doing so will install the AD2 drivers. Double click on the Waveforms
icon
to run the software.
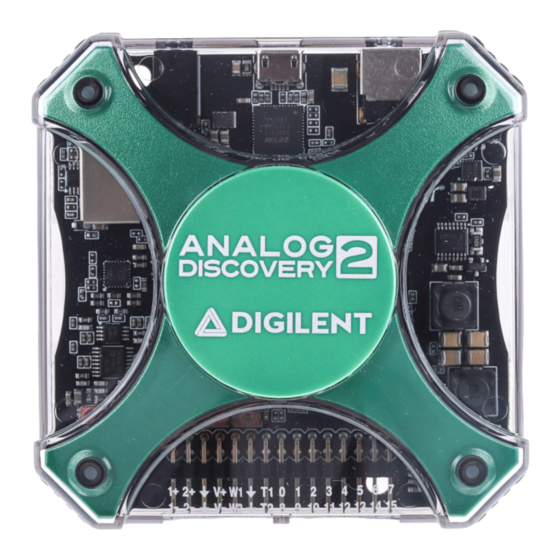
The AD2 and its BNC Board are shown in the figure below. For this demonstration, connect the
BNC cables so that Signal 1 (generated on W1 port) is displayed on CH1 of the scope, and
Signal 2 (generated on W2 port) is displayed on CH2 (refer to the figure below).
Click on the "Workspace" menu (upper left corner of the Waveforms user interface) and choose
"New". This will display the menu of icons on the left hand side as shown below.
Advertisement
Table of Contents

Related Manuals for Digilent Analog Discovery 2

Summary of Contents for Digilent Analog Discovery 2
- Page 1 This document provides an introduction to using the signal generator and scope features of the Digilent AD2 module equipped with the BNC Adaptor Board. The BNC Board allows the user to connect BNC cables to the two signal generators of the AD2. It also allows signals to be displayed on the scope through scope BNC connectors.
- Page 2 Click on the “Wavegen” icon and configure it to display two channels with Channel 1 generating a 1KHz sine wave with 2 Volt amplitude, and Channel 2 generating a 1KHz triangular wave with 2 Volt amplitude. Choose “Synchronize” from the top menu. This will cause the two signals to be synchronized (both will start at the origin).
- Page 3 Next, you will display and configure the AD2 scope. Click on the icon and then click on “Scope” in the left vertical menu. This will display the scope screen. Configure Time, CH1 and CH2 as follows: Next, configure the triggering in the top menu as shown below: Now, click the button.
- Page 4 The last step in this demo is to generate and display the product of the two signal. Click on “+Add Channel” button in the right hand side menu and choose “Custom”. This will add a “Math1” menu (located under the Channel 2 menu) on the right hand side of the screen. Configure the menu as shown below: If “C1*C2”...
- Page 5 Your turn: Perform Step k of Experiment 0 using the AD2 only.
Need help?
Do you have a question about the Analog Discovery 2 and is the answer not in the manual?
Questions and answers
I monitor and record a train of equi-amplitude pulses in 'scope' mode, an display the result in 'histogram' mode. But the peak is displayed at ~zero volts instead of the true pulse amplitude....
The peak appears at approximately zero volts instead of the true pulse amplitude in 'scope' mode and 'histogram' mode on the Digilent Analog Discovery 2 because the histogram shows the distribution of voltage values over time. If the signal spends more time near zero volts (such as during the low state of a pulse), the histogram accumulates more counts at that level, making it appear as the peak. The histogram does not display instantaneous peak voltage but rather the most frequent voltage levels.
This answer is automatically generated
I monitor and record a train of equi-amplitude pulses and dispaly the result in 'histogram' mode. but the peak shows up centered at zero volts instead of the true amplitude....