Table of Contents
Advertisement
Quick Links
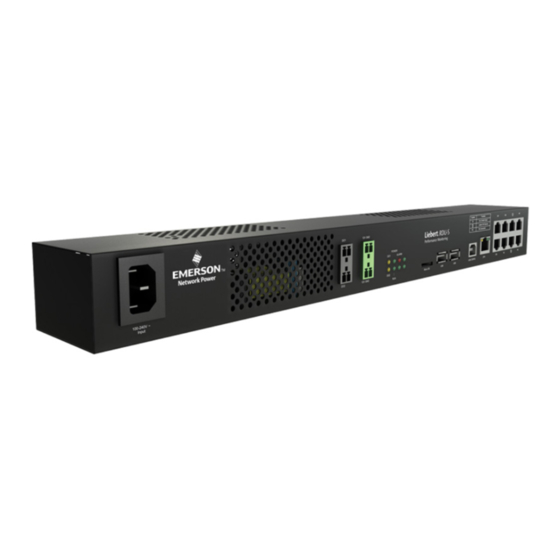
RDU-S Rack Data Unit
User Manual
Version
V1.4
Revision date
December 13, 2011
BOM
31012350
Emerson Network Power provides customers with technical support. Users may contact
the nearest Emerson local sales office or service center.
Copyright © 2010 by Emerson Network Power Co., Ltd.
All rights reserved. The contents in this document are subject to change without notice.
Emerson Network Power Co., Ltd.
Address: No.1 Kefa Rd., Science & Industry Park, Nanshan District 518057, Shenzhen
China
Homepage: www.emersonnetworkpower.com.cn
E-mail: support@emersonnetwork.com.cn
Advertisement
Table of Contents

Summary of Contents for Emerson Network Power RDU-S
- Page 1 Revision date December 13, 2011 31012350 Emerson Network Power provides customers with technical support. Users may contact the nearest Emerson local sales office or service center. Copyright © 2010 by Emerson Network Power Co., Ltd. All rights reserved. The contents in this document are subject to change without notice.
-
Page 3: Table Of Contents
Contents Chapter 1 Overview ................................1 1.1 Product Introduction .............................. 1 1.1.1 Appearance ............................... 1 1.1.2 Indicators ..............................1 1.1.3 Ports ................................2 1.2 Technical Specifications ............................3 1.2.1 Input Specifications ........................... 3 1.2.2 Output Specifications ..........................3 1.2.3 Ambient Specifications ..........................4 1.2.4 Mechanical Specifications ......................... - Page 4 Chapter 5 Software Operation ............................17 5.1 Login ................................... 17 5.2 Monitor Interface Operation Description ......................18 5.2.1 Environmental ............................18 5.2.2 PDU ................................. 20 5.2.3 Camera ..............................25 5.3 Control Interface Operation Description ......................27 5.4 Configure Interface Operation Description ......................29 5.5 Events Interface Operation Description ......................
-
Page 5: Chapter 1 Overview
Chapter 1 Overview This chapter gives a brief introduction to the appearance, indicators, ports, technical specifications and options of RDU-S rack data unit (data unit for short). 1.1 Product Introduction The data unit is an intelligent acquisition system developed by Emerson to monitor the environment in rack and IDC machine room. -
Page 6: Ports
Provide two A type ports of 2.0 standard; capable of recognizing USB1, USB2 USB ports standard U disk, getting USB camera image and connecting GPRS Modem USB CONFIG USB CONFIG port Display the current IP and restore the default password RDU-S Rack Data Unit User Manual... -
Page 7: Technical Specifications
Table 1-5 Output specifications Output parameters Specification Descriptions Route number Two routes Supportive of two triggering modes: level mode Relay output Output contact Relay normally open contact output and pulse mode Contact capacity 5A/24Vdc; 5A/220Vac RDU-S Rack Data Unit User Manual... -
Page 8: Ambient Specifications
2. ICAM-01 camera (with PTZ control) 1. IDS-08 5cm simple installation support 2. Mushroom head magic paste Installation options of sensors 3. 16mm gummed magic paste 4. CT3Y 3cm round magnet 5. RJ45 three-way connector RDU-S Rack Data Unit User Manual... -
Page 9: Chapter 2 Installation
Slotted screwdriver 100mm, 200mm Electrician diagonal cutting pliers 150mm Wire cutter Maximum 300mm Electrician long nose pliers 150mm Digital multimeter Three and a half digit With a Φ6 aiguille Crossed screwdriver 100mm, 200mm Drill RDU-S Rack Data Unit User Manual... -
Page 10: Installing Data Unit
2. Put the data unit onto the guide rails in the rack and push it into the rack completely. 3. Wrench M6 screws into the fixing holes (see Figure 2-3) of the hangers to fasten the data unit onto the rack. RDU-S Rack Data Unit User Manual... -
Page 11: Installing The Data Unit On The Wall
Figure 2-6 Hole dimensions (unit: mm) 3. Put the data unit in the position, and wrench self-tapping screws into the plastic expansion pipes through the fixing holes of the hangers to fix the data unit on the wall. RDU-S Rack Data Unit User Manual... -
Page 12: Chapter 3 Connection
The positions of the 1-wire sensor ports are shown in Figure 3-1. 1-wire sensor port 1-wire sensor port Figure 3-1 Positions of 1-wire sensor ports Pin definition The pin definition of the 1-wire sensor port is described in Figure 3-2. RDU-S Rack Data Unit User Manual... -
Page 13: Connecting Di1, Di2 And Di3 Ports
If the digital sensor (with a connection cable in factory) recommended by Emerson is connected, insert the RJ45 connector of the connection cable into the DI1, DI2 or DI3 port. The recommended sensors are shown in Figure 3-5. RDU-S Rack Data Unit User Manual... -
Page 14: Connecting Irm Sensor Port
IRM series temperature sensor also includes 30, 31, 32, 33, 40, 41, 42 and Port position The position of the IRM sensor port is shown in Figure 3-7. RDU-S Rack Data Unit User Manual... -
Page 15: Connecting Serial Ports
RS485 port of PDU with the serial port of the data unit. If multiple PDUs need to be monitored, use standard Cat5 cable to connect the Link port of the upper PDU with the RS485 port of the lower PDU in daisy chain mode, as shown in Figure 3-11. RDU-S Rack Data Unit User Manual... -
Page 16: Connecting Relay Ports
DO1, DO2). The relay of the data unit is normally open passive dry contact. Properly arrange the wiring according to the site conditions. Note Pay attention to the port silkscreen before connection to avoid the wrong connection. Otherwise, the device may be damaged. RDU-S Rack Data Unit User Manual... -
Page 17: Chapter 4 Parameter Setting
Figure 4-1. Figure 4-1 Connection description interface 2. Type the name ‘RDU-S’ in the Name field and click OK, as shown in Figure 4-2. Figure 4-2 Connect to interface 1 RDU-S Rack Data Unit User Manual... -
Page 18: Powering On
If no information is displayed, check that the connection between the data unit and the computer, and HyperTerminal settings are correct. You can log onto the data unit through the HyperTerminal after the above checks. RDU-S Rack Data Unit User Manual... -
Page 19: Logging Onto Data Unit
The detailed procedures are given as follows: 1. Power on the data unit. After it starts up normally, the HyperTerminal will display RDU-S login:. 2. Type the user name ‘rduadmin’ and press the Enter key, and the HyperTerminal will prompt Password:. -
Page 20: Restarting Data Unit
1. Type ‘reboot’ following the command prompt RDU_admin# and press the Enter key, as shown in the following figure. 2. Type 'Y’ or ’N’ according to the system prompt. Typing ‘Y’ will restart the data unit; typing ‘N’ will cancel the restarting operation. RDU-S Rack Data Unit User Manual... -
Page 21: Login
2. On one computer, only one user is allowed to log in the system at a time. 3. The system only supports IE7 or IE8 browser. The default interface after login is the Monitor interface, as shown in Figure 5-2. RDU-S Rack Data Unit User Manual... -
Page 22: Monitor Interface Operation Description
1) Click the Temperature Sensor node in the Monitor structure tree, and the window shown in Figure 5-3 will appear. Figure 5-3 Temperature sensor window 2) Double-click one sensor histogram to enter the edit mode; meanwhile, the serial number of the sensor is visible, as shown in Figure 5-4. RDU-S Rack Data Unit User Manual... - Page 23 This window displays the working status of the devices connected to the relay port. For example, the icon of DO1 (indicator alarm) turning red indicates that it generates an alarm. Figure 5-8 Output relays window RDU-S Rack Data Unit User Manual...
-
Page 24: Pdu
Sensor Configure window shown in Figure 5-46. Figure 5-10 Event list 5.2.2 PDU Click the PDU tab in the operation area to enter the PDU interface, as shown in Figure 5-11. Figure 5-11 PDU tab RDU-S Rack Data Unit User Manual... - Page 25 For metered PDU, click Signal tab and Event tab to check the status of PDU and abnormal events; Click Control tab to set the address, upper load current and lower load current of the PDU. The tabs are shown in Figure 5-13. Signal tab Event tab RDU-S Rack Data Unit User Manual...
- Page 26 Operation column to set the address or threshold for metered PDU, as shown in Figure 5-14. Figure 5-14 PDU setting windows Switched PDU For switched PDU, the PDU page is shown in Figure 5-15. Figure 5-15 PDU page (switched PDU) RDU-S Rack Data Unit User Manual...
- Page 27 Event and Control, as shown in Figure 5-16. Signal tab Event tab Control tab Figure 5-16 Detailed information window In the Control tab, the setting method of switched PDU is the same as that of metered PDU (see Figure 5-14). RDU-S Rack Data Unit User Manual...
- Page 28 Mps PDU, which contains three tabs. Click Signal tab and Event tab to check the status of PDU and abnormal events; Click Control tab to set upper load current and lower load current of the PDU. The tabs are shown in Figure 5-17. Signal tab Event tab RDU-S Rack Data Unit User Manual...
-
Page 29: Camera
2. Extend the USB Camera node. Click All Camera, and camera1 and camera2 images will be displayed simultaneously in the interface, as shown in Figure 5-18. Click Camera1 or Camera2, and the corresponding camera image will be displayed in the interface. RDU-S Rack Data Unit User Manual... - Page 30 The capture picture list and the preview window are shown in Figure 5-20 and Figure 5-21 respectively. Figure 5-20 Capture picture list Figure 5-21 Picture preview window The record video list and the record video replay window are shown in Figure 5-22 and Figure 5-23 respectively. RDU-S Rack Data Unit User Manual...
-
Page 31: Control Interface Operation Description
2. For alarm event, the recording time is two minutes at most; for manual recording, the recording time is 15 minutes at most. 5.3 Control Interface Operation Description Click the Control tab to enter the Control interface, as shown in Figure 5-24. RDU-S Rack Data Unit User Manual... - Page 32 Select the control mode (including ‘On’ and ‘Off’) in DO1 Output and DO2 Output, and click Apply. Firmware update 1. Click the Firmware Update node in the Control interface to upgrade the firmware file of the data unit, and the window shown in Figure 5-27 will appear. RDU-S Rack Data Unit User Manual...
-
Page 33: Configure Interface Operation Description
Figure 5-29 will appear. Figure 5-29 Restore factory defaults window Click Restore to restore the system default setting. 5.4 Configure Interface Operation Description Click the Configure tab to enter the Configure interface, as shown in Figure 5-30. RDU-S Rack Data Unit User Manual... - Page 34 2. Before using the DHCP service, please check that the DHCP server has been started normally, or else, the DHCP can not be used normally. Select Use the following IP address, type IP address, subnet mask and gateway in the textbox, and click Apply to complete the configuration. RDU-S Rack Data Unit User Manual...
- Page 35 As shown in Figure 5-32, type the corresponding configuration values of the parameter items and click Apply to complete the configuration. Figure 5-32 SMTP server window 2. Recipients 1) Click the Recipients tab, and the window shown in Figure 5-33 will appear. Figure 5-33 Recipients window RDU-S Rack Data Unit User Manual...
- Page 36 SMTP mode (note that the mobile phone is required to apply mobile mailbox function), receiving SMS sending function through Wireless Modem and adding & deleting phone numbers. 1. Wireless Modem Click the Wireless Modem tab, and the window shown Figure 5-36 will appear. RDU-S Rack Data Unit User Manual...
- Page 37 4) Select a phone number and click Delete, and the number will be deleted. Note At most eight phone numbers can be added. SNMP Click the SNMP node, and the window shown in Figure 5-39 will appear. Figure 5-39 SNMP window RDU-S Rack Data Unit User Manual...
- Page 38 5) Select SNMP V3, the window shown in Figure 5-41 will appear. Figure 5-41 Select SNMP V3 6) Click Apply, the setting is successful; Click Cancel, the setting is cancelled. 2. Deleting NMS Select one NMS and click Delete, and the NMS will be deleted. RDU-S Rack Data Unit User Manual...
- Page 39 Users Click the Users node, and the window shown in Figure 5-43 will appear. Figure 5-43 User window 1. Adding new user. 1) Click Add, and the window shown in Figure 5-44 will appear. RDU-S Rack Data Unit User Manual...
- Page 40 You can enable or disable the SN DI channels, and set the SN DI type and name of the SN DI channels. Click Apply to complete the configuration. Click the Comms Loss Reset button to clear the Loss of Comms events in the event list. RDU-S Rack Data Unit User Manual...
- Page 41 The address range of the ten temperature monitoring points is 10, 11, 12, 13, 20, 21, 22, 23, 30 and 31. The temperature monitoring points beyond this address range will not be displayed in the NForm. Click the PDU node, and the window shown in Figure 5-48 will appear. RDU-S Rack Data Unit User Manual...
- Page 42 If you do not have any operation on the WEB interface within 15 min, it will automatically exit and return to the login interface (see Figure 5-1). Figure 5-50 Auto logout window Change password Click the Change Password node, and the window shown in Figure 5-51 will appear. RDU-S Rack Data Unit User Manual...
-
Page 43: Events Interface Operation Description
EventLog, Email, SMS, Camera USB, Relay out and SNMP TRAPS. Figure 5-53 Configuration interface of alarm notification RDU-S Rack Data Unit User Manual... - Page 44 Click the Events History node, and the figure shown in Figure 5-55 will appear. You can view the alarm records, including critical alarm, warning and notification in the interface. You can click Time to list the events in time sequence. Figure 5-55 Event history window RDU-S Rack Data Unit User Manual...
-
Page 45: History Interface Operation Description
After the sensor types on upper side of the interface are selected, the corresponding chart will appear. Figure 5-58 shows the historical data charts after all sensor types are selected. Clicking buttons can scroll down and up the historical data charts. RDU-S Rack Data Unit User Manual... - Page 46 Click the Table node to enter the historical data interface in table mode, as shown in Figure 5-59. You may click Time, Name, Value and Unit to list the data in the corresponding sequence respectively. Figure 5-59 Historical data interface in table mode RDU-S Rack Data Unit User Manual...
-
Page 47: System Information Interface Operation Description
Figure 5-62 System information interface 5.8 Logout Click the logout button on the upper left corner of the interface or the exit button on the upper right corner of the interface to exit the software. RDU-S Rack Data Unit User Manual... -
Page 48: Chapter 6 Troubleshooting
2. See supported modem list in RDU brochure 1. Check the model number of PDU. Make sure that it is Serial Switched PDU, No communicating for PDU Serial Metered PDU or Serial Mps PDU. 2. Check address of the PDU RDU-S Rack Data Unit User Manual... -
Page 49: Appendix 1 Command Lines
The download command is used to download the software or delete the files and subdirectory under the data unit directory. Type ‘download’ under the command prompt RDU_admin# and press the Enter key, as shown in the following figure. RDU-S Rack Data Unit User Manual... - Page 50 The setip command is used to set the network parameters, such as IP address, mask and default gateway. Type ‘setip’ under the command prompt RDU_admin# and press the Enter key, as shown in the following figure. RDU-S Rack Data Unit User Manual...
- Page 51 You can type ‘0’ ~ ‘3’ to realize the different operation functions: Type ‘0’ and press the Enter key: show the lookstatus command interface. Type ‘1’ and press the Enter key: show the system status, as shown in the following figure. RDU-S Rack Data Unit User Manual...
- Page 52 3. Directly pressing the Enter key will leave the previous value unchanged. (12) Stopmod The stopmod command is used to stop the DHCP client service. Type ‘stopmod’ under the command prompt RDU_admin# and press the Enter key, as shown in the following figure. RDU-S Rack Data Unit User Manual...
- Page 53 The version command is used to show the device version information, including hardware version information and software version information. Type ‘version’ under the command prompt RDU_admin# and press the Enter key, as shown in the following figure. RDU-S Rack Data Unit User Manual...
Need help?
Do you have a question about the RDU-S and is the answer not in the manual?
Questions and answers