Table of Contents
Advertisement
Quick Links
Advertisement
Table of Contents

Related Manuals for Planar IT-088


Summary of Contents for Planar IT-088
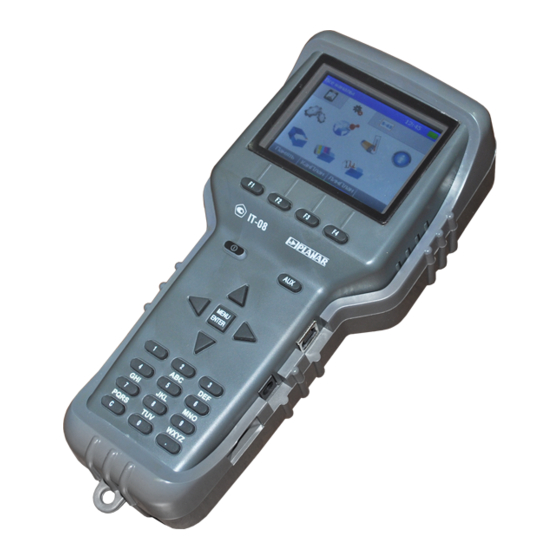
- Page 1 IT-088 DIGITAL DVB-T SIGNAL ANALYZER OPERATING MANUAL...
- Page 2 31.03.10...
-
Page 3: Table Of Contents
TABLE OF CONTENTS 1. PRODUCT FAMILY GENERAL INFORMATION ............5 2. GENERAL DESCRIPTION AND PRINCIPLE OF OPERATION ......... 6 2.1. I ......................6 NTRODUCTION 2.2. S ....................6 AFETY RECAUTIONS 2.3. F ........................7 UNCTION 2.4. E ..................7 NVIRONMENT ONDITIONS 2.5. - Page 4 4.7.5. Audio Indication Switch ................43 4.7.6. Language Selection ..................43 4.7.7. Reference Clock Frequency Setting ............. 44 4.7.8. Reference Clock Date Setting ..............44 4.7.9. Reference Clock Time Setting ..............44 4.7.10. Key Pressing Sound Selection ..............44 4.7.11. Measurement Mode Quick Access ............. 44 4.8.
-
Page 5: Product Family General Information
Support of DVB-C and ITU-T ANNEX A/C. Measurement of carrier level, C/N and V/A ratios, channel power, MER, BER, and constellation diagram. IT-088 Digital TV DVB-T Signal Analyzer (MC-088 module plugged-in), 47 to 862 MHz range. Support of DVB-T and DVB-H with COFDM modulation. Measurements for analog channels: carrier level, C/N and V/A ratios and for digital channels: channel power, MER, BER, and constellation diagram. -
Page 6: General Description And Principle Of Operation
2.1. Introduction This Operating Manual is intended for introducing the design, functions, and basic instructions related to operation and servicing of the IT-088 Digital DVB-T Signal Analyzer (Analyzer). The IT-088 is designed for control and adjustment of television and broadcasting distribution networks as well as of separate components of such networks, or other electronic devices. -
Page 7: Function
FEC, channel bandwidth, and modulation type). The IT-088 can be connected to a personal computer to access additional modes. The IT-088 operates in spectrum analyzer mode displayed on the built-in LCD. The Analyzer allows to measure direct and alternating voltage of the remote power supply of the TV and broadcasting distribution networks. -
Page 8: Package Contents
2.5. Package Contents The Analyzer package includes: a) MB-08 Base Unit ......1 pc. b) MC-088 Removable Module ... 1 pc. c) Carrying Case ......... 1 pc. d) NiMH, AA Batteries ......6 pcs e) PS12/0.8 Mains Adapter ....1 pc. “F”-”F”... -
Page 9: Design And Operation Overview
4 characters on LCD; - Warm-up time: 10 min.; - IT-088 can be powered by: - AC circuit with 220 ± 22 V voltage, 50 ± 0.5 Hz frequency with no more than 5% harmonic content, via PS12/0.8 Mains Adapter;... -
Page 10: Block Diagram
The mode of signal level measurement in a frequency point displays the numeric value of the signal level, V/A and C/N ratios. 2.6.2. Block Diagram The block diagram of IT-088 is shown in figure 2.3. Figure 2.3 After the Low-Pass Filter (LPF), the input signal if necessary is strengthened by the Wide-Band Amplifier (WBA) or reduced by the two Attenuators (A1) and (A2). -
Page 11: Component Arrangement
Upon receipt of the package, check the availability of the items contained in it against the list provided (see section 2.5). If the IT-088 has been kept in the environment other than the rated operating conditions, leave your Analyzer in facilities with normal operating conditions at least for 2 hours prior to operation. -
Page 12: Preparation For Measurements
MC-088 Removable Module to the MB-08 Base Unit, if they were stored separately; c) connect the Mains Adapter to the connector located on the side panel of the IT-088 and then to the power source; d) set «On/Off» switch located on the right side panel to “On”. - Page 13 If the Removable Module software version does not differ from the software installed, then the IT-088 starts to check the Removable Module after the power has been switched on. The corresponding message will appear on the screen of the Analyzer. After successful check, the following message (see figure 4.1) will appear on the screen:...
- Page 14 To make sure that the Analyzer is operating properly perform the procedure described below. Select the icon in the main menu using « » and « » keys. Press «F2» key. Select the row with the required parameter using « », « » arrows, and set the following values by «◄»...
-
Page 15: Measurement Procedure
4.3. Measurement Procedure 4.3.1. General Information The IT-088 offers five functions of signal level measurement and three functions of DVB-T/H signal reception quality. a) measurement of signal level in the frequency point simultaneously with TV signal parameters, as well as measuring alternating and direct power at the input of the Analyzer in LEVEL measurement mode;... -
Page 16: Level Measurement Mode
4.3.2. LEVEL Measurement Mode icon in the main menu refers to this mode. The signal level in the frequency point is displayed on the screen in this mode. You can see the screen view in figure 4.4: Index 1 is the signal level of the frequency, which value is marked by index 2. Figure 4.4 Number of the channel containing the current frequency point is displayed in position indexed 3. - Page 17 The audio carrier frequency is defined in accordance with the frequency set by the current TV system (TV system, section 4.3.10). The IT-088 offers the capability of the frequency point selection for optimization of noise measurements while operating by channel plan. (4.4.2.1).
-
Page 18: Spectrum Measurement Mode
4.3.3. SPECTRUM Measurement Mode icon in the main menu refers to this mode. This mode displays the signal spectrum. See figure 4.5 for the representation of the screen view: Figure 4.5 Index 3 shows the signal level in the frequency point (value is displayed in index 1) indicated by the marker (index 4). -
Page 19: Tilt Measurement Mode
Index 1 shows the number of the channel indicated by the marker (index 4). The marker is represented as a vertical dashed line. In case of a channel plan operation, the channel name will be indicated after the number of the channel in index 1 (if the channel is available in the channel plan). -
Page 20: Ripple Measurement Mode
By pressing «F4» you can enable indication of the channel tuning frequency instead of the name and number of the channel (index 1). To restore the view, press «F4» again. When you operate with a channel plan, the scanning will be fulfilled only for the selected channels. - Page 21 Figure 4.9 The three upper lines display the setting parameters. The top line shows channel number, channel name within the channel plan (if a channel plan was selected), and the symbol of DVB-T/H signal synchronization. If synchronization has been achieved, «LOCK»...
- Page 22 To measure the signal quality parameters in a channel, select the required one by « » and « » keys. To enter the channel number from the keypad, first press «F1». enter channel message will be for a short moment displayed on the screen. To enter the number use the alphanumeric keys set.
-
Page 23: Dvb-T/H Graphic Measurement Mode
To check the current channel parameters you can use the supplementary table. To access this table, press «F3». The view of the table is represented in figure 4.10. It represents the following parameters: - Fcarrier – tuning frequency of the Analyzer; - Foffset –... - Page 24 The other area of the screen is divided into two fields for the measured parameters. The first field is the modification error ratio MER. The second one is the bit error rate in the digital stream after Viterbi decoder (postBER). The postBER value will be indicated depending on achievement of the threshold value 2x10 .
-
Page 25: Dvb-T/H Constellation Measurement Mode
NOTE When operating with a channel plan, in case if the modulation set for the frequency point is other than COFDM-QPSK, COFDM-QAM16, COFDM-QAM64, signal parameters auto detection mode will be activated. Signal quality parameters measurement After DVB-T/H demodulator synchronization has been achieved, the Analyzer will measure the signal quality. - Page 26 To measure the signal quality parameters in a channel, select the required one by « » and « » keys. To enter the channel number from the keypad, first press «F1». enter channel message will be for a short moment displayed on the screen. To enter the number use the alphanumeric keys set.
-
Page 27: Measurement Parameters Setting Mode
To view only quadrant of the diagram, select the required one using «◄» and «►» arrows and press «F4» key. To return to full diagram screen press «F4» again. To check the current channel parameters you can use the supplementary table. To access this table, press «F3». -
Page 28: Data Logger Function
(for up to 100 MHz-wide frequency bands). The Analyzer allows viewing the saved data off-line or by means of a computer. To check the data logger memory, the IT-088 offers memory manager mode. This mode allows testing, free resources determination, and formatting of the memory. - Page 29 Figure 4.14 The table represents a channel plan. The top line (index 1) divides the table into columns. The first column is the number of frequency point (from 1 to 112). The second column is the frequency of the point in kHz (index 2). The third column is the number of TV channel covering the frequency point (index 4).
- Page 30 g) Modulat: type of modulation (for channels with digital modulation). The following values are available: ------, QAM16, QAM32, QAM64, QAM128, QAM256, COFDM- QPSK, COFDM-QAM16, COFDM-QAM64. «------» value indicates unknown type of modulation or its absence. DVB-C Channel Parameters: a) Symb rate: symbol rate (for channels with digital modulation). The values available from 1.000 to 7.200 Msps.
- Page 31 NOTE If demodulator startup error (section 6) has occurred during automatic determination of a channel plan or automatic setting of frequency point parameters, search for the DVB-T/H channels setting parameters will not be performed. To edit the frequency point name, scroll the marker to the Name position and press «►»...
-
Page 32: Channel Data Logger
(section 4.3.10): Threshold parameter. Select the channel plan number and press «F4». The IT-088 will search for channels and define their type (analogue or digital). If scanning of digital channels is set by the measurement parameter setting function (section 4.3.10), the Analyzer will define the modulation type and symbol rate. - Page 33 Figure 4.18 Figure 4.19 The screen shows the CDL pages. On the first screen the top row of the table (index 1) divides the table into columns. The first column (index 2) shows the page numbers from 1 to 112. The second column (index 3) is the channel plan number. The third column (index 4) is the measurement date.
- Page 34 c) viewing and editing of the template data (Error). Select by «F3» key. Allows selecting a parameter of the template used for CDL checking, and edit its value. d) viewing of the CDL page in bar-graph mode (Bar). Select by «F4» key. Allows viewing the measurement results in SCAN mode (section 3.4.3).
- Page 35 i) dL(dF=100MHz).The parameter defines the maximum possible value of difference between any channel levels in any 100MHz range. Can be adjusted within 5…12 dB. The default value is 7 dB. j) dL(next Ch). The parameter defines the maximum possible value of difference between adjacent channel levels.
-
Page 36: Spectrum Data Logger
SDL allows viewing the measurement results and uploading the data to your PC for further processing and report preparation. SDL of IT-088 is compatible with IT-081 and IT-087 analyzers, and allows viewing SDL pages of these devices. - Page 37 «MENU/ENTER». The progress indicator of the spectrum scanning will appear. When the scanning has been completed your IT-088 will save the page (with the time and date), and turn to viewing mode of the recorded page. You can access the table of SDL pages by pressing «MENU/ENTER».
-
Page 38: Memory Manager
4.5. Memory Manager 4.5.1. General Information The IT-088 is equipped with nonvolatile NVRAM with independent power supply for storage of various data of the Data Logger. The NVRAM is powered either from the main batteries or, if main batteries are not available, from a standby built-in battery. -
Page 39: Testing The File Structure
The first column (MemType) displays the names of the memory structures: a) Ch Pln: channel plans (IT-081 Meter, IT-087 or IT-088 Analyzer); b) DL Chan: channel logs (IT-081 Meter, IT-087 or IT-088 Analyzer ); c) DL Spec: spectrum logs (IT-081 Meter, IT-087 or IT-088 Analyzer);... -
Page 40: Clearing The Memory
If the test result is positive, a norm message will be displayed. If any defect is discovered, an error message will be displayed. In this case the IT-088 should be sent back to manufacturer or to a repair service. -
Page 41: Self-Test Mode
4.6. Self-Test Mode 4.6.1. General Information To check the performance of the components of IT-088 and their functional conditions, self-test mode can be used. The icon corresponds to this mode. See figure 4.33: Figure 4.33 The table displys the following parameters to be checked: a) Temperature. -
Page 42: Standby Battery Voltage
The battery function is a power supply to the system clock, memory (for saving the current Analyzer settings), and NVRAM of the Data Logger for the case when the main batteries are not available. If low status is indicated, the IT-088 should be sent to repair service to have its battery replaced. -
Page 43: Lcd Backlight Setting
The following parameters are available for editing: a) Backlight. LCD backlight setting; b) Contrast. LCD contrast setting; c) Sound volume. Audio volume setting; d) Sound check. Audio indication check switch; e) Language. Language selection; Adjust clock. Reference clock frequency setting; g) Date. -
Page 44: Reference Clock Frequency Setting
4.7.7. Reference Clock Frequency Setting The parameter is intended for fine tuning of the reference clock operation. To tune the frequency, select the corresponding parameter by «◄» and «►» keys. The possible value range is from -31 to + 31%. If the reference clock is «fast», decrease the value, and if the clock is «slow», increase this value. -
Page 45: Audio Indication Check
4.10. Operation Controlled by PC 4.10.1. General Information You can control operation of your IT-088 via PC. For connection to PC use Serial Port connector on the right panel of your Analyzer. In the IT-088 package there comes included cable for connection to PC and a CD with the software, which allows the following:... -
Page 46: Software Installation
To start the program on your PC, select «Start->Programs->ViewIt 1.5->ViewIt for IT- 08» in Windows main menu. ATTENTION Before you start the program, make sure that your IT-088 is connected to the computer correctly, the power is switched on, and the Analyzer is in «Waiting for command»... -
Page 47: Program Main Window
4.10.5. Program Main Window After you have started the program, the main window will appear on the PC display. The screen view is represented in figure 4.36. The main window contains the following elements: a) menu bar; b) instrument control panel; c) video carrier level diagram;... -
Page 48: Files Management
Analyzer in accordance with the selected channel plan. The frequency range of the diagram is the full operating frequency range of the IT-088. The diagram panel has controls for selection of the area for viewing of the required spectrum region. -
Page 49: Channel Diagram
To save the measured results and the current settings of the program into a file, select «Save» in «File» menu. If the data were not saved before, the standard dialogue box for file saving will open. Set the file name and its location. Click «OK» to confirm saving. The name of the currently open file will be displayed in the title bar of the program. -
Page 50: Spectrum Analyzer
a) select «Channel plan selection» command in «Channels» submenu of the program menu bar; b) in the pop up window select the line of the required channel and click «ОК». 4.10.7.3. Channel Diagram Saving The program offers the capability of the channel diagram data export into the files of standard formats. - Page 51 Figure 4.42 The spectrum diagram displays the spectrum region within the selected frequency and level limits. The maximum frequency resolution is 125 kHz. The maximum level resolution is 0.1 dB. The viewing area limits in frequency and level are defined by the controls on the channel diagram.
- Page 52 b) select «Delete marker» command in the right-click menu or click button. You can adjust the position of the frequency marker in two ways: a) change the frequency by dragging the marker in the diagram. Find the marker on the spectrum diagram (you can use «Show marker» command). Move the mouse pointer over the marker, then press and hold left button of the mouse.
-
Page 53: Digital Signal Measurement Mode
4.10.9. Digital Signal Measurement Mode The additional window displays the instrument settings when the digital signal measurements are performed and the measured values. The view of this window is shown in figure 4.43. Figure 4.43 The frequency and modulation parameters setting panel is located in the upper part of the window. -
Page 54: Data Logs Management
4.10.10. Data Logs Management 4.10.10.1. General Information The IT-088 TV Signal Analyzer allows saving the measured results into the specially organized memory. The channel data logs store the measurement results as channel parameters. The view of a channel data log page is shown in figure 4.44. - Page 55 Figure 4.44 The data log manager allows viewing, printing out and exporting the data logs conveniently represented on the screen. To provide an easy search of the required logs, the program offers the search engine for various search criteria: log page number, channel plan name or number, or time of the recording.
- Page 56 Analyzer yet. To save a page into the Analyzer, select «Apply changes» button. To abort saving a page into the IT-088, click «Cancel changes». To delete one or several log pages from the Analyzer, highlight these pages in the list and click «Delete page».
- Page 57 Figure 4.47 4.10.10.3. The parameter, which does not match the template will be highlighted in the table. To view and print out the report on a log page click «View and print report». The preview window will appear on the screen. In this window you can view, add text comments, and print out the report (section 4.10.13).
-
Page 58: Channel Plan Management
The list of the channel plans is stored in the Analyzer, that is why to operate it, you need to connect your IT-088 to PC. You can view and edit the list of the channel plans in «Channel plans» window, which you will access via «Device/Channel plans»... - Page 59 To view and edit the list of the channel plans, find «Channel plans» command in «Analyzer» submenu. «Channel plans» window will open. The list of the channel plans is read ut at each start of the program or each opening of «Channel plans» window. After channel plan list editing by the Analyzer you will need to update the information on PC using «Plan list updating»...
-
Page 60: Tv System Editor
4.10.12. TV System Editor The IT-088 offers the capability to download a predefined TV channel allocation system on the Analyzer using a PC. To preview, edit and download the system table on to the Analyzer, use «TV system editor» window, which is accessible via «TV systems»... -
Page 61: Report Viewing And Printout
4.10.13. Report Viewing and Printout The preview window allows viewing and preparing the report for printing. The view of the window is shown in figure 4.52. Figure 4.52 Select the page to be viewed using «First page», «Last page», «Previous page», «Next page»... - Page 62 c) color display settings. Figure 4.53 «Communication port» setting defines what COM port will be used by the program for communication with the Analyzer. The drop-down list contains a number of COM ports registered in Windows. Select the COM port, which your Analyzer is connected to. CAUTION Incorrect setting of this parameter will lead to the loss of connection with the Analyzer.
-
Page 63: Information Panel
(see section 4.7). To update your software, proceed as follows: a) connect your IT-088 to the serial port of the PC by means of a regular cable; b) create on your PC a new folder, e.g. «ItUpdate». Copy «SoftLoader» installer- program into this folder from our website (this program is also available on the CD supplied with the Analyzer). - Page 64 «Start» and follow the instructions of the program. First, a warning notice will appear advising you to power off your IT-088 and check the connection of the cable to the PC serial port. Then another information window will appear; follow its instructions.
-
Page 65: Software Updating By Means Of Mc-088 Removable Module
4.11.2. Software Updating by means of MC-088 Removable Module The IT-088 features function of saving the instrument software into the storage element of the MC-088 Removable Module. The software update starts automatically after power on in case the installed software is not compatible with this Removable Module or if the software on the Base Unit is of an earlier version. -
Page 66: Dvb-T/H Demodulator Software Updating
IT-088. Each version of the software has its unique date of upgrading. To update your software, proceed as follows: a) connect your IT-088 to the serial port of the PC by means of a regular cable; b) copy the new version of automatic SW update program from our website (file name similar to «DemodSoft_IT088(30_09_08).exe»). -
Page 67: Maintenance
DC power source included in the set, and power it. The batteries will keep recharging even if the IT-088 is switched off. The backlight of «STD BY» button indicates that the power from the source is being supplied. In this case the full recharge will take from 12 to 14 hours. -
Page 68: Storage
С, relative humidity up to 90 % (at 30 С). 8. TRANSPORTATION The IT-088 must be shipped in any closed vehicle at temperature from -20 to +40 С, relative humidity 90% (at 30 С) and atmospheric pressure of 84 to 106.7 kPa (630 to 800 mm Hg). - Page 69 The manufacturer will repair or replace without charge, at its option, any IT-088 Digital TV DVB-T Signal Analyzer found defective in manufacture within the warranty period, which is twenty four (24) months from the date of purchase. Should the user fail to submit the warranty card appropriately certified by the seller with its stamp and date of purchase the warranty period will be determined by the date of manufacture.
-
Page 70: Appendix
11. APPENDIX 11.1. Frequency Table for D/K Standard Channels This East European standard is used in a number of countries of East Europe, CIS and some African countries. Table 11.1 Ref. Channel F bottom F top F video F audio 48.5 56.5 49.75... - Page 71 Table 11.1 (continued) Ref. Channel F bottom F top F video F audio 343.25 349.75 351.25 357.75 359.25 365.75 367.25 373.75 375.25 381.75 383.25 389.75 391.25 397.75 399.25 405.75 407.25 413.75 415.25 421.75 423.25 429.75 431.25 437.75 439.25 445.75 447.25 453.75 455.25 461.75...
- Page 72 Table 11.1 (continued) Ref. Channel F bottom F top F video F audio 663.25 668.75 671.25 676.75 679.25 684.75 687.25 692.75 695.25 700.75 703.25 708.75 711.25 716.75 719.25 724.75 727.25 732.75 735.25 740.75 743.25 748.75 751.25 756.75 759.25 764.75 767.25 772.75 775.25 780.75...
-
Page 73: Frequency Table For B/G Standard Channels
11.2. Frequency Table for B/G Standard Channels This is a West European standard, which is used in most West European countries. Table 11.2 Ref. Channel F bottom F top F video F audio 48.25 53.75 55.25 60.75 62.25 67.75 105.25 110.75 112.25 117.75... - Page 74 Table 11.2 (continued) Ref. Channel F bottom F top F video F audio 351.25 356.75 359.25 364.75 367.25 372.75 375.25 380.75 383.25 388.75 391.25 396.75 399.25 404.75 407.25 412.75 415.25 420.75 423.25 428.75 431.25 436.75 439.25 444.75 447.25 452.75 455.25 460.75 463.25 468.75...
- Page 75 Table 11.2 (continued) Ref. Channel F bottom F top F video F audio 671.25 676.75 679.25 684.75 687.25 692.75 695.25 700.75 703.25 708.75 711.25 716.75 719.25 724.75 727.25 732.75 735.25 740.75 743.25 748.75 751.25 756.75 759.25 764.75 767.25 772.75 775.25 780.75 783.25 788.75...
-
Page 76: Frequency Table For M/N Air Standard Channels
11.3. Frequency Table for M/N AIR Standard Channels This American standard of terrestrial TV is used in the countries of North and South America, and also in South Korea. Table 11.3 Ref. Channel F bottom F top F video F audio 55.25 59.75 61.25... - Page 77 Table 11.3 (continued) Ref. Channel F bottom F top F video F audio 615.25 619.75 621.25 625.75 627.25 631.75 633.25 637.75 639.25 643.75 645.25 649.75 651.25 655.75 657.25 661.75 663.25 667.75 669.25 673.75 675.25 679.75 681.25 685.75 687.25 691.75 693.25 697.75 699.25 703.75...
- Page 78 Table 11.3 (continued) Ref. Channel F bottom F top F video F audio 855.25 859.75 861.25 865.75 867.25 871.75 873.25 877.75 879.25 883.75 885.25 889.75...
-
Page 79: Frequency Table For M/N Catv Standard Channels
11.4. Frequency Table for M/N CATV Standard Channels This American standard is for cable television, it is used in the countries of North and South America, and in South Korea. Table 11.4 Ref. Channel F bottom F top F video F audio 97.25 101.75... - Page 80 Table 11.4 (continued) Ref. Channel F bottom F top F video F audio 355.25 313.75 361.25 317.75 367.25 321.75 373.25 325.75 379.25 329.75 385.25 333.75 391.25 395.75 397.25 401.75 403.25 407.75 409.25 413.75 415.25 419.75 421.25 425.75 427.25 431.75 433.25 437.75 439.25 443.75...
- Page 81 Table 11.4 (continued) Ref. Channel F bottom F top F video F audio 595.25 599.75 601.25 605.75 607.25 611.75 613.25 617.75 619.25 623.75 625.25 629.75 631.25 635.75 637.25 641.75...
Need help?
Do you have a question about the IT-088 and is the answer not in the manual?
Questions and answers