Table of Contents
Advertisement
Quick Links
Advertisement
Table of Contents

Summary of Contents for DYT H2F
- Page 1 Instruction Manual of H2F Mobile Phone Infrared Thermal Imager Version (V1.0)
- Page 2 Version Modification Author Business reviewer Remarks number date V1.0 2022.4.3 Xia Xiaosong Newly created Copyright Statement All contents of this manual are copyrighted by Shenzhen Dianyang Technology Co., Ltd., which shall not be imitated, copied or translated in any way without the permission of the Company. This manual contains no warranty, expression of position or other implication in any form.
-
Page 3: Table Of Contents
Table of Contents PRODUCT OVERVIEW ..............2 PRODUCT CHARACTERISTICS ..........3 PRODUCT SPECIFICATIONS ............4 APPEARANCE AND EQUIPMENT CONNECTION ....5 APP FUNCTION INTRODUCTION ..........6 APP Download and Installation ............6 Interface Introduction ...............6 Function Introduction ...............8 5.3.1 Setting ........................8 5.3.2 About ........................ -
Page 4: Product Overview
Product overview H2F mobile phone infrared thermal imager is a portable infrared thermal imaging analyzer with high precision and quick response, which adopts an industrial-grade infrared detector with small pixel spacing and high resolution ratio, and is equipped with a 3.2mm lens. The product is lightweight and portable, and can be used directly when plugged in. -
Page 5: Product Characteristics
Product Characteristics ⚫ It has high-quality optical lens and high-resolution detector, with excellent imaging effect; ⚫ It is lightweight and portable, and can be used with mobile APP to perform professional thermal imaging analysis anytime and anywhere; ⚫ It has a wide temperature measurement range: -15℃ - 450℃; ⚫... -
Page 6: Product Specifications
Product Specifications Infrared thermal imaging Detector resolution 256x192 Spectral range μm 8-14 Frame rate 25Hz <50mK @25℃ NETD 56° x 42° Lens 3.2mm Temperature -15℃~450℃ measurement range Temperature measurement accuracy ± 2 ° C or ± 2% of reading Temperature Highest, lowest, central... -
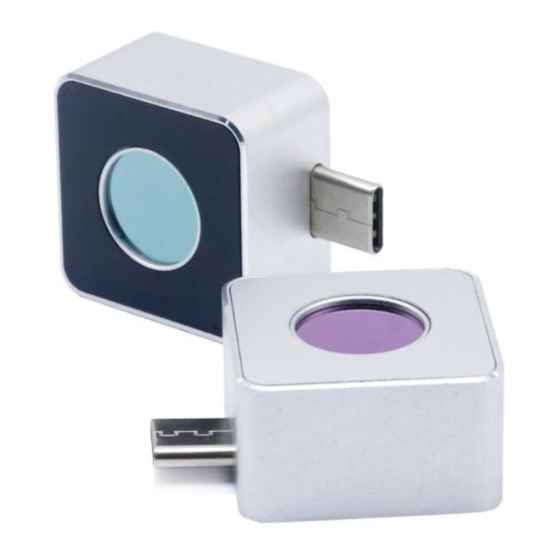
Page 7: Appearance And Equipment Connection
Appearance and Equipment Connection Hardware Appearance and Part Name Figure 4-1 0-1... -
Page 8: App Function Introduction
OTG in the settings) Interface Introduction Connect H2F to an Android phone and run APP, and you can see the interface as shown in Figure 5-1: Figure 5-1 0-1 Figure 5-1 0-1... - Page 9 Provide App interface and parameter setting ① Setting of infrared thermal imaging camera ② About Some information about the App Reset all kinds of information in the screen ③ Reset and restore it to the state at startup ④ Photo Taking Take photos and store them in an album Make a video recording and store it in an ⑤...
-
Page 10: Function Introduction
Function Introduction 5.3.1 Setting Click the [Settings] button to pop up the settings panel as shown in Figure 5- 2. Figure 5-2 0-2See Table 2 for the description of each setting item in the panel. Table 2 2 Figure 5-2 0-2 General items Language English... -
Page 11: About
Parameter Emissivity parameter values shall be filled in according Emissivity to the measured target Parameter values shall be filled in according to the Humidity (%) humidity of the test environment Correction parameters shall be filled in according to the Correction (℃) temperature measurement deviation Reflection Parameter values shall be filled in according to the... -
Page 12: Photo Taking
Figure 5-4 0-4 5.3.4 Photo Taking Click the [Photo Taking] button to take the current infrared screen and save it automatically. The photo button will remain red for one second and the heat map window will have an animation that is drawn into the album when the photo is successfully taken. -
Page 13: Video Recording
5.3.5 Video Recording Click the [Video Recording] button to record a video. When the [Video Recording] button is clicked, the button will turn red accordingly, and the recording time will be displayed correspondingly in the lower left corner of the video window at the same time. -
Page 14: Color Palette
Figure 5-7 0-7 ① Album Photos and video files are displayed at the same time ② Photo Only photo files are displayed Only video files are displayed, with the video duration in the ③ Video preview image Trash ④ Files are selected and then deleted 5.3.7 Color Palette There are 6 display modes on the color palette, as shown in Figure 5-8. - Page 15 Figure 5-8 0-8 In the high-temperature region, red has a large proportion, which is suitable for detecting the scenario Iron red where the high-temperature region occupies the main proportion The high-temperature section adopts white, and the White full screen mainly adopts black-and-white transition, heat which is suitable for users of black-and-white traditional mode...
- Page 16 The main colors are red and black, and from the minimum temperature to the maximum temperature, Red heat the black, white and red transition mode is adopted, which is suitable for scenarios focusing on the high temperature state Cold Blue is used to mark the colder regions, which is more blue suitable for observing low-temperature target objects By adjusting the color palette bar on the right side of the screen, the...
-
Page 17: Regional Temperature Measurement
Figure 5-9 0-9 Figure 5-9 0-9 5.3.8 Regional Temperature Measurement Click the [Regional Temperature Measurement] button on the right, and the following interface will pop up, allowing the temperature measurement of points, lines and rectangular boxes to be added to the video, in which the lines and rectangular boxes will display the real-time maximum temperature and minimum temperature of the region. -
Page 18: Temperature Tracking
Figure 5-10 0-10 5.3.9 Temperature Tracking Click the temperature tracking button on the right to enable or disable the measurement of the maximum temperature, minimum temperature and center point temperature in the real-time screen. Red is the maximum temperature, blue is the minimum temperature, and yellow is the center point temperature. -
Page 19: Rectangle Temperature Measurement
Figure 5-11 0-11 5.3.10 Rectangle Temperature Measurement The current temperature in all rectangular boxes can be highlighted. If there is no rectangular box in the current screen, a rectangular box will be automatically added in the default position. By long pressing the rectangular box, its size can be adjusted and its position can be dragged, and by clicking the delete icon next to it, the rectangular box can be deleted. -
Page 20: High Temperature Alarm
Figure 5-12 0-12 5.3.11 High Temperature Alarm Click the switch icon of [High temperature Alarm], and a window for setting the high temperature alarm threshold value pops up on the interface, as shown in the figure below When the maximum temperature value in the screen is higher than the alarm threshold value (in the regional temperature measurement mode, the temperature in the region is taken as the benchmark, except point measurement), the system will sound an alarm, and the video screen will flash a red alarm. -
Page 21: Highlighted High-Temperature Regions
Figure 5-13 0-13 5.3.12 Highlighted High-temperature Regions In this mode, the high temperature region is displayed on the current color board, and the other regions are displayed as white heat, and the temperature range can be adjusted by the slider on the right side of the color board bar. The analysis mode of highlighted high-temperature regions facilitates most application scenarios that focus solely on temperature values of high-temperature regions. -
Page 22: Precautions For Use And Maintenance
Precautions for Use and Maintenance 1. It is forbidden to use alcohol, detergent and other organic cleaners to clean the lens. It is recommended to wipe the lens with soft objects dipped in water. 2. Do not let sunlight, laser and other strong light sources directly illuminate the lens, otherwise the thermal imager will suffer irreparable physical damage. -
Page 23: Packing List
Packing List Name Quantity H2F host 1 set Lens cleaning cloth 1 pcs Cloth bag 1 pcs Instruction manual 1 pcs... -
Page 24: Appendix
Appendix Table of Reflectivity of Common Materials Material Emissivity Material Emissivity Asphalt 0.90 to 0.98 Cloth (black) 0.98 Concrete 0.94 Skin (human body) 0.98 Cement 0.96 Leather 0.75 to 0.80 Sand Charcoal (powder) 0.96 Soil 0.92 to 0.96 Paint 0.80 to 0.95 Water 0.92 to 0.96 Paint (matte)
Need help?
Do you have a question about the H2F and is the answer not in the manual?
Questions and answers