
Summary of Contents for Omegawave OMEGAZONE
- Page 1 191030 Laser Speckle Blood Flow Imager OMEGAZONE OZ-2 mini User’s MANUAL ( LSI : ver. U4.2, LIA : ver4.3)
-
Page 2: Table Of Contents
TABLE OF CONTENTS Page ■ CAUTION ■ SUMMARY ■ HARDWARE 1. Parts name and the function 2. Setup of the stand 4. Lens adjustment 5. Polarization adjustment 6. Block Diagram ■ LSI software 1. Controls and display 2. Project Configuration File 3. -
Page 3: Caution
______________ This manual is changed without a preliminary notice. There is a copyright of this manual in OMEGAWAVE, INC. A reproduction without permission is prohibited in any kind of form. Microsoft and Windows are registered trademarks of Microsoft Corporation. -
Page 4: Summary
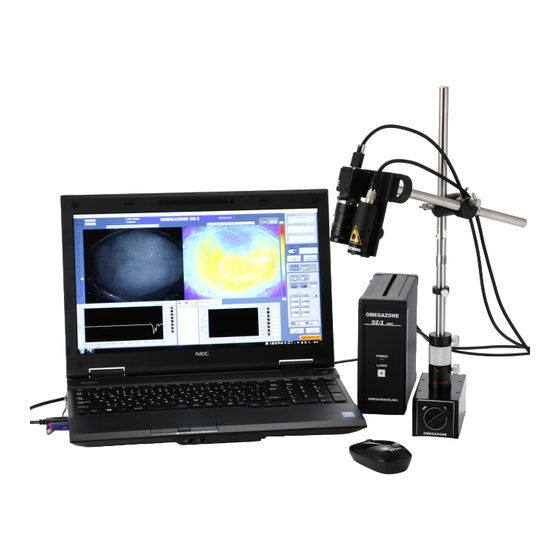
This OMEGAZONE OZ-2 mini consists of the laser unit, the CCD camera, the lens + hybrid filter, the computer-based image processor and the stand. The AC power is just needed for the computer-based image processor, and it is easy to handle and operate. -
Page 5: Hardware
HARDWARE 1. Parts name and Function Pole Stand 3. CCD camera + Lens 1.Computer-based Image Processor 1.Computer-based 4.Laser Unit Image Processor 2. Power supply 6. USB key 1) Computer-based imager processor This computer-based imager processor shows tissue blood flow images calculated by the installed software. - Page 6 2) Power supply The power supply contains the laser drive circuit, and the intermediate connector for the CCD camera. The power of this power supply is from USB of the computer-based image processor, and it does not have the power switch itself.
- Page 7 3) CCD camera and Lens The images are captured with the CCD camera. The camera is held on the hold plate. The hybrid filter is attached on the lens. This is the specialized filter combined of the polarizer and the color filter not to camera detect the direct reflection from tissue Hold plate...
- Page 8 4) Laser unit The laser diode (wavelength : 780 nm) is installed in the unit. The shutter is attached on the bottom. Pull the shutter knob to open. ※ Shut the shutter when the measurement is over to not to collect dust on the lens inside.
- Page 9 2. Set up of the Pole stand The Pole stand is composed of the magnet base, the cramp, the stopper and 2 poles. (1) Insert the longer pole to the magnet base. Fix the pole by the screw on the upper position. (2) Put the cramp through the longer pole.
- Page 10 Install the Laser unit on the Hold plate by the exclusive screw. Exclusive screw アーム (5) Turning the knurling part can be used for fine adjustment of the working distance. The range is 10 mm. (6) Connect the CCD camera cable and the laser cable to the CCD camera and the Laser unit.
- Page 11 3. Wiring 1) Connection for the Computer-based image processor (1) Connect the AC power cable to the rear side. AC power (2) Connect the USB key to the USB connector on the right side. (3) Connect the USB cable from USB key the CCD camera to the USB connector on the left side.
- Page 12 4. Adjustment of Lens The mono-focal lens has iris and a focus adjustment function. (1) Select the lens and the space adjuster for the desired measurement area, and decide the WD (working distance). Set the Hold plate for the WD by using the Cramp.
-
Page 13: Block Diagram
6. Block Diagram 780 nm Laser 780 nm Laser diode drive circuit... -
Page 14: Lsi Software
LSI Software (LSI ver.U4.2) 1. Summary The LSI software is for measuring and saving blood flow images. This software consists of two views. ■Project Configuration File ■LSI Front Panel 2. Project Configuration File The display is shown after the LSI worked. 1) Working Directory and File name The display shows the directory where images will be stored. - Page 15 The folder " Test " is opened after clicking " OK ". Assign the file name in the box. Without assigning a specific name, “Image” will be the file name automatically. Do not use “BF” for the original file name because it is recognized as the “Blood Flow Image”...
- Page 16 The specific file name that a user can assign is the place for “Image”. Do not change the name after the specific name. The software cannot recognize as the sequence data images when the file name after the specific name are changed. When the file specific names have to be changed, change the all-specific names of the sequence data images.
- Page 17 7) Measurement Press the OK button to go to the LSI Front Panel or the Cancel button to exit the LSI program.
-
Page 18: Lsi Front Panel
3. LSI Front Panel LSI Front Panel Base display Example of measurement... - Page 19 1) Video Controls These are controls to display real and real-time images of blood flow images. Click the switch to show the images. Click again to stop showing the images. In the Real Video mode, only real images are displayed at 30 frames per second.
- Page 20 an integer value that can be controlled by adjusting the “ Multi “ value in the HS AVG box. Resolution : 212 - 160 Name of the saved file : HSABF No 3) Blood Flow Capture Controls and Parameters The function allows image(s) to be captured and saved. Both real and blood flow images are saved to the selected directory entered in the folder assigned at Working Directory and File name.
- Page 21 7) Gain & Intensity The bar next to the Real Image shows the brightness intensity of the captured image. The slide switch is used to adjust the brightness. Control the intensity not to show the red signal. 8) Real Image Display The real images are shown in black and white.
- Page 22 (3) For rectangle and oval regions, while holding the left mouse button down, drag the mouse cursor to the appropriate end point of the region and then release it. (4) For the polygon, left click the mouse button once at the appropriate starting point, release, and move the cursor to a second point of the desired shape, left click the mouse button, release, and continue in a similar fashion until a polygon shaped boundary is completed and cursor has returned to the starting point...
- Page 23 Blood Flow Value box and represents an instantaneous time point in the Mean Blood Flow Plot. 14) Area (pixels) The number of pixels within the chosen region for analysis 15) Marker Pressing this button makes the punch in the Blood Flow Image Display, and makes the line in the Mean Blood Flow Plot.
- Page 24 MIN. (c) Coefficient : Select from Coefficient A or Coefficient B. These coefficient are used for calculating blood flow value. The lenses used in OMEGAZONE have different specifications, and the coefficient should be matched with the lens.
- Page 25 4. Operation of LSI 1) Setup (1) Install the tissue to be measured under the laser unit and the CCD camera with lens. The relation between W. D., the distance between the tissue and the lens, and the measurement area is shown in the table in Appendix.
- Page 26 5) End LSI program To end LSI program select Exit from the File menu.
-
Page 27: Lia Software
LIA Software (LIA ver.4.3) 1. Summary This LIA software is for analyzing blood flow image data saved by the LSI software. This software consists of two views. ■ Analysis Configuration File ■ LIA Front Panel 2. Analysis Configuration File The display is shown after the LIA worked. 1) Working Directory and File name Assign the folder for analyzing the blood flow data. - Page 28 When " Test " folder is opened, the image folders and the information file exist. " Blood Flow Image " folder : Color blood flow images are stored. " Real Image " folder : Black/white real images by laser light are stored. "...
- Page 29 2) Total Disk Size Displays, in bytes, the total size of the disk containing the working directory. 3) Free Disk Space Displays, in bytes, the free space remaining on the disk containing the working directory. (When the total free disk space is below 30 Mega-bytes the user is warned) 4) Used Disk Space Displays, in bytes, the used space of the disk containing the working directory.
-
Page 30: Lia Front Panel
3. LIA Front Panel IA Front Panel Base display Example of analysis... - Page 31 1) File Management Controls There are functions for loading images and saving images. Pressing the Load Image button allows to showing the saved images. Select the image files from Blood Flow Image or Real Image folders in the folder saved images are stored.
- Page 32 (1) MAX : Sets the maximum value in the box. (2) MIN: Sets the minimum value in the box. 5) Tool Palette The Tool Palette has the next tools to enclose a region of interest (ROI). The LIA has 8 ROIs. l Line Draws a line.
- Page 33 (5) For the free hand shape, left click the mouse cursor in the image window and hold the button down while drawing the desired shape. Finish the shape off by enclosing it with the cursor ending at the starting point. Release the left mouse button and the shape should be presented.
- Page 34 Displayed only during the Play Movie mode. During the plating of a movie the Analysis Information File Display is replaced with the Mean Blood Flow Plot of the Mean Blood Flow Value represented with in the chosen Analysis Region. 11) Next, Previous Function of showing the next, or previous image one by one.
- Page 35 Sample table-1 : Excel file : FLOW values in ROIs include zero value. Sample table-2 : Excel file : FLOW values in ROIs does not include zero value. (3) Color Bar : Selection of the color distribution of the blood flow images. Standard : Conventional color distribution Enhanced : Blue and red are enhanced.
- Page 36 (4) ROI : ROIs can be saved and reloaded. (a) Saving of ROIs Select " Save " command from " ROI " in the menu bar after setting ROI on the image. The display for entering the file name of the ROI is shown. This ROI is named as "...
- Page 37 (b) Loading of ROIs Select " Load " command from " ROI " in the menu bar. The list of the saved ROIs are shown.
- Page 38 Choose one ROI from the list. The ROI is added on the image after clicking " OK ". The same number of ROI can be saved, but only one of the same numbered ROI is added on the image.
- Page 39 (c) Information of ROIs The information of the ROIs on the image can be obtained from " Information ". The information of the ROIS are shown like the figure below. These information is for the displayed ROIs on the image.
- Page 40 14) Saving the setting and initial setting (1) Pressing the Save Setting button will save the setting of (a) Values of MAX and MIN, (b) Y axis of Mean Blood Flow Plot, (c) Y axis of Histogram, (d) Figures and the positions of ROIs, and (e) N of Skip.
- Page 41 16) B This slide switch is used to adjust the brightness of Real Image (2). The change of the brightness does not affect the blood flow value. 17) Rotation function Real Image and Blood Flow Image can be rotated by clicking this button. The images rotate clockwise by 90 degrees.
- Page 42 4. Operation of LIA 1) Start the LIA software. Enter the information in the Analysis Configuration File, and click OK. 2) Press the Load Image button on the Front Panel. 3) Select the folder to be analyzed and open it. 4) Select the blood flow image in the BF Images folder, and click the file.
-
Page 43: Handling In Use
Handling in use 1. Be careful to the next matters for install. (1) Install this instrument in the place where water does not hang. (2) Install this instrument in a place without fear to produce bad influence by atmospheric pressure, temperature, the humidity, ventilation, sunlight, dust, salt, and the air that includes sulfur. - Page 44 5. Do not remodel and modify. 6. Maintenance (1) Perform a periodic inspection by all means. (2) When the instrument was not used for a while, confirm that it operates normally and safely before use by all means.
-
Page 45: Appendix
Appendix 1. Matrix for measurement area by Lens, spacers and WD OZ-2 mini : Lens type and the measurement area (mm) (mm) (mm×mm) 190(MIN) 11 x 14 MF50 400(MAX) 28×36 150(MIN) 8×11 400(MAX) 28×36 130(MIN) 7×9 295(MAX) 18×24 85(MIN) 14×18 MF25 400(MAX) 61×82... -
Page 46: Time For Saving Data And Capacity
2. Time for saving data and Capacity The relation between the size of the captured image and the capacity is described below. File size HDD capacity [GB] Capture Capture time [KB] Number 266,000 about about These are dependent on the condition of the HDD. 3. -
Page 47: Specification
Specifications (Hardware) Note type computer-based image processor 115 (100~120VAC) / 230 (200~240VAC) ,50/60Hz Input voltage 100W Size (mm) about 380 × 40 × 250 (W×H×D) Weight (kg) about 3 Windows 10 Core i7 Memory over 2GB Hard disk crive over 500GB Multi Drive Monitor 15.6 inch, 1920 x 1080... - Page 48 Specifications (Software) LSI (Measurement) Mode HR, Hi-Speed, HS-AVG 1) HR about 1 image/sec display (High Resolution) 639×480 resolution 2) HS about 15 images/sec display (High Speed) 212 × 160 resolution 3) HSA Averaging of HS mode (HS Average) 212 × 160 resolution FLOW Averaged blood flow value inside ROI Selection of region for obtaining FLOW : 2 locations...
-
Page 49: Guarantee
1) Wrong usage, the damage caused by an accident by carelessness 2) Damage and malfunction caused by fire, natural disaster and outside factors. OMEGAWAVE, INC. 2-20-3 Katamachi, Fuchu, Tokyo, Japan 183-0021...
Need help?
Do you have a question about the OMEGAZONE and is the answer not in the manual?
Questions and answers