Table of Contents
Advertisement
Advertisement
Table of Contents

Summary of Contents for BANGGOOD GS-320
- Page 1 GS-320 6G Vector Network Analyzer device User manual...
-
Page 2: Table Of Contents
CONTENT 1 SUMMARY..............................1 1.1 introduction............................1 1.2 application............................1 1.3 working conditions..........................1 2 DELIVERY LIST............................1 3 SPECIFICATIONS............................1 4 NOTICES................................2 5 COMPOSITION OF THE DEVICE.......................3 5.1 The composition of the device is shown in Figure 5.1................3 5.2 The block of buttons for controlling the device is shown in Figure 5.2..........3 6 TURNING ON/OFF............................ -
Page 3: Summary
设备使用说明书 SUMMARY 1.1 introduction Portable 1-port 6G Vector Network Analyzer (hereafter the reflectometer, the device) are designed to measure the matching characteristics of passive and active radio devices (antennas, cables, filters, attenuators, amplifiers, etc.). The device allows you to measure the parameters of the complex reflection coefficient, standing wave ratio (VSWR), impedance, admittance, magnitude, phase, loss and distance to fault in the cable. -
Page 4: Notices
设备使用说明书 Table 2 Parameter name Value Operating frequency range 23MHz-6200MHz Frequency resolution, for frequencies 100-6200 MHz 10KHz Maximum number of scan points 1000 Scanning rate 1000 points/s The direction of the bridge, uncorrected throughout the range > 12 dB Directivity effective (after full single-port calibration) >... -
Page 5: Composition Of The Device
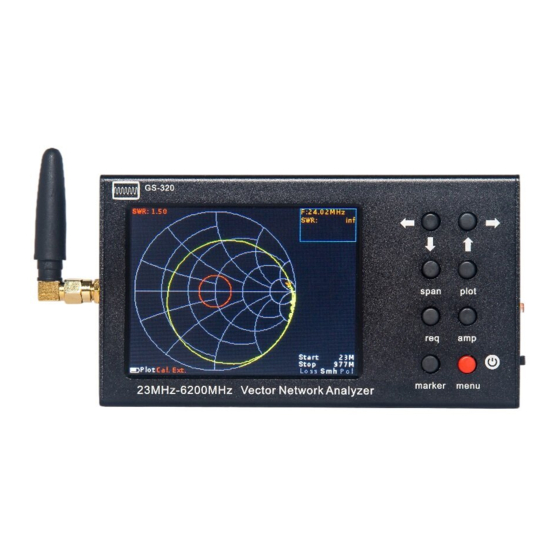
设备使用说明书 9、Do not allow children to play with the device, as they could hurt or injure others, or disable the device. 5 COMPOSITION OF THE DEVICE 5.1 The composition of the device is shown in Figure 5.1 Figure 5.1 External view of the device 1.RF test port;... -
Page 6: Turning On/Off
设备使用说明书 Figure 5.2 Control buttons unit 8.<move>Buttons for moving markers, moving in frequency and amplitude, changing the scanning range. 9.<span>switching buttons (8) to the mode for changing the scan range at a constant center frequency (widening and narrowing of the range). - Page 7 设备使用说明书 Figure 7.1 - Screen of the device 7.1 In Figure 7.1, in the lower left corner of the screen is placed the indicator (A) of the status of the internal battery, which, depending on the state of the battery, can be displayed as: indicator in the form of a spark (lightning) - battery is charging;...
- Page 8 设备使用说明书 7.5. In the lower right corner of the screen, the type of the plot is displayed on the device screen (E) (Figure 7.1): Smh - Volpert-Smith chart allowing to display the complex reflection coefficient, relative to an impedance of ...
-
Page 9: Device Menu
设备使用说明书 8 DEVICE MENU 8.1 Main menu 8.1.1 Turn on the device in accordance with section 6 of this Manual. After switching on the device, press the "menu" button. The device will display the main menu as in Figure 8.1. Figure 8.1 –... - Page 10 设备使用说明书 Figure 8.2 – Menu for setting scan parameters 8.2.2. Each of the options in the Frequency menu has its own purpose: Center – setting the center frequency of the scan range. Span – scanning band (range) of frequencies. Start – setting the initial frequency of the scanned frequency range. Stop –...
- Page 11 设备使用说明书 Figure 8.3 – Entering numerical values of frequency parameters of the device 8.2.4. Frequency parameters are set in three ways: By entering the initial Start and final Stop frequencies, while the center frequency Center is automatically assumed equal to their half-sum. The range of scanned frequencies Span is automatically taken equal to the difference between the final and initial frequencies.
-
Page 12: Plots Menu Settings Displayed On The Screen Plots
设备使用说明书 Figure 8.5 – Choosing the bandwidth in the BW menu 8.2.6. In the Points menu (Figure 8.6), the user sets the number of scan points. The scanning step in frequency and the scanning time depend on the specified number of points. The correct choice of the number of points and scanning range allows to improve the resolution at a number of measurements (DTF, Loss). -
Page 13: Markers Menu
设备使用说明书 Figure 8.7 – The setup menu for the displayed plots 8.3.2. In the Plots menu, the plots displayed on the screen are selected and the parameters displayed are set. To display the plot on the device screen, you need to check the box next to the plot name, and to disable it, uncheck it. - Page 14 设备使用说明书 8.4.2. On all plots displayed on the device screen, except for DTF and Loss, you can display up to four ulti-colored markers to display numerical measurement results. Switching off and on the marker is made by moving the corresponding slider against the selected marker to the Off / On position. Markers are completely independent of each other and can be tuned by the type of values displayed by the marker and by frequency.
- Page 15 设备使用说明书 8.4.5. To set the frequency on which the marker will be set, in the menu of markers (Figure 8.8) in the Frequency column, click on the corresponding marker. A submenu for entering numerical values will appear on the screen, as in Figure 8.10. Figure 8.10 –...
- Page 16 设备使用说明书 Figure 8.11 – Display of parameters measured by markers To quickly change the displayed parameters or the frequency of one of the four markers displayed near the plot, click on the marker parameters area and go to the express settings menu of markers (Figure 8.12). Figure 8.12 –...
- Page 17 设备使用说明书 the backlit block will result in the return of the display parameters. Pressing the “menu” button returns to the viewing plot. Table 4 below shows the types of displayed parameters in the express menu. Table 4 - The value of the parameters of the express menu of setting markers 8.4.8.
-
Page 18: Device Calibration Menu
设备使用说明书 Figure 8.14 – Express menu for setting the time parameters of the DTF plot markers Note – The parameters of the markers (time or distance) depend on the selected Scale units of measurement in the marker setting menu for the DTF plot. In addition to entering numerical values, markers can be moved left-right along the plot using the navigation buttons and switching between the markers with the button “marker”. - Page 19 设备使用说明书 additional adapters and cables, it is necessary to make a full single-port calibration using a set of calibration measures purchased separately. 8.5.1. To enter the calibration menu, enter the device main menu by pressing the "menu" button (Figure 8.1) and select the Calibration section.
- Page 20 设备使用说明书 Figure 8.16 – Calibration of the device Note – To cancel (erase) this or that calibration, click on the Erase button, and reconnect the appropriate calibration measure, calibrate the device again. 8.5.4. On the screen in the plot display mode, the calibration information will appear in the lower information line: No Cal –...
-
Page 21: Custom Settings Menu
设备使用说明书 Figure 8.17 – Warning on the device screen 8.6 Custom settings menu To save custom settings (frequency setting, calibrations, types of displayed plots of marker settings), enter the main menu by pressing the “menu” button (Figure 8.1) and select the Presets section. A menu of user settings will appear on the screen, as in Figure 8.18. -
Page 22: Device Information
设备使用说明书 Note – Saving the user setting takes about 2 seconds, at this time the device does not respond to touching the screen and pressing buttons. 8.6.3. To load the saved settings, click on the field with the desired frequency plan. The device will load the saved data and go into the display mode of the plot that was displayed at the moment of saving the settings. - Page 23 设备使用说明书 Figure 8.20 – Turning on the display of the VSWR limit line on the Smh, Pol charts and SWR plot 8.8.4. To change the display value of the level of the VSWR limit line, click on the numerical value Value, and in the appeared submenu (Figure 9.21), enter a numeric value in the range from 1.01 to 9.00.
Need help?
Do you have a question about the GS-320 and is the answer not in the manual?
Questions and answers